HAL Id: hal-00296533
https://hal.archives-ouvertes.fr/hal-00296533
Submitted on 5 May 2008
HAL is a multi-disciplinary open access
archive for the deposit and dissemination of
sci-entific research documents, whether they are
pub-lished or not. The documents may come from
teaching and research institutions in France or
abroad, or from public or private research centers.
L’archive ouverte pluridisciplinaire HAL, est
destinée au dépôt et à la diffusion de documents
scientifiques de niveau recherche, publiés ou non,
émanant des établissements d’enseignement et de
recherche français ou étrangers, des laboratoires
publics ou privés.
resolved visible satellite observations on surface
temperature
T. Wagner, S. Beirle, T. Deutschmann, M. Grzegorski, U. Platt
To cite this version:
T. Wagner, S. Beirle, T. Deutschmann, M. Grzegorski, U. Platt. Dependence of cloud properties
derived from spectrally resolved visible satellite observations on surface temperature. Atmospheric
Chemistry and Physics, European Geosciences Union, 2008, 8 (9), pp.2299-2312. �hal-00296533�
www.atmos-chem-phys.net/8/2299/2008/ © Author(s) 2008. This work is distributed under the Creative Commons Attribution 3.0 License.
Chemistry
and Physics
Dependence of cloud properties derived from spectrally resolved
visible satellite observations on surface temperature
T. Wagner1,2, S. Beirle1, T. Deutschmann2,1, M. Grzegorski2,1, and U. Platt2
1MPI for Chemistry, Mainz, Germany
2Institut f¨ur Umweltphysik, University of Heidelberg, Heidelberg, Germany
Received: 13 November 2007 – Published in Atmos. Chem. Phys. Discuss.: 23 November 2007 Revised: 4 March 2008 – Accepted: 21 April 2008 – Published: 5 May 2008
Abstract. Cloud climate feedback constitutes the most
im-portant uncertainty in climate modelling, and currently even its sign is still unknown. In the recently published report of the intergovernmental panel on climate change (IPCC), 6 out of 20 climate models showed a positive and 14 a
neg-ative cloud radineg-ative feedback in a doubled CO2 scenario.
The radiative budget of clouds has also been investigated by experimental methods, especially by studying the rela-tion of satellite observed broad band shortwave and long-wave radiation to sea surface temperature. Here we present a new method for the investigation of the dependence of cloud properties on temperature changes, derived from spectrally resolved satellite observations in the visible spectral range. Our study differs from previous investigations in three impor-tant ways: first, we directly extract cloud properties (effective cloud fraction and effective cloud top height) and relate them to surface temperature. Second, we retrieve the cloud altitude
from the atmospheric O2absorption instead from thermal IR
radiation. Third, our correlation analysis is performed us-ing 7.5 years of global monthly anomalies (with respect to the average of the same month for all years). For most parts of the globe (except the tropics) we find a negative correla-tion of effective cloud fraccorrela-tion versus surface-near temper-ature. In contrast, for the effective cloud top height a pos-itive correlation is found for almost the whole globe. Both findings might serve as an indicator for an overall positive cloud radiative feedback. Another peculiarity of our study is that the cloud-temperature relationships are determined for fixed locations (instead to spatial variations over selected areas) and are based on the “natural” variability over sev-eral years (instead the anomaly for a strong El-Nino event). From a detailed comparison to cloud properties from the
In-Correspondence to: T. Wagner
(thomas.wagner@mpch-mainz.mpg.de)
ternational Satellite Cloud Climatology Project (ISCCP), in general good agreement is found. However, also systematic differences occurred indicating that our results provide inde-pendent and complementary information on cloud properties. Climate models should thus aim to reproduce our findings. Recommendations for the development of a “processor” to convert model results into the cloud sensitive quantities ob-served by the satellite are given.
1 Introduction
Clouds have a strong impact on both, the short-wave solar radiation and on the outgoing thermal radiation (e.g. Ra-manathan and Inamdar, 2006). If cloud cover increases, less solar radiation reaches the ground, but also more thermal ra-diation from the surface will be trapped in the atmosphere. Both effects influence the surface-near temperature (ST) with opposite signs, and their net effect depends on various cloud properties, especially on the cloud altitude (Stephens, 2005; Cess et al., 1992; Hartmann et al., 2001; Fu et al., 2002; Cess and Udelhofen, 2003; Webb et al., 2006; Kubar et al., 2007). Today, the magnitude, and even the sign of cloud feedback is still not known (see e.g. the IPCC 4th assessment report: Solomon et al., 2007, and references therein).
Besides modelling studies (Cess et al., 1990, 1996; Soden and Held, 2006; Webb et al., 2006; Larson and Hartmann, 2003; Bony and Dufresne, 2005; Williams et al., 2006), cli-mate feedbacks have been investigated also from experimen-tal data and their combination with model results. Most stud-ies investigated the relation of broad band short wave and long wave radiation and cloud properties to spatial variations of the surface temperature (Ramanathan et al., 1989; Harri-son et al., 1990; Stephens and Greenwald, 1991). Other stud-ies investigated seasonal variations, anomalstud-ies during strong
El-Nino events or temporal trends (Cess et al., 1992, 2003; Bony et al., 1997a, b; Tian and Ramanathan, 2002). Most of these studies were restricted to specific areas, e.g. the conti-nents or the tropics.
In this study we investigate the cloud relationships for fixed locations on a global scale using correlation analyses of monthly anomalies of effective cloud fraction and effective
cloud top height (derived from the atmospheric O2
absorp-tion) with those of ST. It should be noted that in contrast to trend analyses, our correlation studies are much less affected by instrumental degradation. The effective cloud fraction and effective cloud top height information is derived from 7.5 years of observations of the Global Ozone Monitoring Ex-periment (GOME) on board the European research satellite ERS-2. We relate the GOME results to ST observations for the same period (ST data are obtained from the Goddard In-stitute for Space Studies (Hansen et al., 2001; Reynolds et al., 2002), GISS, see Sect. 2.6).
2 Data sets used in this study
2.1 The GOME instrument
The GOME instrument aboard the European research satel-lite ERS-2 measures sunlight reflected from the Earth’s atmo-sphere and surface covering the wavelength range between 240 and 790 nm with moderate spectral resolution (Burrows et al., 1999) (0.2–0.4 nm FWHM). The satellite operates in a nearly polar, sun-synchronous orbit at 780 km altitude with an equator crossing time of approximately 10:30 a.m. local time. This has to be taken into consideration for the inter-pretation of our results, which might be only representative for mid-morning because of the diurnal variation of clouds (Bergman and Salby, 1996). The ground pixels cover an area of 320 km east to west by 40 km north to south. Simultane-ous to the spectral channels, also broad band intensities are measured by the so called polarization monitoring devices (PMD). Compared to the spectral channels, they have a much
finer spatial resolution of 20×40 km2. The Earth’s surface is
entirely covered within 3 days, and poleward from about 70◦
latitude within 1 day.
2.2 Effective cloud fraction derived from GOME
An effective cloud fraction (CF) is derived using the Heidel-berg Iterative Cloud Retrieval Utilities (HICRU, Grzegorski et al., 2006), which is based on the PMD observations. The CF is a product of the cloud top reflectance (depending on the cloud optical depth) and the geometrical cloud fraction; it is almost independent from cloud height. Effective cloud frac-tions range from 0 to 1 with individual values occasionally also slightly above and below this range due to the applied threshold method (Grzegorski et al., 2006). From sensitiv-ity studies we estimate the absolute uncertainty of an indi-vidual measurement over surfaces free of snow and ice to
range from 2% for almost clear pixels to 5% for CF>20% (expressed in absolute CF). The uncertainties for small CF are also confirmed by the scatter of the lowest CF around zero. Note that snow and ice-covered surfaces are classified as cloudy, leading to artificially high CF, especially in polar regions.
2.3 O2absorption derived from GOME
The O2 absorption at 630 nm is analysed using differential
optical absorption spectroscopy (DOAS, see Platt, 1994).
Besides the O2 absorption also spectra for the absorptions
of H2O and the oxygen dimer O4, as well as a Ring
spec-trum are included in the analysis; details of the retrieval can be found in Wagner et al. (2006a). One specific advantage of the DOAS method is that it analyses differential absorption structures and is therefore hardly affected by instrumental
degradation. The statistical uncertainty of the retrieved O2
absorption as determined from the non-linear least squares fitting routine is negligible (<0.3%) for monthly mean
val-ues. The observed O2 absorption depends on CF and the
effective cloud top height (CTH) of the cloudy part of the observed scene.
The retrieved quantity of the DOAS analysis is the
differ-ential optical depth (DOD) of the O2absorption at 630 nm
(for the spectral resolution of the GOME instrument). With
the knowledge of the O2 absorption cross section, the
mea-sured O2DOD can be converted into the O2 slant column
density (the O2 concentration integrated along the
atmo-spheric absorption path). In order to avoid any dependence
on the exact value of the O2absorption cross section, in this
study we decided to apply a normalisation approach to the
retrieved O2DOD (for details see Sect. 2.4).
2.4 Retrieval of the effective cloud top height using
radia-tive transfer modeling
The calculation of the effective cloud top height (CTH) from
the observed effective cloud fraction (CF) and O2
absorp-tion is based on the results of atmospheric radiative transfer
modelling of the O2 absorption. While the results of such
simulations provide the best means for the interpretation of
the O2absorption measurements, it is also instructive to
dis-cuss the general dependencies of the observed O2absorption
on cloud properties:
1. First, the observed O2absorption depends on the CTH:
with increasing CTH an increasing fraction of the
at-mospheric O2absorption is shielded. Thus high clouds
strongly reduce the observed O2absorption (shielding
effect).
2. Second, the observed O2 absorption depends on the
cloud top reflectance: with increasing brightness of the cloud top (depending mainly on the cloud optical depth)
an increasing number of the measured photons origi-nates from atmospheric layers at the cloud top (having
“seen” a larger O2absorption than photons scattered at
higher altitudes). In addition, multiple scattering inside the clouds (also depending on the cloud optical depth) can further increase the atmospheric absorption paths.
Both effects increase the observed O2 absorption (the
strongest increase is found for large cloud optical depth) and we will refer to them as albedo effect. For low cloud altitudes, the albedo effect can even overcompensate the shielding effect.
3. Third, the measured O2absorption depends on the CF.
The higher the CF is, the higher is the deviation of the
measured O2 absorption from the value for the cloud
free case.
We investigated the dependence of the measured O2
absorp-tion on CF and CTH in a quantitative way using our full spherical Monte-Carlo radiative transfer model TRACY-2 (Deutschmann and Wagner, 2006; Wagner et al., 2007). For
the modeling of the O2absorption of an individual satellite
ground pixel, we use the independent pixel approximation:
the O2absorption of the total ground pixel is the average of
the modeled O2absorptions for the clear and for the cloudy
parts (weighted by their geometrical fraction and their re-spective top of atmosphere reflectance). For the clear part, only Rayleigh scattering and surface reflection is considered. For the cloudy part, in addition to these effects, also scatter-ing by the cloud particles is taken into account. Note that in the current version of the algorithm, the Earth’s topography is not taken into account and the surface elevation is set to zero. Thus several areas had to be excluded from our corre-lation studies, see below. For the cloudy part, we assumed the following standardised cloud properties: optical depth: 50, phase function: Henyey-Greenstein using an asymmetry parameter of 0.85; single scattering albedo: 1, vertical thick-ness: 1 km. Note that the albedo of these clouds is about 80%, similar to the cloud albedo implicitly assumed in the HICRU algorithm (Grezegorski et al., 2006). It should also be noted that the CF determined by HICRU is representa-tive for the spectral range of the green and red PMD. From sensitivity tests it was found that the CF determined indepen-dently in both PMD channels are almost identical. Therefore we conclude that the HICRU CF are well suited for the
scal-ing of the O2absorptions of the clear and cloudy part. The
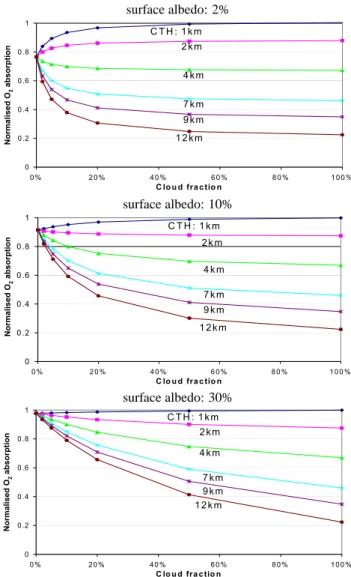
radiative transfer simulations were performed for three dif-ferent values of the surface albedo (2%, 10%, 30%). The
modeled normalized O2absorptions as a function of CF and
CTH are shown in Fig. 1. The calculated relationships – in particular for low CF – are strongly dependent on the surface albedo. In contrast, the dependence on the assumed value of the asymmetry parameter (not shown) is very weak, because for the assumed OD of 50 the number of scattering events is large. surface albedo: 2% surface albedo: 2% 0 0 .2 0 .4 0 .6 0 .8 1 0 % 2 0 % 4 0 % 6 0 % 8 0 % 1 0 0 % C lo u d fra c tio n N o rm a li s e d O 2 a b s o rp ti o n C T H : 1 k m 1 2 k m 9 k m 7 k m 4 k m 2 k m
surface surface albedo: 10% surface albedo: 10% 0 0 .2 0 .4 0 .6 0 .8 1 0 % 2 0 % 4 0 % 6 0 % 8 0 % 1 0 0 % C lo u d fr a c tio n N o rm a li s e d O 2 a b s o rp ti o n C T H : 1 k m 1 2 k m 9 k m 7 k m 4 k m 2 k m
surface surface surface albedo: 30% albedo: 30% 0 0 .2 0 .4 0 .6 0 .8 1 0 % 2 0 % 4 0 % 6 0 % 8 0 % 1 0 0 % C lo u d fra c tio n N o rm a li s e d O 2 a b s o rp ti o n C T H : 1 k m 1 2 k m 9 k m 7 k m 4 k m 2 k m
Fig. 1. Simulation of the measured normalised O2absorption as a
function of CF and CTH calculated from radiative transfer model-ing. The results are for different values of the surface albedo (top: 2%, center: 10%, bottom: 30%). Depending on the CTH and the
surface albedo, clouds can increase or decrease the measured O2
absorption compared to clear sky conditions. The results are
ob-tained for a line of sight angle of −90◦(nadir) and a solar zenith
angle of 20◦.
Finally, the O2absorptions are normalised with respect to
the maximum O2absorptions found for the same viewing
ge-ometry (the same solar zenith angle, line of sight angle and relative azimuth angle). The determination of the maximum
O2absorption was performed for each individual month
us-ing all measurements over the oceans of the respective month for the years between 1996–2003. Note that for each month
6 sets of maximum O2absorptions as a function of the solar
zenith angle are determined, three for the three line of sight angles and two sets for the two hemispheres. This procedure was chosen, because the combinations of line of sight angles
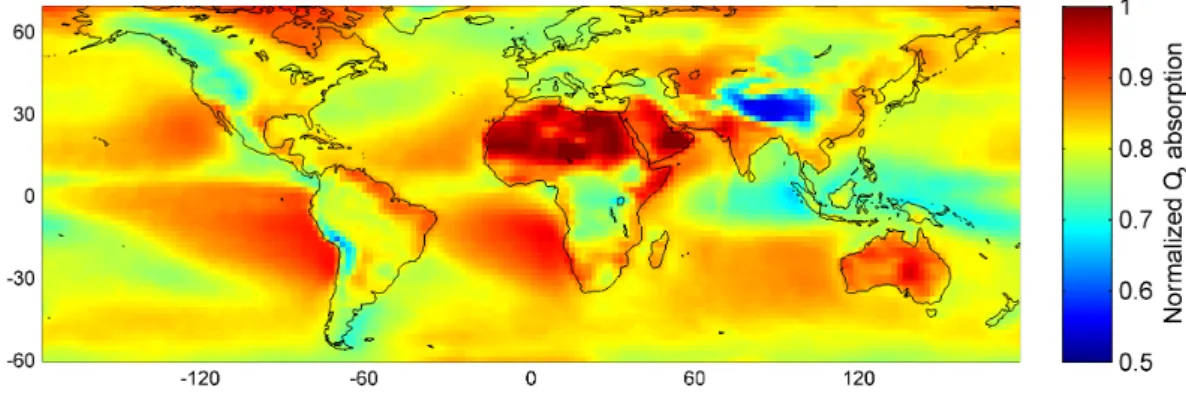
Fig. 2. Normalised O2absorption (with respect to the maximum O2absorption, see Sect. 2.4) averaged for the period January 1996–
December 2002.
and relative azimuth angles differ for both hemispheres and
vary also with season. The maximum O2absorptions are
de-termined with an automated routine on bins of 1◦solar zenith
angle. The results were visually inspected to avoid the possi-ble effect of outliers.
The normalization procedure using the maximum O2
ab-sorptions has the advantage that the calculation of the CTH can be performed using a single inversion scheme for a wide
range of solar zenith angles (SZA<85◦). In the
normaliza-tion procedure we also applied a correcnormaliza-tion for the effect
of non-linearity between the measured O2 absorption (for
the resolution of the instrument) and the corresponding
in-tegrated O2concentration along the atmospheric absorption
path (Wagner et al., 2003, 2005). The global averaged
nor-malised O2absorption is shown in Fig. 2. The observed
pat-terns mainly represent the shielding effect of clouds: small
O2 absorptions are found in regions with high cloud top
heights (a similar effect is found for regions with high sur-face elevation). Also the influence of the cloud frequency can be seen, e.g. with the highest values over the Sahara.
Based on the modeled dependence of the normalized O2
absorption we calculated the global distribution of the mean
CTH from the average values of the CF and the O2absorption
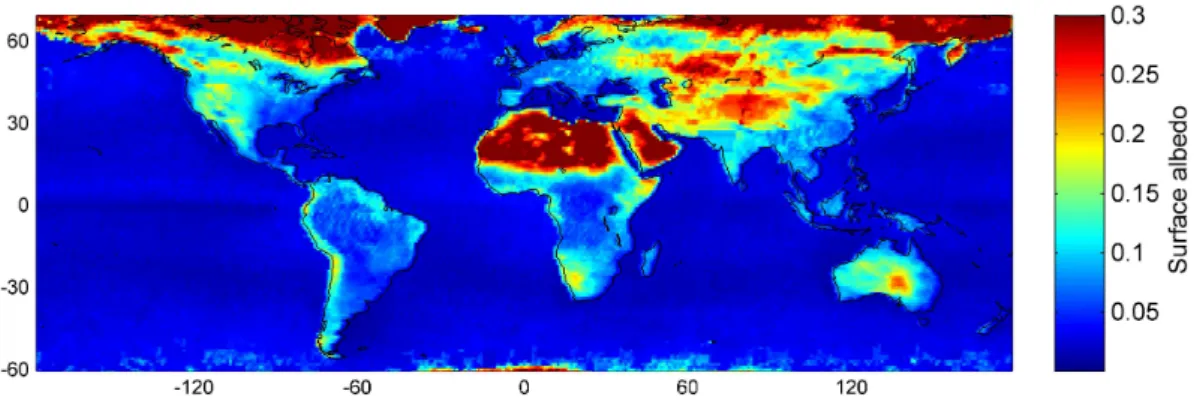
(Fig. 2) for the period January 1996–July 2003. For these cal-culations we also made use of the surface albedo at 670 nm as derived by Koelemeijer et al. (2003) (see Fig. 3). For each 2×2 degree grid of the globe the CTH was determined by linear interpolation of the modeled dependencies (Fig. 1) to the respective measured values of the CF, CTH and surface albedo.
Note that in our current algorithm, we had to exclude con-tinental areas with low CF (<7%) and high surface
eleva-tion (>1.2 km on a 2◦
×2◦ grid). For such conditions, the
measured O2absorption is reduced, because the total
atmo-spheric column is smaller than for zero elevation. In our
cur-rent algorithm, this decreased O2absorption would be
appar-ently interpreted as shielding effect due to clouds. In
connec-tion with the strong dependence of the O2absorption on CF
(see Fig. 1) this would lead to unrealistically high CTH. Note
that, for areas with surface elevation <1.2 km, still small er-rors in the CTH determination remain, especially for small CF. Nevertheless, in this study, we are primarily interested in the correlation of the monthly anomalies, which are hardly affected by these systematic errors. In future versions of our algorithm, however, this limitation can be generally cor-rected considering information on the global surface eleva-tion in the radiative transfer modeling.
2.5 Comparison to ISCCP data
We compared the GOME results of CF and CTH with satel-lite derived cloud properties from the International Satel-lite Cloud Climatology Project (ISCCP, D2 product, see e.g. Schiffer and Rossow (1983), Rossow and Schiffer (1999), and http://isccp.giss.nasa.gov/climanal.html). It should be noted that from such a comparison no exact agreement can be expected because of the different sampling times, spectral ranges, spatial resolutions and methodologies used. In par-ticular, the information on CTH is derived using completely different approaches (for ISCCP, CTH is derived from ther-mal IR observations).
First, we compare annual and seasonal averages of the GOME CF with ISCCP cloud amounts. Since ISCCP cloud amounts include clouds with different optical thickness (and thus different reflectance), they can not directly be compared to the GOME CF, which implicitly assumes a cloud albedo of about 80%. To allow a meaningful comparison, we con-structed a correction function for the ISCCP cloud amounts which takes into account the effects of varying cloud optical depth (see also Koelemeijer et al., 2002). For this correction function we used our radiative transfer model and assumed clouds with a geometrical thickness of 1 km, a single scat-tering albedo of 1 and a Henyey Greenstein function with an asymmetry parameter of 0.8 (note that the vertical struc-ture of the assumed clouds has only negligible influence on the correction function). Using this correction function, CF from ISCCP are calculated from the global distribution of ISCCP cloud amount and cloud optical depth and compared
Fig. 3. Annual average surface albedo (670 nm) taken from Koelemeijer et al. (2003).
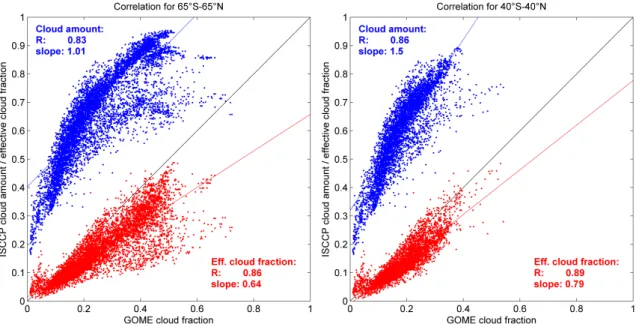
to GOME CF (Fig. 4). In general, good agreement of the spa-tial patterns in both data sets is found. For the absolute val-ues the differences can be substantial for several regions, as should be expected because of the rough assumptions made in the correction function. Over polar regions, GOME CF show artificially high values caused by snow and ice. The importance of the correction function for the ISCCP data is also illustrated in Fig. 5, which shows the spatial correlation of the annual averages for ISCCP cloud amounts and the cor-rected ISCCP CF with GOME CF. Note that the slope of the regression line depends mainly on the asymmetry parameter assumed in the correction scheme.
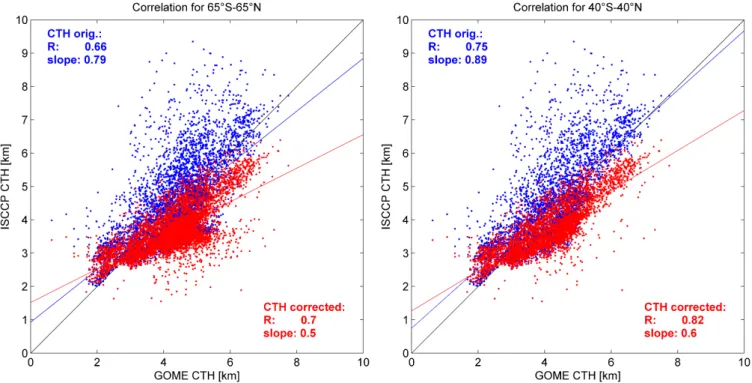
In a second step, we also compared the GOME CTH to ISCCP cloud pressures. First, we converted the ISCCP cloud pressures into cloud top heights using the pressure profile of the US standard atmosphere (United States Committee on Extension to the Standard Atmosphere, 1976). Then, as for the CF, we developed a correction scheme for the con-version of ISCCP cloud top height into effective cloud top height. The respective correction function depends on the optical thickness, but also on the cloud top height itself and on the surface albedo (note that for the seasonal averages, the respective averages of the surface albedo were used). The an-nual and seasonal averages of the extracted ISCCP CTH to-gether with the GOME CTH are presented in Fig. 6. Again, in general good agreement of the spatial patterns is found. For the absolute values the differences can be substantial for several regions, as should be expected because of the rough assumptions made in the correction function. The impor-tance of the correction function for the comparison to ISCCP data is illustrated in Fig. 7, which shows the spatial correla-tion of the annual averages for uncorrected ISCCP CTH and the corrected ISCCP CTH with GOME CTH.
As one outcome of the comparison of cloud products from GOME and ISCCP, we conclude that especially the
GOME CTH derived from the O2absorption provides
com-plementary information to ISCCP cloud pressures. Using GOME CTH data in addition to ISCCP cloud products for model comparisons should yield additional information on the cloud vertical structure. For that purpose, the use of a
“GOME-simulator” could be useful, which directly
gener-ates the cloud sensitive quantities (O2 absorption and CF)
observed by GOME from the model results. The develop-ment of such a GOME simulator is described in Sect. 3.3.
2.6 Surface temperature data
We relate the GOME results to surface near temperatures (ST) observations for the same period, which were taken from the Goddard Institute for Space Studies (GISS, see http: //www.giss.nasa.gov/data/update/gistemp/). Over the conti-nents, the ST data set is determined from meteorological observations. Over the oceans, the sea surface temperature is provided, which is constructed from in-situ observations (from ships and buoys), satellite observations of tempera-tures (day-time and night-time IR measurements), and ice coverage (microwave measurements over polar regions). The spatial variability of the sea surface temperatures is mainly derived from the satellite observations, where the night-time IR observations have the highest weight. The in-situ observa-tions are used to correct biases in the satellite data (e.g. after strong volcanic eruptions). For our analysis we used monthly mean values of ST. More details on the ST data set can be found in Hansen et al. (2001) and Reynolds et al. (2002).
3 Results
In this chapter we present correlation analyses of the cloud properties derived from GOME observations with ST. They are performed as follows: from the individual observations
of the CF and O2 absorption (and also ST) we calculated
monthly average values for the period January 1996 to July 2003. From these monthly averages, anomalies for individ-ual months are derived (deviation from the mean value of the respective month for all years). Using these monthly anoma-lies we performed correlation analyses of the CF versus ST
and the O2absorption versus ST. The technique of
correla-tions of monthly anomalies allows to extract valuable infor-mation on cloud-ST relationships from rather short periods of time. Note that the amplitude of the ST anomalies for the
Fig. 4. Comparison of the effective cloud fraction from GOME and ISCCP (annual and seasonal averages) for the period 1996–2003. For
the ISCCP data a correction procedure was developed which converts cloud amount and cloud optical depth into effective cloud fraction (see also text). Note that in polar regions the GOME data are strongly affected by snow and ice, which are mis-interpreted as clouds.
selected period ranges between about 2 K and 15 K, depend-ing on location on earth, with the highest amplitudes over the continents (see Fig. 8). Global maps of the calculated
corre-lation coefficients of the CF and the O2absorption versus ST
are shown in Fig. 9. Over large parts of the globe negative correlations are found for both quantities indicating that a
Fig. 5. Spatial correlation analyses between the GOME and ISCCP data sets (annual average) of effective cloud fraction (red) and cloud
amount (blue). After the ISCCP cloud amount is corrected for the effect of changing optical depth, improved agreement with the GOME data
is found. The left panel shows the results for all data between 65◦N and 65◦S latitude including also snow and ice covered observations.
The right panel shows the results between 40◦N and 40◦S.
positive (negative) anomaly of ST is associated with a
nega-tive (posinega-tive) anomaly in CF or O2absorption. One
promi-nent exception is the pronounced positive correlation of the CF versus ST over the tropical oceans close to the equator.
From the correlation analyses we determined the slopes of the regression of the monthly CF anomalies versus those of the ST (Fig. 10, top). The changes in CF with increasing ST are negative for most parts of the globe, except over the tropical oceans close to the equator. These findings are in good agreement with those of Bony et al. (1997a), who found a negative correlation of CF (and cloud optical depth) for
ST<26◦C and a positive correlation for ST>26◦C.
We also determined the slopes of the regression for the O2
absorption anomalies versus those of the ST. From these cor-relations and those of the CF versus ST (Fig. 10, top), we calculated the changes in the CTH per degree ST (Fig. 10, bottom) using our radiative transfer model results (Sect. 2.4). Over almost the whole globe, positive temperature anomalies are correlated with increases of CTH. Very strong changes in CTH are found over the tropical oceans close to the equator. Again our findings are in good agreement with those of Bony et al. (1997a), who found a weak positive correlation of CTH
for ST<26◦C and strong positive correlation for ST>26◦C.
They find a strong increase of cloud top height (from about
500 mb to 200 mb) for a temperature increase from about 26◦
to 29◦. Also Larson and Hartmann (2003) found an
increas-ing CTH of tropical clouds for increasincreas-ing ST. They found in particular that over tropical oceans, the frequency of situa-tions with large scale uprising air and high clouds increases
strongly for surface temperatures >26◦C.
3.1 Results for time series without the strong ENSO
1997/98
It is interesting to compare the results of the correlation anal-yses for periods including or excluding the strong ENSO event 1997/98. In Fig. 11 the variations of CF and CTH with changing ST are shown, based on correlation studies ex-cluding the period August 1997–July 1998. Comparing these results with those shown in Fig. 10, we find that over most parts of the globe the results are almost identical. Only over parts of the tropical oceans substantial differences are found. These findings indicate that results of our correlation studies are representative also for the natural temperature variations beyond strong ENSO events.
3.2 Discussion of various error sources
As stated in Sects. 2.2 and 2.3, the errors of the data
prod-ucts (CF and O2absorption) are typically by far smaller than
the observed dependencies per degree ST change. For the CF
the accuracy ranges from 2% to 5%, for the O2absorption the
precision is ∼0.3% (here systematic effects cancel out during the normalisation). Nevertheless, there are a number of addi-tional error sources (especially important for the correlation analyses), which are discussed in detail in this section.
One important question is whether the observed
varia-tion of the O2 absorption might be simply caused by the
changes of atmospheric pressure and temperature associated with variations of ST. In particular at mid latitudes cloud free situations are e.g. typically accompanied by high pressure
Fig. 6. Comparison of the effective cloud top height from GOME and ISCCP (annual and seasonal averages) for the period 1996–2003. For
the ISCCP data a correction procedure was developed which converts cloud pressure and cloud optical depth into effective cloud height (see also text). Note that in polar regions the GOME data are partly affected by snow and ice. For areas with low effective cloud fraction and high surface elevation, no meaningful inversion was possible with the current version of our algorithm (see text).
Fig. 7. Correlation analyses between the GOME and ISCCP data sets (spatial variation of the annual average) of cloud height (red:
uncor-rected ISCCP top height, blue coruncor-rected ISCCP effective cloud top height). After the ISCCP data is coruncor-rected for the effect of changing
optical depth, improved agreement with the GOME data is found. The left figure shows the results for all data between 65◦N and 65◦S
latitude including also snow and ice covered observations. The right figure shows the results between 40◦N and 40◦S.
Fig. 8. Global distribution of the maximum amplitude (top) and standard deviation (bottom) of the monthly anomalies of the ST. The
Fig. 9. Top: Correlation coefficients of the monthly anomalies of the effective cloud fraction versus surface-near temperature (top) and the
O2absorption versus surface-near temperature (bottom).
systems. However, from a quantitative analysis it turns out that the magnitude (and for most regions also the sign) of the
observed O2absorption changes can not be explained by the
direct influence of these meteorological parameters.
It should be also noted that for large SZA (> about 80◦,
corresponding to latitudes poleward of about 60◦), several
ef-fects can lead to increasing uncertainties compared to obser-vations at lower SZA. First, because of the long atmospheric light paths, the relative contribution of Rayleigh scattering to the total observed radiance increases. Since one inversion scheme is applied to the whole range of SZA, this leads to
systematic errors up to 5% for SZA<70◦and up to 20% for
SZA of 85◦. Second, because of the increased O
2
absorp-tion, the non-linearity between the measured O2absorption
and the integrated O2 concentration along the atmospheric
absorption path increases (see above). Third, and probably most important, the probability of interference with snow and ice-covered surfaces increases. The first two effects might lead to an error in the magnitude (but not the sign) of the cal-culated CTH change. The third effect, however, might even affect the sign of the calculated change in CTH (and also CF) per degree ST for some regions of the world. From correla-tion analyses for individual seasons (not shown) we found that snow and ice interference is typically not the dominant effect at high latitudes. Nevertheless, for detailed interpreta-tion of our results (e.g. comparison to models), high latitude data should be excluded as long as no detailed information
on the seasonal variation of snow and ice cover is included in the radiative transfer modeling. In this study we restricted
the analyses to latitudes between 70◦N and 60◦S. It might
be interesting to note here, that in principle, satellite
obser-vations of the O2absorption could yield very valuable
infor-mation on cloud properties over snow and ice covered sur-faces (for which observations in the thermal IR have limited sensitivity). However, this method is only useful in cases, for which the surface albedo is known from other sources. For example, over regions with permanent snow or ice cover, the
observation of the O2absorption could be a very interesting
option.
In our radiative transfer calculations, simplified homoge-nous cloud layers were assumed. In the presence of com-plex cloud formations, the photon paths between separated cloud fragments can become important because they can
en-hance the O2 absorption. In the case of horizontally
bro-ken cloud fields, the additional horizontal photon paths
typi-cally increase the O2absorption compared to a homogenous
cloud layer with similar total optical depth. Taking this
ef-fect into account, the observed decrease of the O2absorption
with increasing ST might be partly also caused by a change in the horizontal homogeneity of the cloud cover (towards a horizontally more homogenous distribution). However, from sensitivity studies using our radiative transfer model, we find
that the magnitude of the observed changes in the O2
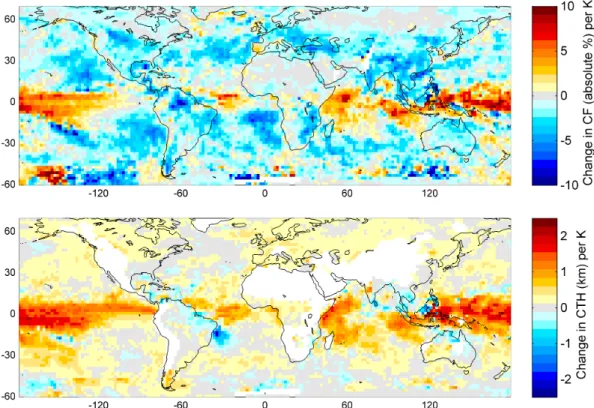
Fig. 10. Absolute changes of the effective cloud fraction (CF, top) and effective cloud top height (CTH, bottom) with increasing surface-near
temperature (ST). The changes of the CF are expressed as % (absolute CF) per degree ST; those of the CTH are expressed as km per degree
ST. Note that for high latitudes (poleward of about 60◦) our results have increased uncertainties because of the high solar zenith angles and
possible interference with ice and snow covered surfaces (see supplementary information). For areas with low effective cloud fraction and high surface elevation, no CTH determination was possible with the current version of our algorithm (see text).
Also vertical inhomogeneities (cloud layers) can increase
the O2 absorption due to enhanced photon paths between
separate cloud layers. From radiative transfer calculations we found that this effect is especially pronounced if rather thin cloud layers (optical depth<5) are located above cloud layers with higher optical depth. For such cases, an increase
of the altitude of the thin cloud layer can even increase the O2
absorption (the shielding effect is then slightly overcompen-sated by the increased path lengths of the photons “reflected” between the cloud layers). Thus, in principle, an observed
decrease of the O2absorption could even indicate a decrease
of the height of a thin cloud layer above the thick cloud layer located below. However, again this effect is rather small: an upward shift of a thin cloud located above a thick cloud can
cause an increase of the O2absorption which is at maximum
still three times smaller than the corresponding decrease of
the O2absorption caused by the same vertical shift of a thick
cloud (this effect would become even smaller if an asymme-try parameter of 0.75 is used, which is more representative for ice clouds). Thus this effect can by far not explain the
observed changes in the O2 absorption. We conclude that
only a change in the height of cloud layers with high optical depth (optical depth > about 10) can explain the observed
large changes in the O2absorptions due to the shielding
ef-fect. Changes of the inhomogeneities in vertical and
hori-zontal direction might explain only part of the observed O2
absorption changes.
The uncertainties of the GOME CTH are thus difficult to quantify, because they depend on many assumptions of the radiative transfer modeling, which can strongly differ from the real conditions. The CTH presented here represent the upper boundary of assumed horizontally homogenous clouds with a vertical extension of 1 km and an optical depth of 50. From the comparison with ISCCP CTH it was found that the GOME CTH describes well the general global distribution, but shows systematic differences depending on season and location.
In summary, we conclude that except in polar regions, the results of the correlation analyses can be interpreted in a quantitative way only for the CF. For the CTH, the results of the correlation analyses can be only considered as qualitative information. Note also that a more meaningful interpretation of the GOME observations is possible if a GOME simulator is applied to model data (see Sect. 3.3).
Fig. 11. Same as Fig. 10, but excluding the strong ENSO event (August 1997–July 1998). Even over the tropical oceans the differences
compared to Fig. 8 are rather small. For areas with low effective cloud fraction and high surface elevation, no CTH determination was possible with the current version of our algorithm (see text).
3.3 A GOME simulator for effective cloud fraction and O2
absorption
An advanced way to compare the GOME observations to the results of atmospheric models would be to directly simulate
the observed quantities, namely the O2absorption at 630 nm
and the CF, from the output of atmospheric models. In such a way especially the effects of vertical cloud structures (e.g. multiple cloud layers) could be directly taken into account and ambiguities could be avoided. Thus, the comparison of model results and measurements would be more straight forward. In the following the basic requirements for such a GOME simulator are discussed.
The basic step of the simulator would be to convert the model output (e.g. microphysical properties, or liquid wa-ter content) into vertical profiles of optical properties (e.g. extinction coefficient, asymmetry parameter and single
scat-tering albedo). In the next step, the O2 absorption and the
observed radiance are calculated based on these input param-eters (and also depending on the viewing geometry and tem-perature and pressure profiles). In the last step the modelled results are mapped to the area of the satellite observation. Depending on the spatial resolution of the model and satellite observation, this step might include the averaging of differ-ent model grid cells. Also a decision has to be made whether single satellite observations or temporal averages should be compared to the model results.
In principle for all these steps, procedures are already available (including e.g. our radiative transfer model) and can be implemented in the near future. It should also be noted that in more elaborate versions of a GOME simulator, also full 3-dimensional cloud structures (including horizontal gradients) might be considered. Similar GOME simulators could also address other cloud sensitive parameters like e.g. the Ring effect or the absorptions of the oxygen molecule or dimer at other wavelengths.
4 Conclusions
We applied a new method to investigate the relationships of CF and CTH with surface-near temperature based on the cor-relation of monthly anomalies. This method allows to extract information on these relationships from rather short periods of time. We found a negative correlation of effective cloud fraction (CF) with surface near temperatures (ST) for almost the whole globe, except the tropical oceans. For the effec-tive cloud top height (CTH) a posieffec-tive relation to ST varia-tions was found for almost the whole globe, with the high-est changes in the tropics. The observed relationships are new and in itself interesting experimental results, but might also provide information on cloud climate feedback. Since cloud climate feedback involves complex interactions, de-pending especially on cloud type, location and season, the
interpretation of our results with respect to climate feed-back is not straightforward. Therefore, one conclusion of our study is that the results should aim to serve as a test case for climate models. For that purpose, recommendations for the construction of a GOME simulator are given (Sect. 3.3). A GOME simulator would allow a detailed comparison of the model results to GOME observations and could espe-cially yield information on the vertical cloud structure. From our detailed comparison of cloud properties from GOME and ISCCP we found overall good agreement. It also turned out that GOME observations can yield independent and comple-mentary information on cloud properties (especially on the vertical structure), which might be worth to be considered in climate research.
In addition to model comparisons, it can be instructive to relate our results to the general dependencies of cloud forc-ing, especially with respect to cloud cover and cloud top height. These dependencies can be summarised as follows:
a) in general, clouds tend to cool the Earth-atmosphere-system. However, this depends especially on season and lat-itude. The cooling effect of clouds is especially strong in the summer hemisphere (Stephens, 2005; Ramanathan et al., 1989; Harrison et al., 1990).
b) the cloud greenhouse effect increases with increasing cloud top height (Stephens, 2005; Cess et al., 1992; Kubar and Hartmann, 2007).
Based on the first dependency, no clear general conclu-sions can be drawn here. The only significant conclusion might be that the negative correlation between ST and CF indicates a positive cloud feedback (especially in the sum-mer hemisphere). From the second dependency, however, we conclude that over almost the whole globe, our results indicate a positive cloud feedback. Note that these depen-dencies might only serve as an indication for the cloud feed-back, since they describe local correlations of cloud proper-ties and surface temperatures. Cloud climate feedback will, however, depend also on large scale changes which might not be well reflected by our results. Nevertheless, our new approach of correlating monthly anomalies might also have some advantages. It describes cloud-temperature relation-ships for the “natural” variability at fixed locations over 7.5 years, while other studies investigate changes associated with e.g. volcanic eruptions or ENSO events, or investigating the spatial variability. Here it is interesting to note that the ob-served correlations are largely independent on whether the strong ENSO event 1997/98 is included in the analysis or
not. Similar relationships between the CF, O2absorption and
ST as derived in this study are found in the spatial distribu-tion of trends (Wagner et al., 2006b) for the period January 1996–December 2002.
Acknowledgements. We like to thank the European Space Agency
(ESA) operation center in Frascati (Italy) and the “Deutsches Zentrum f¨ur Luft- und Raumfahrt” (DLR, Germany) for
mak-ing the ERS-2 satellite spectral data available. Surface-near
temperature data are from the Goddard Institute for Space Studies (GISS) (Hansen et al., 2001; Reynolds et al., 2002),
http://www.giss.nasa.gov/data/update/gistemp/). ISCCP data are
taken from the International Satellite Cloud Climatology Project (ISCCP, see e.g. Schiffer and Rossow, 1983; Rossow and Schiffer, 1999, and http://isccp.giss.nasa.gov/climanal.html).
Edited by: J. Quaas
References
Bergman, J. W. and Salby, M. L.: Diurnal variations of cloud cover and their relationship to climatological conditions, J. Climate, 9, 2802–2820, 1996.
Bony, S., Lau, K.-M., and Sud, Y. C.: Sea surface temperature and large-scale circulation influences on tropical greenhouse effect and cloud radiative forcing, J. Climate, 2055–2077, 1997a. Bony, S., Sud, Y., Lau, K.-M., Susskind, J., and Saha, S.:
Compar-ison and assessment of NASA/DAO and NCEP-NCAR reanaly-ses over tropical oceans: atmospheric hydrology and radiation, J. Climate, 1441–1462, 1997b.
Bony, S. and Dufresne, J.-L.: Marine boundary layer clouds at the heart of tropical cloud feedback uncertainties in climate models, Geophys. Res. Lett., 32, L20806, doi:10.1029/2005GL023851, 2005.
Burrows, J. P., Weber, M., Buchwitz, M., Rozanov, V., Ladst¨atter-Weißenmayer, A., Richter, A., DeBeek, R., Hoogen, R., Bram-stedt, K., Eichmann, K.-U., Eisinger, M., and Perner, D.: The Global Ozone Monitoring Experiment (GOME): Mission Con-cept and First Scientific Results, J. Atmos. Sci., 56, 151–175, 1999.
Cess, R. D., Potter, G. L., Blanchet, J. P., et al.: Intercomparison and interpretation of cloud-climate feedback processes in nine-teen atmospheric general circulation models, J. Geophys. Res., 95, 16 601–16 615, 1990.
Cess, R. D., Harrison, E. F., Minnis, P., Barkstrom, B. R., Ra-manathan, V., and Kwon, T. Y.: Interpretation of seasonal cloud-climate interactions using Earth Radiation Budget Experiment data, J. Geophys. Res., 97, 7613–7617, 1992.
Cess, R. D., Zhang, M. H., Ingram, W. J., Potter, G. L., Alekseev, V., Barker, H. W., Cohen-Solal, E., Colman, R. A., Dazlich, D. A., Del Genio, A. D., Dix, M. R., Dymnikov, V., Esch, M., Fowler, L. D., Fraser, J. R., Galin, V., Gates, W. L., Hack, J. J., Kiehl, J. T., Treut, H. L., Lo, K. K. W., McAvaney, B. J., Meleshko, V. P., Morcrette, J. J., Randall, D. A., Roeckner, E., Royer, J. F., Schlesinger, M. E., Sporyshev, P. V., Timbal, B., Volodin, E. M., Taylor, K. E., Wang, W., and Wetherald, R. T.: Cloud feedback in atmospheric general circulation models: An update, J. Geophys. Res., 101, 12 791–12 794, 1996.
Cess, R. D. and Udelhofen, P. M.: Climate change
dur-ing 1985–1999: Cloud interactions determined from
satellite measurements, Geophys. Res. Lett., 30, 1019,
doi:10.1029/2002GL016128, 2003.
Deutschmann, T. and Wagner, T.: TRACY-II Users manual,
University of Heidelberg (http://satellite.iup.uni-heidelberg.de/
∼tdeutsch/tracy-II/), 2006.
Fu, Q., Baker, M., and Hartmann, D. L.: Tropical cirrus and water vapor: an effective infrared iris feedback?, Atmos. Chem. Phys.,
2, 31–37, 2002,
http://www.atmos-chem-phys.net/2/31/2002/.
Grzegorski, M., Wenig, M., Platt, U., Stammes, P., Fournier, N., and Wagner, T.: The Heidelberg iterative cloud retrieval utilities (HI-CRU) and its application to GOME data, Atmos. Chem. Phys., 6, 4461–4476, 2006,
http://www.atmos-chem-phys.net/6/4461/2006/.
Hansen, J., Ruedy, R., Sato, M., Imhoff, M., Lawrence, W., Easter-ling, D., Peterson, T., and Karl, T.: A closer look at United States and global surface temperature change, J. Geophys. Res., 106, 23 947–23 963, 2001.
Hartmann, D. L., Moy, L. A., and Fu, Q.: Tropical convection and the energy balance at the top of the atmosphere, J. Climate, 14, 4495–4511, 2001.
Harrison, E. F., Minnis, P., Barkstrom, B. R., Ramanathan, V., Cess, R., and Gibson, G.: Seasonal variations of cloud radiative forc-ing derived from the Earth’s Radiation Budget Experiment, J. Geophys. Res., 95, 18 687–18 703, 1990.
Koelemeijer, R. B. A., Stammes, P., Hovenier, J. W., and de
Haan, J. F.: Global distribution of effective cloud fraction
and cloud top pressure derived from oxygen A band spectra measured bythe Global Ozone Monitoring Experiment: Com-parison to ISCCP data, J. Geophys. Res., 107(D12), 4151, doi:10.1029/2001JD000840, 2002.
Koelemeijer, R. B. A., de Haan, J. F., and Stammes, P.: A database of spectral surface reflectivity in the range 335–772 nm de-rived from 5.5 years of GOME observations, J. Geophys. Res., 108(D2), 4070, doi:10.1029/2002JD002429, 2003.
Kubar, T. L., Hartmann, D. L., and Wood, R.: Radiative and convec-tive driving of tropical high clouds, J. Climate, 20, 5510–5526, doi:10.1175/2007JCLI1628.1, 2007.
Larson, K. and Hartmann, D. L.: Interactions among cloud, wa-ter vapor, radiation, and large-scale circulation in the tropical climate, part I: sensitivity to uniform sea surface temperature changes, J. Climate, 16, 1425–1440, 2003.
Platt, U.: Differential optical absorption spectroscopy (DOAS), Air monitoring by spectroscopic techniques, edited by: Sigrist, M. W., Chemical Analysis Series, 127, John Wiley & Sons, Inc., 1994.
Ramanathan, V., Cess, R. D., Harrison, E. F., Minnis, P., Barkstrom, B. R., Ahmad, E., and Hartmann, D.: Cloud radiative forcing and climate; Results from the Earth Radiation Budget Experiment, Science, 243, 57–63, 1989.
Ramanathan, V. and Inamdar, A.: The radiative forcing due to clouds and water vapor, Frontiers of Climate Modeling, edited by: Kiehl, J. T. and Ramanthan, V., Cambridge University Press, 119–151, 2006.
Reynolds, R. W., Rayner, N. A., Smith, T. M., Stokes, D. C., and Wang, W.: An improved in situ and satellite SST analysis for climate, J. Climate, 15, 1609–1625, 2002.
Rossow, W. B. and Schiffer, R. A.: Advances in understanding clouds from ISCCP, B. Am. Meteor. Soc., 80, 2261–2287, 1999. Schiffer, R. A. and Rossow, W. B.: ISCCP: The first project of the World Climate Research Program, B. Am. Meteor. Soc., 64, 770– 784, 1983.
Soden, B. and Held, I.: An assessment of climate feedbacks in cou-pled ocean-atmosphere models, J. Climate, 19(14), 3354–3360, 2006.
Solomon, S., Qin, D., Manning, M., et al.: Climate Change 2007:
The Physical Science Basis, Contribution of Working Group I to the Fourth Assessment Report of the Intergovernmental Panel on Climate Change (IPCC), Cambridge University Press, Cam-bridge, United Kingdom and New York, NY, USA, 2007. Stephens, G. and Greenwald, T. J.: The Earth’s radiation budget and
its relation to atmospheric hydrology 2. Observations of cloud effects, J. Geophys. Res., 96, 15 325–15 340, 1991.
Stephens, G. L.: Cloud feedbacks in the climate system: A critical review, J. Climate, 18, 237–273, 2005.
Tian, B. and Ramanathan, V.: Role of clouds in surface and atmo-spheric energy budget, J. Climate, 15, 296–305, 2002.
United States Committee on Extension to the Standard Atmosphere: “U.S. Standard Atmosphere, 1976”, National Oceanic and Atmo-spheric Administration, National Aeronautics and Space Admin-istration, United States Air Force, Washington D.C., 1976.
Wagner, T., Heland, J., Z¨oger, M., and Platt, U.: A fast H2O total
column density product from GOME – validation with in-situ aircraft measurements, Atmos. Chem. Phys., 3, 651–663, 2003, http://www.atmos-chem-phys.net/3/651/2003/.
Wagner, T., Beirle, S., Grzegorski, M., Sanghavi, S., and Platt, U.: El-Ni˜no induced anomalies in global data sets of water vapour and cloud cover derived from GOME on ERS-2, J. Geophys. Res., 110, D15104, doi:10.1029/2005JD005972, 2005.
Wagner, T., Beirle, S., Grzegorski, M., and Platt, U.: Global trends (1996 to 2003) of total column precipitable water observed by GOME on ERS-2 and their relation to surface-near temperature, J. Geophys. Res., 111, D12102, doi:10.1029/2005JD006523, 2006a.
Wagner, T., Beirle, S., Grzegorski, M., and Platt, U.:
Investi-gating the Earth’s hydrological cycle using H2O VCDs and
cloud related parameters from GOME-II, Proceedings of the 1st EPS/MetOp RAO Workshop ESRIN, Frascati, Italy, 15– 17 May 2006 (http://earth.esrin.esa.it/workshops/EPS MetOp RAO 2006/proceedings/papers/p wagne.pdf), 2006b.
Wagner, T., Burrows, J. P., Deutschmann, T., Dix, B., von Friede-burg, C., Frieß, U., Hendrick, F., Heue, K.-P., Irie, H., Iwabuchi, H., Kanaya, Y., Keller, J., McLinden, C. A., Oetjen, H., Palazzi, E., Petritoli, A., Platt, U., Postylyakov, O., Pukite, J., Richter, A., van Roozendael, M., Rozanov, A., Rozanov, V., Sinreich, R., Sanghavi, S., and Wittrock, F.: Comparison of Box-Air-Mass-Factors and Radiances for Multiple-Axis Differential Op-tical Absorption Spectroscopy (MAX-DOAS) Geometries calcu-lated from different UV/visible Radiative Transfer Models, At-mos. Chem. Phys., 7, 1809–1833, 2007,
http://www.atmos-chem-phys.net/7/1809/2007/.
Webb, M. J., Senior, C. A., Sexton, D. M. H., Ingram, W. J., Williams, K. D., Ringer, M. A., McAvaney, B. J., Colman, R., Soden, B. J., Gudgel, R., Knutson, T., Emori, S., Ogura, T., Tsushima, Y., Andronova, N., Li, B., Musat, I., Bony, S., and Taylor, K. E.: On the contribution of local feedback mechanisms to the range of climate sensitivity in two GCM ensembles, Clim. Dynam., 27(1), 17–38, 2006.
Williams, K. D., Ringer, M. A., Senior, C. A., Webb, M. J., McA-vaney, B. J., Andronova, N., Bony, S., Dufresne, J.-L., Emori, S., Gudgel, R., Knutson, T., Li, B., Lo, K., Musat, I., Weg-ner, J., Slingo, A., and Mitchell, J. F. B.: Evaluation of a component of the cloud response to climate change in an in-tercomparison of climate models, Clim. Dynam., 26, 145–165, doi:10.1007/s00382-005-0067-7, 2006.