Analysis of Robotic Systems Test Methods Targeting Test Resource
Utilization Improvement
By
Chelsea Zarnowski B.S., Business and Mathematics
University of Puget Sound, Tacoma, Washington, 2007
Submitted to the MIT Sloan School of Management and the Department of Mechanical Engineering in partial fulfillment of the requirements for the degrees of
Master of Business Administration and
Master of Science in Mechanical Engineering
in conjunction with the Leaders for Global Operations (LGO) Program at the MASSACHUSETTS INSITUTE OF TECHNOLOGY
June 2019
Chelsea Zarnowski. All rights reserved.
The author hereby grants MIT permission to reproduce and to distribute publicly paper and electronic copies of this thesis document in whole or in part in any medium now known or hereafter created.
Signature of Author: Certified by: Certified by: Professor of S Accepted by: Accepted by: MASSACHUSETTS INSTITUTE OF TECHNOLOGY
JUN 0 4
2019
Signature redacted
Department of Mechanical Engineering, MIT SlgAn School of ManagementMay 10, 2019
Signature redacted
/
Kamal Yoicif-Toumi, Thesis Supervisor Professor of Mechanical Engineering, MIT School of EngineeringSignature redacted
tatistics,ckRoy Welsch, Thesis Supervisor Data Science 011i a em 4 MIT Sloan School of Management
Signature redacted
I
Nicolas HadjiconstantinouChair, Mechanical Engineering Committee on Graduate Students
Signature redacted
Maur&aHerson Assistant Dean, MBA Program MIT Sloan School of Management
Analysis of Robotic Systems Test Methods Targeting Test Resource
Utilization Improvement
By
Chelsea Zarnowski
Submitted to MIT Sloan School of Management on May 10, 2019 in Partial Fulfillment of the
requirements for the degrees of Master of Business Administration and Master of Science in Mechanical Engineering.
ABSTRACT
The robotics industry continues to grow rapidly. More industries are moving towards automation and are looking for the robotics industry to support the industry 4.0 movement. Due to a push by consumers, robotics producers are getting pressured by customers to deliver higher quality products faster. Motivated by Cost of Quality and Design of Experiments methods, the author breaks
down the production systems test of robot manufacturing to identify areas for the focus of experimentation to improve quality and resource utilization.
Considering connections between First Pass Yield and Field Failure Rates, the focus on quality improvement demonstrates the strong ties from the robot manufacturers to the final end user
customers. By analyzing the robotic production and test systems, the author identifies three areas for the focus of experiments:
1) Test effectivity 2) Component failure
3) Robot system and test cell matching.
Within each of these areas further analysis then identifies the experimental topics that can be developed through modified Design of Experiments steps to improve quality and remove the waste from failures and production system issues.
Thesis Supervisor: Kamal Youcef-Toumi Title: Professor of Mechanical Engineering Thesis Supervisor: Roy Welsch
Acknowledgements
I'd like to thank everyone who made completing this work possible. First, my husband, Andrew
Parker, for supporting me through my time at MIT and while doing this research. Also, my parents, Pete and Cheryl Zarnowski, for making me love learning from a young age and always helping me push myself to accomplish things I never thought possible. I could not have got through this thesis without my advisors Roy Welsch and Kamal Youcef-Toumi and the wonderful support from everyone at the company who allowed me to work with them to complete this research. Finally, I must thank my fellow LGO 2019s and all of their families for providing ongoing support even at moments they didn't know it was needed.
Table of Contents
1 Introduction ... 10
1.1 Industrial Robots History and M arket ... 10
1.2 Problem Statem ent ... 12
2 Background ... 15
2.1 Developm ent of M odern Quality and Reliability ... 15
2.2 Cost of Quality... 16
2.3 Design of Experim ents to Introduce Change ... 19
2.4 Robotics Production Line and System s Test Overview ... 20
2.4.1 Stress Testing for Undetectable Defects ... 23
2.4.2 Errors In System Testing ... 25
3 Prim ary Focus Area Analysis ... 27
3.1 Robotic M odel Variations and Selection ... 27
3.2 Identifying W astes... 28
3.2.1 W aste Type Analysis ... 28
3.2.2 First Pass Yield Necessary W aste Identification ... 30
4 Test Failure Analysis... 34
4.1 M ethod... 34
4.1.1 Define, Measure, Analyze, Improve, and Control Model for Design of Experiments 34 4.1.2 Failure M odes and Effects Analysis ... 35
4.2 Failure Types ... 38
4.2.1 By Test Analysis... 38
4.2.2 By Com ponent Analysis ... 40
5 The W aiting W astes ... 46
5.1 M anipulator, Controller, and Test Cell M atching ... 46
5.2 Test Cell Utilization... 47
6 Conclusion and Next Steps ... 50
List of Figures
Figure 1: Industrial Robot Unit Sales ... 11
Figure 2: Industrial Robots in Operation ... 11
Figure 3: Process Control Chart ... 15
Figure 4: Cost of Q uality Im pacts... 18
Figure 5: Production Flow to System s Test... 21
Figure 6: Robotics Production Systems Test Process Flow... 22
Figure 7: Systems Test Limit Impact on Customer Defects ... 24
Figure 8: Confusion Matrix for Error Type Identification ... 25
Figure 9: Six Axis Robot Diagram ... 27
Figure 10: Identification of Necessary W astes ... 32
Figure 11: Define, Measure, Analyze, Improve and Control Model for Design of Exp e rim e nts ... 3 4 Figure 12: All Robot Component Failures by Robot Family... 42
Figure 13: High Severity Robot Component Failures by Robot Family... 44
Figure 14: Delta Arrival Time for Manipulator and Controller ... 46
Figure 15: Test Cell and Robot System Delta Matching Time... 47
List of Tables
Table 1: Cost of Q uality M odels (10) ... 17
Table 2: Cost of Q uality Categories... 17
Table 3: Areas of W aste Identification ... 28
Table 4: Robot Test Data Collected... 35
Table 5: Severity Ratings Com parison ... 36
Table 6: Severity Ratings for Robot Production Systems Test... 37
Table 7: Failure Modes and Effects Analysis Combined Results... 38
1
Introduction
Consumer demands have continued to grow with the customer demanding newer products, faster, at higher quality with more customization. This trend is visible in both the consumer electronics industries and the auto industry, the two largest customers of industrial robots (1). The direct impact to the producers of these consumer goods is observable at the primary manufacturing level with factories continuing to move towards flexibility and automation to drive quick turns and high quality. These producers continue to turn towards automation as the consumer demands require production in a higher mix and lower volume environment. Much of this automation is coming through the use of industrial robotics and the pressures of the end user are passed through the product manufacturer to the robotics manufacturers. A drive for increased reliability to meet consumer needs in the end product factories necessitates improved quality management and utilization of quality resources within the robotics
production factory.
1.1 Industrial Robots History and Market
Concepts for robots have a long history, but the capabilities began taking shape during the Industrial Revolution. Then, in 1961, the first industrial robot, Unimate, was introduced at General Motors. Distinguishing robots, specifically industrial robots, from other developments in automation and factory equipment became necessary and today industrial robots must be automated, programmable, and capable of movement on three or more axes (2). Although the use of robots expands outside of industrial and manufacturing applications and recent trends have begun considering Robots as a Service (RaaS), industrial robots are still at the core of the robotics industry. The robot bodies of industrial robots generally consists of two major
components, the manipulator, or arm of the robot, and the controller, which houses the hardware and software to manage the robot actions.
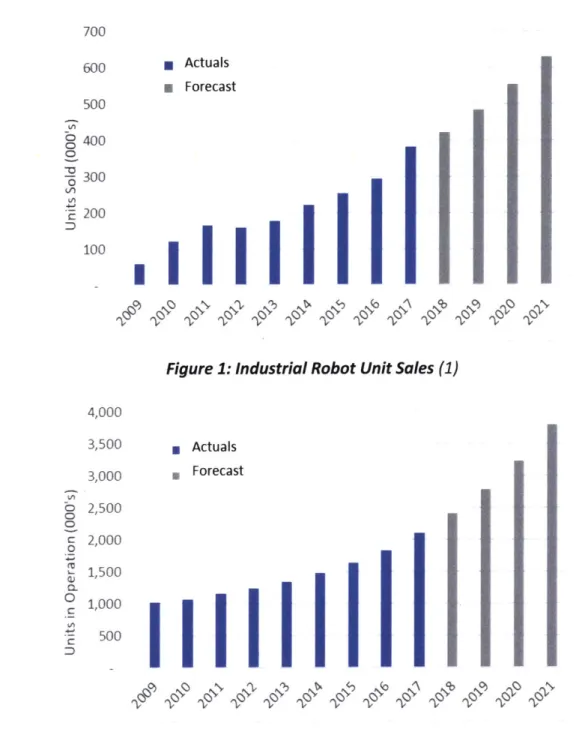
had the fifth consecutive year with the highest level sales volumes which were up 30% from
2016 all while surpassing 2 million robots in operation (3). These past trends and forecasted
growth can be seen in Figure 1 and Figure 2.
700 600 * Actuals 5 Forecast 500 oc: 400 0 -6 300 E 200 100
Figure 1: Industrial Robot Unit Sales (1)
4,000 3,500 * Actuals 3,000 * Forecast 2,500 c 2,000 0 1,500 0 1,000 - 500 'C5' Cj ', 'V5 C5
Figure 2: Industrial Robots in Operation (1)
The current industry position and the continued growth drives a need for robot manufactures to either find ways to expand operations, or to better utilize current resources to allow the
supply of robots to continue to grow rapidly to meet the customer demand all while ensuring increased focus on product quality and reliability.
1.2 Problem Statement
Manufacturing of robotic equipment lies at the intersection of multiple industries. The general process for manufacturing a robot is similar to that of other industrial equipment, with
suppliers and fabrication divisions providing parts to a final assembly line. Through out this process there are multiple stages of tests run and from the raw materials suppliers through to final assembly. Each of these tests is non-value added to the customer and employs significant company resources to complete. As the robotics manufacturing industry is evolving it must establish a strong baseline and set of information to measure the success of change from and to allow the continued improvement and elimination of wastes in the system. This will allow for faster throughput and improved quality to meet the demands of the direct and secondary customers. Upstream solutions developing failure and utilization measurement systems for the robot manufacturing industry will allow higher quality and stronger growth of downstream factory automation to support continued development towards Industry 4.0.
Robotics manufacturing is a part of the more general manufacturing and factory operations study which is where most of the research can be found. One such study on computer
manufacturing considers both the cost of the systems test and field maintenance (4). Another set of studies develops a systems engineering approach for consumer goods. These studies outline a ten-step process as follows:
1. Define clearly the project scope, problem to be analyzed and identify the team;
2. Develop a complete process mapping and identify the quality control points relevant to the problem identified;
3. Identification of all elements along the production line of a product and collection of all
6. Use the most adequate quality improvement tools to further refine the critical quality
characteristics and areas previously identified;
7. Improve the manufacturing process according to the results; 8. Perform cost of quality analysis to enable an informed choice;
9. Evaluate again the relations of elements, deleting the elements that were eliminated
and update the DSM;
10. Standardize the results and refine the model over time (5).
Although this research does not directly use this ten-step process, parallels can be drawn between these studies, or similar studies, and the research for this thesis. There is limited research on the production and testing of robotics equipment and appropriate analysis of this subject to allow for understanding of current performance and development of experiment and measurement methods for rapid changes necessary in the current market environment. This paper develops methods for initializing models within the robotics industry that would be comparable to steps one through four in the list above. Most robotics research has been focused on the use of robots in manufacturing instead of the necessity to establish strong quality and efficient methods within robotics manufacturing to allow the development of the robotics industry as well as the downstream industries supported by the products.
In considering test effectivity, a study on the use of Built-In-Test (BIT) outlines areas robotics manufacturing could move towards after continuing to develop the work from this research. This BIT allows iteration and learning through the expansion of a failure analysis to applicability, ambiguity, and percentage contribution (6). Although this research is broader than robotics manufacturing, the results of focused robotics research would be able to utilize a modified version of this methodology, but the results of the research in this paper and extensions of it would be necessary before moving to employing these methods.
1.3 Thesis Outline
This thesis will provide a background information on quality and reliability as well as the robotics production line. This will provide the reader with a basis of understanding before discussing the specific types of waste in the production line. The failures of robots in systems
test and test cell use will then be analyzed in detail using a modified failure modes and effects analysis and a utilization analysis. This all culminates in test improvement and consolidations that can be made based on test effectivity of finding failures. For test cell utilization, additional analysis and study can be completed utilizing a bin type optimization approach and finding the correct planning interval to maximize the use of each of the test cells and explore the potential for removing some cells.
2 Background
2.1 Development of Modern Quality and Reliability
Although quality was not a new concept the analysis and management of current quality systems began in 1924 with Dr. Walter A. Shewhart and the introduction of control charts. While working at Bell Telephone Laboratories, Dr. Shewhart created this tool to allow
interpretation of the difference between the expected random process variation and the true deviation from the process. In Figure 3 it can be observed that the third data point is outside of the control limits, the odds of which happening due to randomness is less than 1 in 20 (7).
Upper Control Limit
0
0 0
95% Random
Variation
Lower Control Limit
Figure 3: Process Control Chart
These charts were adopted at Bell, but these, along with the statistical methods to support them gained a significant following during World War 11. The military inspected and tested each
product ordered from suppliers for conformance upon receipt. To better meet the
requirements, they moved from use of empirical methods to statistically driven methods and adopted Dr. Shewhart's requirements, publishing them in the military standard (MIL-STD-105)
(7). This resulted in pushing these measures out to direct suppliers, who in turn, passed the
requirements on to sub-tier suppliers. Although the requirements were only for military products, the desire for commonality and the proof shown through use in military products resulted in the adoption of these methods for civilian products as well and thus began mass adoption of statistical process controls in the United States.
After the war, in 1950, a close associate of Dr. Shewhart and an advocate of his work, Dr. W. Edwards Deming gave lectures in Japan at the request of Mr. Ken-ichi Koyanagi, managing director of the Japanese Union of Scientist and Engineers. These lectures accelerated the Japanese focus on quality management. Although Kiichiro Toyoda had already been developing
manufacturing processes around Just In Time (JIT) and Kaizen principles, combining these with Dr. Shewhart's statistical process controls and Dr. Deming's management practices created the basis for the Toyota Production System and the Lean production systems that are in use in factories today (7).
While quality has a longer history, it was not until the 1950s that reliability began to get more focus. It started with the development of the Advisory Group on the Reliability of Electronic
Equipment (AGREE) which was established between the United States Department of Defense and the American Electronics Industry. Similar to the development of quality in the United States, the military brought attention to reliability with the publication of a standard for
reliability testing (MIL-STD-781) in the 1960s. This standard brought forward the difference between testing for quality where the focus is on defects and reliability with a focus on continued field performance. Early trends which are still present today, utilized component reliability as a method for identifying expected system performance, but later developments continued to move towards considerations of the system reliability (8).
2.2 Cost of Quality
Cost of Quality (CoQ) analysis arises from the intersection of two different costs required to manage quality; the cost of maintaining or improving quality, and the cost of defects from lack of quality. There is a supplemental study of the Cost of Poor Quality (CoPQ) as termed by H. James Harrington, an IBM quality expert in the 1980s. This significance of this approach is to emphasize the importance of prevention and the added benefits it provides outside of cost savings due to fewer failures (9). For this research these two terms can be seen as
supplemental and a focus on CoQ will provide sufficient background.
Outside of the complementing CoQ and CoPQ there are five generic cost of quality models that have been developed each focused on categorizing costs differently. Table 1 summarizes these models.
Table 1: Cost of Quality Models (10)
Model Name Cost Categories P-A-F models Prevention + Appraisal + Failure Crosby's model Conformance + Non-Conformance
Opportunity cost models Prevention + Appraisal + Failure + Opportunity + Tangibles + Intangibles
P-A-F (failure costs includes opportunity cost) Process cost models Conformance + Non-conformance
ABC models Value-added + Non-value-added
Although the models are developed independently, for this research, the intersection of multiple models is used when analyzing the data to allow for expansion into any of the model areas for future work. As this research does not evaluate the costs incurred, the data
developed here could be carried forward using any of the cost categories in Table 1.
In considering the two different contributors to CoQ the first is the cost of conformance and the second the cost of non-conformance. For conformance activities there are costs associated with prevention and those associated with appraisal, while non-conformance costs include both
internal and external failure costs (11). Within each of these categories there are tangible and intangible costs associated. Table 2 provides some examples of activities captured in each of these cost of quality categories.
Table 2: Cost of Quality Categories
Cost of Conformance Cost of Non-Conformance
Prevention Appraisal Internal Failure External Failure Examples: Examples: Examples: Examples:
- Requirements - Testing - Repair/rework costs - Field repair costs
- Training - Quality checks - Production - Warranty
- Establishing tracking - Supplier validation interruptions - Reputation with
system - Inspection - Scrap customer
- Quality planning - Reporting - Machine/operator - Customer production
- Statistical Process idle time interruptions
Control
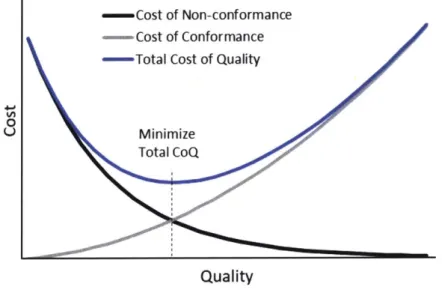
Assigning a value to all contributory element of CoQ then allows a direct comparison of cost versus quality for both categories. This results in an intersecting point that allows for the optimization of CoQ planning to provide target setting for defect decrease and quality improvement as can be seen in Figure 4.
-Cost of Non-conformance
- Cost of Conformance
- Total Cost of Quality
0
U Minimize
Total CoQ
Quality
Figure 4: Cost of Quality Impacts
As quality increases, the cost of non-conformance decreases due to both fewer defects and a lower severity in the results of those defects. Conversely, as quality increases, the cost of conformance increases as each additional quality measure you enact will be of higher cost for a small increment of improved quality. Finding the target point for balancing cost of
conformance with cost of non-conformance is dependent on the tolerance for defects for that process. For example, in a surgical room, the willingness to accept the higher costs of an additional increment of quality when the defect is loss of life will be much higher than the willing ness to accept those same costs in a low-cost fastener manufacturing facility where the defect may be loss of a batch of fasteners.
Evaluating Cost of Non-conformances
While costs of conformance, including testing, may include indirect costs that can be difficult to evaluate, most of these costs are internal to the manufacturer. Cost of non-conformance adds the challenge of much of the cost being captured in external activities from the base of the supply chain through customer delivery and in the case of robotics to the end user of the customer's product. While it may be easy to capture the cost of labor and materials for an internal repair, the challenge of a field failure, with impacts to the end user creates a layering effect on ability to use and reputation which feeds backwards from the end user, to the manufacturer and back to the robotics production line and supply chain. Evaluating the devaluation of the product manufacturer reputation based on
negative end user feedback due to a failure of a robot and then the subsequent devaluation of the robot manufacturer is an exercise involving not just lost orders and warranty claims, but emotions and human responses.
Also, unlike conformance, which is focused on planning and is therefore expected, the defect causing a non-conformance either internal or external is unplanned and disruptive. Evaluating the level of this disruption, even in the case of internal failures, becomes challenging in a complex manufacturing environment. It is unlikely that at the time of the defect, that was the only discrepancy in the manufacturing process which can make assigning fault challenging when it comes to identifying disruptions tied to a single failure. While a defective robot may have occupied a test cell longer than planned, there may have been another robot in another cell that had to rerun a test and a expedite order that was being processed through the plant at the same time all of which would have contributed to a test bottleneck causing a wave of factory disruption up the production line. Isolating the cost of the individual defect including the impacts to prior manufacturing processes may not be possible.
2.3 Design of Experiments to Introduce Change
To drive CoQ down, continuous improvements must be pursued which results in ongoing changes in the factory. Measuring the impacts of these changes requires a disciplined approach. The approach used in this research is Design of Experiments (DOE). This process accounts for two different types of variables, controllable and uncontrollable. The latter is may also not be fully uncontrollable but only difficult to control, but in either case, these variables can be controlled within a specific environment as developed for the experiment. The object of the experiment may have one of 4 goals:
1) determine which variables are most influential
2) determine where to set the influential control variables to regularly meet a target
3) determine where to set the influential control variables to minimize variability
4) determine where to set the influential control variables so the effects of the uncontrolled variables are small (12).
To design a successful experiment there are three stages: characterization, control, and optimization. The first focuses on identifying variables and their contributions to variability in outputs. This is a critical stage of the process as misaligned variables will lead to false results and significant time using educated guesswork to derive variable impacts. The second stage ensures the process is repeatable and within control limits that are reasonable. If variables are changed within a system that is not in control, meaningful changes in system responses cannot be tracked, this ties back to Dr. Shewhart's process control and managing variability within a system. Finally, with optimization, the ideal variable setting is determined to produce the desired response. It is very common and most probable that there will be multiple variables that must be adjusted and set to optimize a part of the manufacturing system. It is also
probable that optimizing individual processes within a system will result in sub-optimization of the complete system (13).
With an immature process, it is important to being with simpler experiments. This process is iterative and as additional change is introduced the variables are monitored, experimented on again, and a more robust process is developed. As the process matures, the ability to address
more complex experiments is increased.
2.4 Robotics Production Line and Systems Test Overview
In considering a full robotics system there are multiple components including the robot, teach pendent unit, end effectors, safety cages, connectivity between robots, and services. Robotics system test is designed to identify quality defects that could lead to early failures resulting in
components from their production lines. There is also an intermediary step for the controller line wherein the controller is tested independently for failures of both the hardware and the software components. The generalized flow to a robotics system test environment can be seen
in Figure 5.
Controller
Production Line - Controller Test (Software &
Hardware)
Systems Test
Manipulator Production Line
Figure 5: Production Flow to Systems Test
There are in-line tests performed for both the manipulator and the controller, these tests are not part of the systems test production environment.
An additional challenge with this production system is introduced as there are multiple production lines for the same product, located in different countries. Despite standardized practices, the systems are influenced by the individuals onsite running them which creates inconsistencies across the lines and challenges in communication between lines. This only further highlights the benefit of being able to decrease complexity and number of tests or components tested for each robot family.
A previous study considered the connection between failures in the controller test and
connections to shop defects and field failures. The results of this study concluded that controller test results were not highly correlated to the other failures (14). For this research, additional considerations were not made for the controller test and it was treated as part of the controller production line, not a contributor to the systems test results.
Within the systems test environment component interactions are tested using multiple subtests. Subtests are identified by measurements being taken or components being tested and may be run individually on each axis of the robot or simultaneously depending on the goals of the test. Criteria for passing a test can be both directly measured and subjective based on the operator's determination. One unique operation that can be included in systems test is calibration. This process allows for the final tuning of the robot to ensure accuracy and for the purpose of this research is considered outside of the scope as this is not testing for quality defects in the robot. A general process flow for within the production systems test
environment is in Figure 6. Calibration is included here as it can be enmeshed with the process and it is necessary to continue to track that activity as it may contribute to the overall process
flow.
Manipulator
and controller Robot Safety checks moved to system/test performed systems test cell set up
cell
Sub-tests Load Sub-tests performed +- attached to performed with load robot without load
Robot Robot Calibration
removed system/test process from test cell cell set up for completed and
calibration
transported
Figure 6: Robotics Production Systems Test Process Flow
performance and a set of base data to develop measurements against to ensure process control.
2.4.1 Stress Testing for Undetectable Defects
This research is focused on systems test in the production environment, however, there are additional tests associated with research and development that contribute to the set-up and design of a production system test environment. Burn-in Test (BiT), Highly Accelerated Life Tests (HALT), and Highly Accelerated Stress Screening (HASS) tests are preformed outside of the production test environment. While the goal of production systems test is to identify failures in the material or manufacturing process through detection of a defect after the product but
before customer delivery, BiT/HALT/HASS processes are designed to identify defects
undetectable by systems test and change design or processes to eliminate these defects and improve customer reliability while decreasing costs (15).
These early stress tests also help with determining the limits for systems test as can be seen in Figure 7. As defect detectability decreases, the cumulative number of units with the defect increases. In comparing the two images in Figure 7, without BiT/HALT/HASS testing, the investment in systems testing may be made for capabilities to detect defects at the level in the first graph, which would result in significant defects flowing through to customer delivery. If
instead, the stress tests are used to find the step function result, investments could be made in systems test to catch these defects internally before passing them to the customer if it is not possible to remove these defects through design or process improvements. In determining these tradeoffs, cost considerations must be made be made for the cost of the incremental
improvement in systems test defect detection and the cost of defects passed to the customer, thereby decreasing the reliability of the products.
E
8
High Detectability E 'U Test Limit Defects Visible to Customers LowSystems Test Limit
Defects Visible to Customers
Low High
Detectability
Figure 7: Systems Test Limit Impact on Customer Defects
2.4.2 Errors In System Testing
During a system test, there are two different types of errors that can occur, either false positives or false negatives. In statistics false positives are known and type 1 errors or alpha errors and false negatives are type 2 errors or beta errors. A false positive occurs when a subtest is determined to have failed, but there is no defect in the robot. Conversely a false negative occurs when there is a defect in the robot, but no system subtest is failed. The matrix of potential results is summarized in Figure 8.
Test Result
Test Passes Test Fails
4-~J
4-UC
a> False Negative True Positive
Type 2/Beta Error Desired Result
4-LJ)
4--J
0
0 True Negative False Positive
Z Desired Result Type 1/Alpha Error
Figure 8: Confusion Matrix for Error Type Identification
When considering the cost of quality, the allowable percentage of each error type will impact the trade off for the cost of conformance and non-conformance. Products with a low tolerance for defect and as a result a high cost of conformance, will have fewer false negative results, or fewer defects passed through the system, but this can create higher false positive results, and
higher costs with more waste for dispositioning units that test as false positive.
When considering the effectivity of a systems sub-test, both error types must be considered. The measure of a test for catching the errors it should, or not producing false negatives that are passed on to the customer connects customer reliability to quality capabilities and metrics. However, if the methods to accomplish low false negative errors, result in high false positive errors, the test may be considered partially effective, but it is inefficient or sub-optimized for
balancing error detection and should not be considered an effective test for utilizing systems test resources.
2.5 Background Summary
A focus on quality and reliability has been developed over the last century. The cost of quality
continues to impact manufacturing with costs to both improve quality and the costs of lack of quality for addressing failures. Identifying ways to remove or decrease these costs using analytical methods such as Design of Experiments to determine the variables necessary to change in a systems test environment allows for methodical determination of test effectivity. Considering the detectability and types of errors to detect allows for measurement of defects and a method for creating a basis of systems test analysis in a robotics production environment.
3 Primary Focus Area Analysis
3.1 Robotic Model Variations and Selection
With the auto industry and electronics being the largest customers for robotics, the models of robots vary significantly based on customer needs. Industrial robots can serve purposes varying from spot welding to part delivery. In considering data across these robots a range of variations
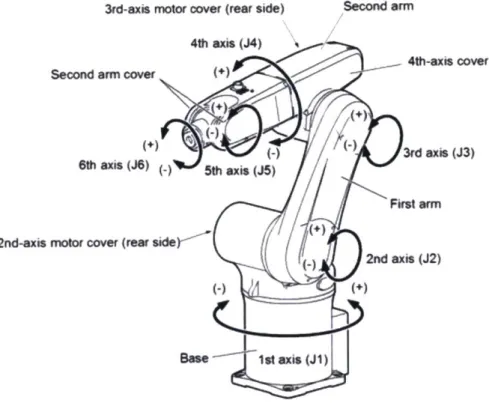
is desirable to check data consistencies as well as identify results unique to specific robot families. To ensure commonality but complexity, this research is focused on six-axis fixed industrial robots with payload ranges of 5-300 kg. Fixed robots have a base that attaches to either a manufacturing floor, wall, or ceiling and prevents the robot from being mobile outside of the range of its reach with each of the six axes allowing rotation for positioning of the robot as can be seen in Figure 9.
3rd-axis motor cover (rear side) Second arm 4th wxis (J4) 4th-axis cover Seon rmcve +)N (-) 3rd axis (J3) 6th axis (J-) 5th axis (J5) First arm 2nd-axis motor cover (rear side<"
0. 2nd axis (J2)
Bse 1st axis (JA)
Figure 9: Six Axis Robot Diagram (17)
This research also eliminated any special use or function specific robots from the analysis. The requirements for these units can be unique and drive different performance expectations and test processes.
3.2 Identifying Wastes
Lean manufacturing has a consistent focus on waste or muda. These wastes are non-value-added activities indicating the process step either does not change the fit form or function of the product to transform it, is rework and as a result was not completed correctly the first time, or the customer would be unwilling to pay for the activity. The only aspect of systems test that transforms the product is calibration, isolating this from the remainder of the testing process deems all the subtests waste considering only the first requirement. Additionally, systems test is designed to catch defects, which classifies this as rework and if the product were
manufactured correctly the first time, in-line, systems test would not be necessary.
Acknowledging that test is waste, it is then important to begin evaluating within that waste, where it is possible to identify items that can be eliminated thereby distinguishing between necessary and unnecessary wasteful activities.
3.2.1 Waste Type Analysis
The eight wastes of lean manufacturing lend themselves to a categorical analysis of any system. In considering a general manufacturing system with a final test requirement, items including transportation and set-up are processes within the test requirement that can be identified as waste considering the test as necessary. Expanding this to then consider the unique position of robotics build with two distinct feed lines an analysis can be completed for each of the eight waste types as summarized in Table 3.
Table 3: Areas of Waste Identification
Waste Area Identification in Systems Test
Waiting -Fully equipped test cell availability -Response time for defect assistance -Coupling of controller and manipulator Over-Production -False positive test results
Rework -Repairing/replacing failed components
-Retesting components Motion
3.2.1.1 Waiting
Both robotics system test and a general test program share in the first two areas of the waiting part of waste identification; test cell availability and response time for defect assistance. Test cell availability accounts not just for the available space but includes equipment and personnel availability as well. Lack of availability of any of these individual components results in a queue developing and as a result, full systems waiting to be tested. Similarly, when a defect is found if the resources to correct that defect, including different space, different tools, and different
personnel than the testing resources account for, are unavailable another waiting waste is created. Robotics systems test, similar to other test following complex manufacturing lines, includes the additional challenge of ensuring multiple components are available at the same time for a single test, this results in components of the system waiting for the others to be completed before being able to start a test, even if the cell and resources are available.
3.2.1.2 Overproduction
For systems test, the results of the test can be distinguished as what is being produced within this process. With this mindset an error in the process which results in a test failing when the components are acceptable is categorized as overproduction. This overproduction results in additional tests being run or unnecessary repairs being investigated both of which are waste.
3.2.1.3 Rework
Rework in systems test includes the physical rework of a failed component, but also any retesting. This retesting is classified as overproduction when a false positive is discovered, but if test instead results in a true positive and the component is repaired, it must also be retested. This retest results in rework and as a result waste within the systems test process.
3.2.1.4 Processing
Data entry may be manual or automated and both result in processing time, however, manual data entry, even considering keystroke time versus computer processer time is much slower and results in higher errors which can tie back to overproduction wastes for retests. Combining manual and automated data capture also creates a risk of mis-categorization of data due to timing of data entry. An example observed in robotic systems test is an incorrect test being
manually marked as failed as the system had automatically advanced the test when the previous test needed to be marked failed manually due to operator observations. 3.2.1.5 Transportation
Transportation between the build line and the test line when the two are not integrated and from the test cell to the next process is the minimal needed, however, it does not add value to the test itself and is therefore waste. Considering a robotics systems test line, additional transportation waste comes from transporting components to storage until the full system is ready, transportation for repair and back to test cells or storage, and transportation between cells for specialized testing. Another important part of the transport waste is setup and teardown associated with each transport need due to the challenges of affixing a robot and load appropriately for each entry and exit to the test cell.
3.2.2 First Pass Yield Necessary Waste Identification
While test, and in this case systems test, is waste, without appropriate first pass yields (FPY), this waste is necessary. FPY measures robots passing test versus total robots tested.
number of robots passing test total number of robots tested
The target of a high FPY is to decrease the field failure rate (FFR).
number of robot failures at the customer
FFR = -(2)
total number of robots in service
The basic field failure rate equation, however, does not consider two important aspects for the manufacturer. First, all robots have an expected lifetime, however, some robots outside this expected lifetime may still be in service. For these products the next failure can be expected to remove the product from the pool. If these products are included in the total manufacturer considered failure rate, they unfairly weigh the number of robots in service as the end of life event would not be considered a field failure due to lack of repair, but the robot would be
Theoretically, all remaining robots should be tracked for field failure rates, however an
important aspect of manufacturer field failure tracking is warranty period. Within the warranty period it can be expected that a customer will return to the manufacturer to request service on a field failure, outside of this period they may choose other service providers or repair options that do not provide the manufacturer visibility.
number of robot failures at the customer
Fwarr total number of robots in service within warranty period
Due to variability in customer reporting, it can generally be assumed that Eq. (3) and (4) will have similar results. However, there is a risk of customers with high failure rates outside of the warranty period being more likely to report issues thereby skewing the number of failures to the total number of robots in service within their expected lifetime and increasing FFRAdj. For this reason when considering the relationship between first pass yield and field failure rates the
most representative comparisons come from Eq. (1) and (4). It can reasonably be expected that with consistent operations an increase in FPY will result in a decrease in FFRwarr as an increase in FPY signals improved defect elimination during the build cycle. Consistent operations are necessary as a false increase in FPY due to missed factory defects would only create a pass through of the defect to the field thereby increasing FFRwarr. From this we can then conclude that for test as a necessary waste identifying subtests, subcomponents of test, and components of the build that contribute to FPY calculations are the only items that hold customer value are thereby the necessary components of waste. An example breakout of this can be observed in Figure 10.
Component 1 (FPY 100% -Subtest 1 unnecessary waste) (FPY 97%
-necessary waste) Component 2
(FPY 97% - necessary waste)
Systems Test Subtest 2 Component 3 (FPY 95% - necessary In (FPY 100%ci (FPY 100%
-waste) unnecessary waste) unnecessary waste)
Component 1 (FPY 92% - necessary Subtest 3 waste) (FPY 93% - necessary waste) cn Component 4 (FPY 94% -necessary waste)
Figure 10: Identification of Necessary Wastes
Considering subtest 1 and subtest 3, both tests are determined necessary as the FPY indicates detection of a failure. However, component 1 within both tests demonstrates the need to consider both the subtest level and component level of failure for analysis. For subtest 1, this component shows no failures and if the portion of this subtest applicable to component 1 can be removed, that could improve test efficiency, but we cannot conclude that component 1 has no necessary waste against it as it contributes to subtest 3's FPY rates. This indicates that both the subtest and component must be considered separately as each is individually necessary to ensure full understanding when analyzing the wastes.
For illustration purposes the chart indicates FPY of 100% is required to determine the subtest or component unnecessary, however, there could also be a FYP threshold set to allow failures up to a certain FPY. For example, if a test or component had a FPY of 99.9% this may be sufficient to say the test is non-value-added and eliminate the test. These thresholds may vary by
consistent pattern, this may also warrant continuing to run the test as catching the timeframes and components with the consistently low FPY may be value added.
3.3 Wastes Summary
Robotic models can impact the frequency of types of wastes identified, however there is a need to identify failures for each robot family by both component and test type. All test may be considered waste as if quality could be guaranteed, test would not be necessary. However, as defects should not be passed on to customers, and measurement of FPY and contributes to FFR, test becomes a necessary waste. Within test, there should be identification of waste types to remove any unnecessary waste based on test and component failure measurements.
4 Test Failure Analysis
4.1 Method
In considering the DOE methods and process, the focus for this research was on
characterization and measurement of the variables. This was accomplished by considering the initial stages of a modified a Define, Measure, Analyze, Improve, and Control (DMAIC) process and then utilize a Failure Modes and Effects Analysis (FMEA) process to complete the initial stages within the DMAIC model.
4.1.1 Define, Measure, Analyze, Improve, and Control Model for Design of Experiments
A modified DMAIC model that accounts for the DOE process can be seen in Figure 11.
Define Measure Pre-Analyze
Analyze Experiment:
Control Improve
Figure 11: Define, Measure, Analyze, Improve and Control Modelfor Design of Experiments
The applicability of this model and the use of it in DOE focuses on dividing the standard third step of the DMAIC process into three individual steps, pre-analyze, experiment, and analyze. Each of these steps could be considered in a standard DMAIC process as part of the analyze process, but due to the nature of intelligently designing the experiment around past data as is necessary to capture in DOE ensuring definition of each individual step allows for a more robust process. This also highlights the looping of a DOE process by allowing moving to improvement
the process within a process allowing for the deductive nature of the experiments to then drive the inductive process between controlling and defining the process (16).
Understanding of the DMAIC process for DOE was key to this research as the focus is on the first three steps in this modified process. Breaking out the pre-analysis stage the highlight the importance of this prior to beginning experimentation and indicating the iterative nature creates the basis for a continuous improvement process that allows building of methods from this research.
4.1.2 Failure Modes and Effects Analysis
To analyze the data and understand the basis for designing an experiment, a FMEA model was utilized. Standard FMEA models consider the process step, ways to fail, impacts of those failures, causes of the failures and methods of avoidance and detection. However, the key to the analysis is considering the occurrence, severity and detectability of the failure the product of which is the FMEA score for that failure. For systems test in a robotics manufacturing environment, the analysis relied heavily on the three key considerations of the FMEA analysis especially highlighting occurrence and severity while modifying the general identification categories. Initial data collected was from the categories outlined in Table 4.
Table 4: Robot Test Data Collected
Serial No Test ID Sub-test Component Location Description Cause or
Failed Failed Action
123456 789 Test 1 Component Test Cell X Rattling Loose Bolt
-A Tightened
by
mechanic
Although the categories do not completely align, in comparison to the standard FMEA analysis, the sub-test failed data is the process step, the component failed is the way of failure, the description is similar to the impact of failure and the cause of failure is addressed by the cause or action. Line item data was collected for each of the failures cleaning data as collected to ensure accuracy and consistency.
Categorizing failure impacts in FMEA requires development of occurrence, severity, and
detectability metrics to measure failures against. As each line item in the analysis is a single failure of both a sub-systems test and a component, occurrence count can be derived by
categorizing each common sub-system and component failure and subtotaling those categories. Severity, unlike occurrence, contains more subjectivity in both developing the measurements and assigning the level to each failure. The weight of severity can greatly impact the final FMEA score so ensuring an appropriate number of categories as well as the spread and weighting is critical. Table 5 compares two different scenarios of severity ratings. The first shows heavy weighting towards high severity and because of this, the event that happened only once received the higher FMEA score and as a result this failure would be ranked higher priority in the FMEA analysis. Conversely the second scenario does not have significant variability in the severity scoring and as a result, the failure with the higher occurrence receives the higher overall score and would be the higher priority. In this example detectability is held constant across the scenarios to allow for direct comparison.
Table 5: Severity
Severity Ratings
Occurrence Severity
Ratings Comparison
S1 20 50
Detectability Total FMEA Score
15 1 1 15
1 50 1 50
Severity Ratings 1 2 3
Occurrence Severity Detectability Total FMEA Score
15 1 1 15
1 3 1 3
Table 6: Severity Ratings for Robot Production Systems Test
Severity Rating Guidelines
0 No repair needed, test reran immediately
10 Minor repair needed, downtime minimal
50 Moderate repair needed, robot requires service in cell, downtime moderate
100 Major repair needed, robot requires move or service in cell, downtime significant
These measurements of severity are ratings or scores and are not rankings as there are multiple dimensions that must be considered when applying the ratings. For example, only a minor repair could be needed, but the repair could require mechanic service in the cell as it cannot be
performed by the test operator due to requirements. This failure could be rated either ten or
fifty and downtime may be the determining factor. A similar failure may occur that requires
significantly less or more downtime which could result in a different rating. This does not indicate one failure ranks above the other, only that the severity and impact of the failure receives a higher score.
Detectability in robot production systems test measures the relationship between the quality defects caught in test and the defects passed on to the customer that should have been caught during systems test. There are defects and reliability issues that are passed onto the customer that currently do not have a test to catch them in production systems test, and these defects would not contribute to detectability ratings. Previous work was completed on comparing connections between tests at supplier and in production and the ability of those tests to predict field failure rates in robotics. Unfortunately, the correlation between failure rates in the factory and rates in the field was found to be weak (14). Due to this weak connection, continuing to
pursue direct connections between specific failure types was forgone for this research and instead detectability was considered equal across all failures, bringing as stronger focus to the occurrence and severity ratings.
Utilizing occurrence and severity with the equal detection rate allowed categorization of each failure type using this modified FMEA analysis. The snapshot of these results as defined by a
Table 7: Failure Modes and Effects Analysis Combined Results
Sub-test Component Occurrence Severity FMEA Score
Failed Failed Test 1 Component A 20 0 0 Test 1 Component A 9 10 90 Test 1 Component A 10 50 500 Test 1 Component A 1 100 100 Test 1 Component B 3 0 0 Test 1 Component B 8 10 80 Test 1 Component B 1 50 50 Test 1 Component B 0 100 0
Breaking down the information, component A had 40 failures during test, but half of these failures had low severity and result in a score of 0. While the high severity may draw significant
attention, for both components, the high severity failures do not have the highest FMEA score, indicating the high severity failures are not where the focus of analysis should be.
4.2 Failure Types
Utilizing and extending the results of the FMEA analysis and considering the discussion in section 3.2.2 the failures must be broken into failure by test and failure by component. The analysis must capture total failures across all component and test types individually to ensure comprehensive understanding of the drivers of the failures.
4.2.1 By Test Analysis
In considering test type failures, occurrence as extracted from the FMEA analysis combined with general stoppage analysis for items outside full failure and compared against number of test runs. To isolate true failures and fixes on the first time a test is run is considered. If a test
is run and fails multiple times this does not measure the effectivity of the test, but instead the effectivity of the fix, so repeated test data is omitted from the analysis in order to not
overweight tests that are simply indicating poor approaches to rework processes. Table 8 summarizes the results by test type.
Table 8: Percentage Failure of Test Based on First Run Test Percentage Failed Test 1 0.37% Test 2A 0.14% Test 2B 0.08% Test 2C 0.08% Test 2D 0.08% Test 2E 0.03% Test 2F 0.05% Test 3 0.86% Test 4A 0.11% Test 4B 0.05% Test 4C 0.06% Test Percentage Failed Test 4D 0.08% Test 4E 0.03% Test 4F 0.05% Test 5A 0.27% Test 5B 0.08% Test 5C 0.02% Test 5D 0.09% Test 5E 0.07% Test 5F 0.08% Test 6 24.87% Test 7 3.32% Test Percentage Failed Test 8 1.74% Test 4.1A 25.65% Test 4.1B 0.24% Test 4.1C 0.04% Test 4.1D 0.07% Test 4.1E 0.11% Test 4.1F 0.08% Test 9 4.62% Test 10 0.89%
Tests are presented in the order they are run. Tests are also divided into individual subtests on components, and families of test with the number indicate the family and the letter the specific subtest. There are two closely related tests that have some subtle differences that account for test family 4 which is indicated by family 4 and 4.1.
In selecting the areas to pursue design of experiments activities there are three areas to consider.
4.2.1.1 Test Failure by Sequence
Within all test families, the largest failure rate is always in the first subtest run. From this we can conclude that either this component, component A has a higher failure rate than other components, or the initial test in each family is also able to capture transitory effects from other subtests in that same family that are then not necessary to retest in the remaining family tests. Section 4.2.2 will outline the analysis of component test, however, the results of this analysis proved the first hypothesis false as the subcomponents of A do not present with higher overall failure rates. As a result, it can be concluded that the first test in the family of tests includes activities that are capturing failures that need to be isolated and these activities then
4.2.1.2 Test Failure Across Similar Test Families
Family 4 is unique in that is has two sub-families. The first of these sub-families has the lowest first in sequence test failure of any family at 0.11% and the overall lowest average of failure
percentage across the family of tests at 0.06%. Conversely the second of these tests has the highest first in sequence test failure at 25.65% and the third highest average of failure
percentage across the family of tests at 4.36%, although this is the highest of any family of tests with multiple sub-component tests. These opposing results and the commonality of these tests lead to the possibility of collapsing the first test into the second based on additional
experiments that would isolate the failures found in the first tests and allow determination of ability to catch those failures with the second test.
4.2.1.3 High Test Failure
The tests that demonstrate the highest failure rates are higher than actual FPY measures which indicates these are also capturing alpha failures or false positives. These false positives add to the waste as inspection or potentially unnecessary rework to disposition them. Although the lower numbers do not preclude the other tests from also containing alpha-type errors, the large percentages indicate necessity to prioritize these tests for experiments to identify the type of false positive errors being indicated and balance those triggers within the test for with ones that are capturing the true positives. Due to this balancing, the looping and iterative nature of DOE is key to finding the correct tuning of the false and true positives.
4.2.2 By Component Analysis
Component type failures are not dependent on the type of test run to determine the
component failure. Instead these failures are summarized by the component that has failed or the family of components that has failed. The components identified within the test failures are further broken down in component analysis and the component A in test failures may contain multiple components within this detailed analysis. Some of these components may
allow for comparison of the same component in different robot families. There are also captures of false positive information which indicate there was a test failure, but there was no error with the robot. These false positives can be due to signal errors or operator errors.
Robot Family 1 100 LA 90 80 70 uL 60 4-o b 50 (u 40 -030 20 z 10 Robot F amily 2 70 ~~ 60 ~~20 01 30 E 20C z 10 9O'qoe S9 0- p 0- e 0~' 0'- 90<(C 0o 0o Oc cp ~ ~ 90 c9 9p 9p0 Q pc p Robot Family 3 30 z 20 0 0 z 0
This occurrence data was pulled from the FMEA analysis and captures only those items with ten or more occurrences cuts off the long tail of low occurrence items that will not contribute to the trend analysis and they are washed out by the more impactful, large occurrence items. The lower occurrence items were also checked for the total FMEA scores and none of these had high enough severity scores to warrant inclusion as a high contributor to overall failure. Components more accurately account for severity of failure as the severity is dependent on fixing of the component and doesn't have as direct relation to the test in which the component was found. Severity was split into two categories, low impact for ratings 0 and 10 and high impact for ratings 50 and 100. Although this dilutes the severity rating it allows consideration of the items that are contributing the most to the weight in the factory and helps remove some subjectivity left to the operators and technical experts when selecting severity.
In considering components that both have a high severity and ten or more occurrences, and comparing information across models, one part family clearly becomes the most significant contributor to the failure ratings of all robot families. The extended results accounting for severity are summarized in Figure 13.
Robot Family 1 90 80 *Component Family c m60 450 0 40 -o30 20 10 0 N 4) b' A l0 sf 11b & : kN N 4 0' 0' ' z 0, c" ' 0' 0' 0' I, 300 Robot Family 2 4* Component Family x 30 (9 U-'b 20 E 10 30
Figue 1: Hih Sveriy RbotComponent iue RtFamily ~
20
A-P - ; e-e
(9P
The importance of severity in component analysis can be seen in comparing Figure 12 and Figure 13. First, the false positives are dropped as these tend to have lower severity or simple requirements to rerun the test. These have been captured and should be analyzed on a by test
basis, but as this is an error in the test and not in the components, this data is not useful for this analysis. Also, components such as component 24 in the first robot family are no longer
present as there are not enough of these failures with high severity to make them a priority for analysis. This allows focus on the components that are creating the most waste to begin designing experiments that will produce the fastest results by addressing systemic issues. Individually, components 1 and 2 are in the top three for number of failures when considering high severity issues across all robot families. The presence of this high failure and severity for multiple components in this family points to root issues with the component and integration into the overall product. No other component family had more than two components in this high severity, high occurrence analysis with component family a having six separate
components appear in the failure analysis. Although each of the components within this family is related to different tests, looking at commonality across these tests allows identification of areas for initial variable change that is either the same across multiple tests or has specific changes between tests that can allow measure of change with variable change.
4.3 Failure Analysis Summary
Utilizing modified DMAIC and FMEA methods it is possible to break down systems test in a robotics environment. Identifying both the failures of components and tests allows for comparison across robot families to identify high occurrence items. In doing this it is also became apparent there was a family of components that consistently failed and should be the focus for potential upstream or inline testing.
5 The Waiting Wastes
Waste within the actual test is only a portion of the waste that occurs for systems production test. Matching the controller, manipulator, and test cell as well as utilizing those cells to appropriate levels adds to the waste through waiting.
5.1 Manipulator, Controller, and Test Cell Matching
The manipulator and controller are built on two separate lines with the controller also undergoing test before reaching the systems test stage. This requires the syncing of two production lines and development of an internal scheduling plan that does not create
significant waiting between arrival of manipulator and controller. Measuring the wait time of each of these components allows development of experiments around adjustment in
production scheduling and planning to shorten waiting times. Figure 14 outlines the
differences in manipulator and controller arrival times, or delta times, for one robot family and highlights those that arrived within the expected window. It can be observed that there is a significant tail to the histogram indicating much variability. Experimenting on ways to decrease this variability and allow more consistent arrivals would decrease waiting waste.
25
S Within Target Arrival
20
0 .6 0 15