Publisher’s version / Version de l'éditeur:
Sensors 2010, IEEE, pp. 1500-1503, 2010-11-04
READ THESE TERMS AND CONDITIONS CAREFULLY BEFORE USING THIS WEBSITE. https://nrc-publications.canada.ca/eng/copyright
Vous avez des questions? Nous pouvons vous aider. Pour communiquer directement avec un auteur, consultez la
première page de la revue dans laquelle son article a été publié afin de trouver ses coordonnées. Si vous n’arrivez pas à les repérer, communiquez avec nous à [email protected].
Questions? Contact the NRC Publications Archive team at
[email protected]. If you wish to email the authors directly, please see the first page of the publication for their contact information.
NRC Publications Archive
Archives des publications du CNRC
This publication could be one of several versions: author’s original, accepted manuscript or the publisher’s version. / La version de cette publication peut être l’une des suivantes : la version prépublication de l’auteur, la version acceptée du manuscrit ou la version de l’éditeur.
For the publisher’s version, please access the DOI link below./ Pour consulter la version de l’éditeur, utilisez le lien DOI ci-dessous.
https://doi.org/10.1109/ICSENS.2010.5690349
Access and use of this website and the material on it are subject to the Terms and Conditions set forth at
SnO2/NiO Composite Thin Films for Formaldehyde Detection
Dunford, J. L.; Tunney, J. J.; Du, Xiaomei
https://publications-cnrc.canada.ca/fra/droits
L’accès à ce site Web et l’utilisation de son contenu sont assujettis aux conditions présentées dans le site LISEZ CES CONDITIONS ATTENTIVEMENT AVANT D’UTILISER CE SITE WEB.
NRC Publications Record / Notice d'Archives des publications de CNRC:
https://nrc-publications.canada.ca/eng/view/object/?id=e43d2ba5-6c5b-4e43-a3bd-55864fcd9f4b https://publications-cnrc.canada.ca/fra/voir/objet/?id=e43d2ba5-6c5b-4e43-a3bd-55864fcd9f4b
SnO
2
/NiO Composite Thin Films for Formaldehyde
Detection
Jeffrey L. Dunford, Jim J. Tunney, and Xiaomei Du
Institute of Chemical Process and Environmental Technology National Research Council Canada
Ottawa, Ontario, Canada, K1A 0R6
Email:{Jeffrey.Dunford, Jim.Tunney, Xaiomei.Du}@nrc-cnrc.gc.ca
Abstract— Formaldehyde (HCHO) is a volatile organic com-pound that outgasses from textiles and composite wood products, with adverse health effects resulting from prolonged exposure to concentrations of ∼ 10 ppb in air. Commercially available HCHO sensors struggle to detect HCHO at such low concen-trations. Tin dioxide (SnO2) / nickel oxide (NiO) polycrystalline
composite films have shown sensitivity to ∼ 100 ppb via resistance measurements. Here we explore several thin SnO2/NiO films
produced by pulsed laser deposition (PLD), varying preparation parameters including NiO loading and substrate temperature during deposition. These variables are shown to affect both composition and morphology, as characterized by XPS, XRD, SEM, and SEM-EDX. Here we report the response time and sensitivity of these sensor materials to HCHO concentrations from ∼ 10 ppb to 1000 ppb at various operating temperatures.
I. INTRODUCTION
Many types of commercial HCHO sensors are available, but few can quantitatively detect HCHO at concentrations below 100 ppb [1]. A recent Health Canada guideline [2] sets the maximum HCHO concentration for short-term (1-hour aver-aged) and long-term (8-hour averaver-aged) exposure limits at100 ppb and40 ppb, respectively. The World Health Organization [3] sets a short-term (30-minute averaged) exposure limit at80 ppb. There are few affordable sensors that can detect HCHO at these guideline concentrations. There is recent concern regarding HCHO in commercial buildings, driving a desire to improve HCHO sensor technology to meet these exposure levels in an affordable, portable package.
Thin metal-oxide films provide a low-cost class of gas-sensitive materials that can be integrated into a portable elec-tronic gas sensor. HCHO sensors based on nickel oxide (NiO) [4], [5], tin dioxide (SnO2) [6], [7], and SnO2/NiO composite
films [8] have effectively detected HCHO concentrations from ∼ 100 ppb to 1 ppm. We are developing a SnO2/NiO thin film
sensor material to detect HCHO at concentrations∼ 10 ppb, and which can be integrated into a wireless device. Thus, we strive to maximize sensitivity at a modest power consumption. There have been numerous methods employed in the devel-opment of SnO2/NiO composite films, yet the use of pulsed
laser deposition (PLD) has received relatively little attention despite several inherent advantages that are offered by this technique. These advantages include a number of deposition parameters and the ease with which PLD allows for a con-trolled transfer of the target composition to a thin film [9]. We
have chosen PLD as a thin film preparation technique primarily because it offers a number of independent parameters to tune several film characteristics. These include target composition, substrate temperature, background gas (e.g. O2pressure), and
deposition time (see Fig. 1).
Here we use PLD to produce a range of SnO2/NiO films
with various NiO loadings and a range of substrate temper-atures during deposition. These two parameters affected film composition and morphology, respectively. We then measured a response in electrical resistance of a film upon exposure to HCHO. The most promising candidates for sensing HCHO were prepared with a NiO loading of 20% at a substrate temperature∼ 250◦C during deposition. They exhibited a high
sensitivity to∼ 10 ppb with a short response time at operating temperatures achievable with portable electronics.
II. EXPERIMENTAL
PLD is illustrated in Fig. 1. All films were deposited via PLD on alumina (Al2O3) using 600 mJ/pulse laser energy
at an 8 Hz pulse rate for 20 minutes. Energy fluence at the target was approximately 1.5 J/cm2
. Oxygen (O2) pressure
during deposition was set at values of25 mTorr to 400 mTorr for various films, with thickness ranging from 45 nm to 150 nm as determined by profilometry. Substrate temperature was held constant during deposition at temperatures from 150◦C
to 650◦C. After deposition, all films were annealed for 30
minutes at their deposition temperatures in an O2atmosphere
(400 Torr).
NiO loading (e.g. fraction of NiO in the composite) was controlled by composition of PLD targets, which were pre-pared by pressing a pellet of uniformly mixed, finely ground powders of pure NiO and SnO2. Relative NiO loadings of
1%, 2%, 5%, 10%, and 20% were tested. Film compositions were confirmed by X-ray photoelectron spectroscopy (XPS) and energy dispersive X-ray spectroscopy (SEM-EDX), and were found to be similar to that of their targets.
Figure 2 shows field emission scanning electron microscopy (FE-SEM) images, illustrating the morphology of a typical SnO2/NiO sensor film with a NiO loading of 20% and a
thickness of ∼ 50 nm. These PLD films were highly gran-ular and porous. X-ray diffraction (XRD; not shown) only confirmed the cassiterite structure of the SnO2 phase. NiO
Pulsed Laser (λ = 248)
Laser optics Chamber window
Laser striking target surface Laser striking target surface creatingcreating a plume
a plume of material for film depositionof material for film deposition
(a) (a) (b) Variable Parameters: Target Composition Substrate Temperature Chamber Gas Pressure Chamber Gas Composition Laser Energy, Pulse Rate
(c)
Fig. 1. Pulsed laser deposition. (a) A photograph of a laser ablation plume; (b) an SnO2/NiO film deposited on an alumina substrate with pre-fabricated interdigitated electrodes; (c) a schematic illustrating PLD of a composite metal-oxide film.
observed by both XPS and SEM-EDX. For example, XPS and SEM-EDX confirmed that films prepared from a PLD target comprised of20% NiO had NiO loadings of 20% ± 2%.
Electrical resistance of composite films was measured in a 1 L flow-through chamber at a flow rate of 500 mL/min while controlling film temperature and gas composition. Trace HCHO in nitrogen (N2) was supplied from cylinders
pur-chased from Scott Specialty Gases. Mass flow controllers (MFCs) regulated gas flow from an ultra-high purity N2
cylin-der, an ultra-high purity O2 cylinder, and a trace HCHO/N2
cylinder to achieve the desired HCHO concentration while maintaining a constant flow rate of500 mL/min and constant O2concentration of20%. At a given temperature, the relative
conductance response is defined as (1/R([HCHO])) − (1/Rair)
1/Rair =
Rair
R([HCHO])− 1, (1) where R([HCHO]) is the stabilized film resistance after ex-posure to a known concentration of HCHO, [HCHO], and Rair is the film resistance in simulated dry air (i.e. 20% O2; balance N2). Response time refers to an average time
required for a film’s resistance to stabilize after changing the HCHO concentration(generally to or from simulated dry air) at
Fig. 2. Film morphology. Field emission scanning electron microscope (FE-SEM) image of a typical SnO2/NiO film prepared on single-crystal sapphire (e.g. crystalline Al2O3) at250◦C and400 mTorr O2, having a thickness ∼ 50 nm.
a given temperature. The relative response and response times of SnO2/NiO films were determined at various concentrations
of HCHO in simulated dry air. HCHO concentrations in this study ranged from12 ppb to 1 ppm, and sensor film operating temperature ranged from25◦C to550◦C.
III. RESULTS ANDDISCUSSION
When heated in simulated dry air from 25◦C to 550◦C,
SnO2/NiO films generally exhibited temperature dependence
typical of semiconductors; e.g.Rair(T ) ∝ exp(−aT ), where T is the film temperature and a is a constant. At a fixed operating temperature, HCHO concentration was cycled be-tween zero (e.g. simulated dry air) and test values at regular intervals. Films with high NiO loadings generally showed larger conductance responses than those with lower NiO loadings. After preliminary measurements on films prepared with NiO loadings from1% to 20%, we focused our attention on those comprised of20% NiO.
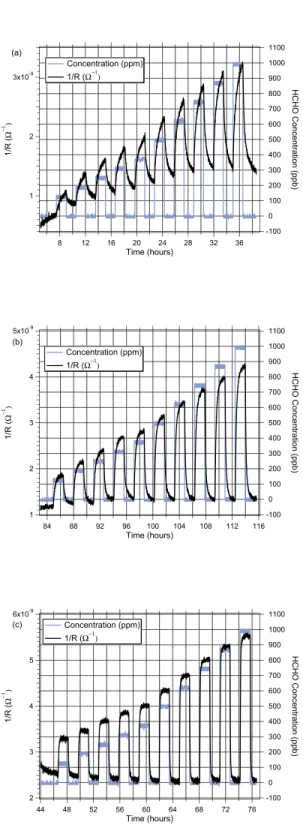
The time required for resistance to stabilize after exposure to a given concentration of HCHO was inversely proportional to the film temperature during sensing. Figure 3 demonstrates a film’s resistance responding to changes in HCHO concen-tration at 90 minute intervals. This film was deposited at a substrate temperature of650◦C. At a film operating
tempera-ture of300◦C or350◦C, its resistance was not stable within 90
minutes of a change in HCHO concentration (e.g. conductance was still drifting upward after90 minutes exposure to HCHO; still drifting downward after90 minutes exposure to simulated dry air), as shown in Figs. 3(a) and (b). In general, the cycling time required to reach a stable value at temperatures below 400◦C is much greater than1 hour for films prepared
at 650◦C. Conversely, the operating temperature required for
quasi-realtime HCHO sensing for a film prepared at650◦C is
greater than 400◦C.
1100 1000 900 800 700 600 500 400 300 200 100 0 -100 HCHO Concentration (ppb) 36 32 28 24 20 16 12 8 Time (hours) 3x10⁻⁹ 2 1 1/R ( Ω −1 ) Concentration (ppm) 1/R (Ω−1) (a) 1100 1000 900 800 700 600 500 400 300 200 100 0 -100 HCHO Concentration (ppb) 116 112 108 104 100 96 92 88 84 Time (hours) 5x10⁻⁹ 4 3 2 1 1/R ( Ω −1 ) Concentration (ppm) 1/R (Ω−1) (b) 1100 1000 900 800 700 600 500 400 300 200 100 0 -100 HCHO Concentration (ppb) 76 72 68 64 60 56 52 48 44 Time (hours) 6x10⁻⁹ 5 4 3 2 1/R ( Ω −1 ) Concentration (ppm) 1/R (Ω−1) (c)
Fig. 3. Response time. Conductance vs. time for several cycles of various HCHO concentrations for a typical SnO2/NiO film prepared at 650◦C and 400 mTorr O2. HCHO concentration was cycled between test values (90 minutes) and zero (90 minutes) at responding PLD film resistance was measured at film temperatures of (a) 300◦C, (b) 350◦C, and (c) 400◦C.
Figure 4 shows conductance and HCHO concentration vs. time for a SnO2/NiO sensor film prepared at a substrate
temperature of 250◦C and 400 mTorr O2. In Fig. 4, the
HCHO concentration was cycled every30 minutes. This film exhibited an increase in resistance of (a)∼ 83% at a HCHO concentration of100 ppb, and (b) ∼ 23% increase at 12 ppb. Such a large change in resistance was common amongst films deposited and annealed at substrate temperatures below300◦C.
Remarkably, this film’s response time (e.g. that required to reach a stable resistance) at a film temperature of300◦C was
shorter than the gas exchange rate of our1 L chamber. We sus-pect that a more amorphous and/or granular film morphology is responsible for enhanced sensitivity and decreased response times. This is supported by SEM images, which show an evolution of film granularity with PLD substrate temperature. Higher concentration of oxygen deficiencies in the film -especially partially reduced NiO - might also be responsible for improved performance of films deposited and annealed at lower substrate temperature; however, we have little supporting evidence for this explanation.
Figure 5 shows difference in film resistance (compared to resistance in simulated dry air) vs. HCHO concentration at 300◦C, derived from the data shown in Fig. 4. From
such a curve, film resistance can be calibrated for a given operating temperature for implementation as a sensor device, having a one-to-one relationship between resistance changes and HCHO concentrations.1
Films deposited at substrate temperatures below250◦C were
also studied. In particular, 3 films were deposited at150◦C that
were otherwise prepared exactly the same way as 3 films de-posited at250◦C. These 6 films were all deposited on sintered
alumina substrates with built-in hot-plates and interdigitated electrodes,2 as shown in Fig. 1(b)). The relative response (e.g. percentage change in conductance) and response times of the 150◦C films were similar to their 250◦ counterparts, but
their resistances (e.g. R([HCHO]) and Rair) were an order of magnitude higher at a common operating temperature of 300◦C.
We also studied films deposited at O2 pressures from 25
mTorr to400 mTorr. Film thickness varied slightly with depo-sition pressure. However, there was no significant difference in relative conductance response when these films were exposed to HCHO concentrations from ∼ 10 ppb to 1 ppm.
IV. CONCLUSION
We have shown that HCHO can be detected in simulated dry air at concentrations as low as 12 ppb using SnO2/NiO
films prepared by PLD. In general, a NiO loading of 20% showed a higher HCHO response than lower loadings, and films deposited at a substrate temperature ∼ 250◦C showed
1From the signal-to-noise ratio in Fig. 4 and calibration curve in Fig. 5, it appears that the HCHO detection limit of these PLD films may be well below 12 ppb. Unfortunately our current gas delivery system is unable to reliably source HCHO concentrations below12 ppb.
2These alumina substrates with built-in hot-plates, platinum temperature sensors, and interdigitated electrodes, were purchased from the Electronics Design Center at Case Western Reserve University.
120 110 100 90 80 70 60 50 40 30 20 10 0 -10 -20 HCHO Concentration (ppb) 38 36 34 32 30 28 26 24 22 20 18 16 14 12 10 8 6 4 Time (hours) 1.20x10⁻⁶ 1.15 1.10 1.05 1.00 0.95 0.90 0.85 0.80 0.75 0.70 0.65 0.60 0.55 0.50 1/R ( Ω −1 ) 1/R (Ω−1)) HCHO concentration 40 36 32 28 24 20 16 12 8 4 0 -4 -8 HCHO Concentration (ppb) 38 37 36 35 34 33 32 31 30 29 28 27 Time (hours) 880x10-9 860 840 820 800 780 760 740 720 700 680 660 640 1/R ( Ω −1 ) 1/R (1/Ω-1) HCHO concentration
Fig. 4. High sensitivity, short response time, and low operating temperature. Conductance vs. time for several cycles of various HCHO concentrations for a SnO2/NiO film prepared at250◦C and400 mTorr O2. Concentration was cycled between a fixed concentration (30 minutes) and zero (30 minutes) in an atmosphere of 20% O2 (balance N2) at a flow of 500 mL/min. An expansion of the lowest concentrations is shown in a lower panel.
higher response and shorter response time at a lower sensor operating temperature than those deposited at higher substrate temperatures. These materials are promising for affordable low-power realtime applications. Ongoing research involves studying these SnO2/NiO films in more complicated gas
environments,3 possibly followed by further optimization of
PLD parameters, is required before these composite SnO2/NiO
thin films can be integrated into sensor devices. ACKNOWLEDGMENT
The authors thank Gerardo Diaz-Quijada for useful discus-sions, Craig Jeffrey for early contributions to this project, 3For example, it is suspected that these films might show cross-sensitivity to water vapour, CO2, alcohols, and other volatile organic compounds.
-600x103 -500 -400 -300 -200 -100 0 R ( Ω) 100 90 80 70 60 50 40 30 20 10 0 HCHO Concentration (ppb)
RHCHO – Rair (Ω); HCHO concentration increasing
RHCHO – Rair (Ω); HCHO concentration decreasing
Fig. 5. Sensor calibration curve. Change in resistance, ∆R = R([HCHO]) − Rair vs. HCHO concentration at 300◦C for a SnO2/NiO film deposited at250◦C and400 mTorr O2.
David Kingston for XPS and SEM-EDX measurements, Michael Post for advice on gas delivery systems, and Duncan Stewart for ideas and direction.
REFERENCES
[1] J. Flueckiger, F. K. Ko and K. C. Cheung, “Microfabricated formaldehyde gas sensors,” Sensors, vol. 9, pages 9196-9215, 2009.
[2] N. Gilbert (Health Canada), Proposed residential indoor air quality guidelines for formaldehyde. Ottawa, Canada: Minister of Health, 2005 (ISBN 0-662-41195-1).
[3] World Health Organization (WHO). WHO regional publications, Euro-pean series, No. 91: Air quality guidelines for Europe, 2nd ed. Copen-hagen, Denmark: WHO Regional Office for Europe, 2000 (ISBN 92-890-1358-3).
[4] Y. Lee, P.-R. Hsieh, H. Lin, P.-C. Chou, L.-M. Fu and C.-M. Chiang, “MEMS-based formaldehyde gas sensor integrated with a micro-hotplate,” Microsyst. Technol., vol. 12, pages 893-898, 2006. [5] Y.-H. Wang, C.-Y. Lee, C.-H. Lin and L.-M. Fu, “Enhanced sensing
characteristics in MEMS-based formaldehyde gas sensors,” Microsyst. Technol., vol. 14, pages 995-1000, 2008.
[6] N. Barsan and U. Weimar, “Conduction model of metal oxide gas sensors,” J. Electroceramics, vol. 7, pages 143-167, 2001.
[7] P. Lv, Z. Tang, G. Wei, J. Yu and Z. Huang, “Recognizing indoor formaldehyde in binary gas mixtures with a micro gas sensor array and a neural network,” Meas. Sci. Technol., vol. 18, pages 2997-3004, 2007. [8] P. Lv, Z. A. Tang, J. Yu, F. T. Zhang, G. F. Wei, Z. Huang and Y. Hu, “Study on a micro-gas sensor with SnO2-NiO sensitive film for indoor formaldehyde detection,” Sensors and Actuators B, vol. 132, pages 74-80, 2008.
[9] T. Venkatesan, in “Pulsed laser deposition of thin films”, D.B. Chrisey, G.K. Hubler, Eds. New York: Wiley, pages 313-325, 1994.

![Fig. 5. Sensor calibration curve. Change in resistance, ∆ R = R ([HCHO]) − R](https://thumb-eu.123doks.com/thumbv2/123doknet/14140007.470250/5.918.517.824.144.362/fig-sensor-calibration-curve-change-resistance-r-hcho.webp)
