HAL Id: hal-00316954
https://hal.archives-ouvertes.fr/hal-00316954
Submitted on 1 Jan 2001
HAL is a multi-disciplinary open access
archive for the deposit and dissemination of
sci-entific research documents, whether they are
pub-lished or not. The documents may come from
teaching and research institutions in France or
abroad, or from public or private research centers.
L’archive ouverte pluridisciplinaire HAL, est
destinée au dépôt et à la diffusion de documents
scientifiques de niveau recherche, publiés ou non,
émanant des établissements d’enseignement et de
recherche français ou étrangers, des laboratoires
publics ou privés.
observations at magnetically conjugate sites
J. Moen, J. A. Holtet, A. Pedersen, B. Lybekk, K. Svenes, K. Oksavik, W. F.
Denig, E. Lucek, F. Søraas, M. André
To cite this version:
J. Moen, J. A. Holtet, A. Pedersen, B. Lybekk, K. Svenes, et al.. Cluster boundary layer measurements
and optical observations at magnetically conjugate sites. Annales Geophysicae, European Geosciences
Union, 2001, 19 (10/12), pp.1655-1668. �hal-00316954�
Geophysicae
Cluster boundary layer measurements and optical observations at
magnetically conjugate sites
J. Moen1,2, J. A. Holtet1, A. Pedersen1, B. Lybekk1, K. Svenes3, K. Oksavik4, W. F. Denig5, E. Lucek6, F. Søraas4, and M. Andr´e7
1Department of Physics, University of Oslo, P. O. Box 1048 Blindern, N-0316 Oslo, Norway 2Also at Arctic Geophysics, University Courses on Svalbard, N-9170 Longyearbyen, Norway
3Norwegian Defence Research Establishment, Division for Electronics, P. O. Box 25, N-2007 Kjeller, Norway 4Department of Physics, University of Bergen, N-5007 Bergen, Norway
5Air Force Research Laboratory, Space Vehicles Directorate, Hanscom AFB, MA 01731–3010, USA 6Space and Atmospheric Physics Group, Blackett Laboratory, Imperial College, London, SW7 2BW, UK 7Swedish Institute of Space Physics, Uppsala Division P. O. Box 537, SE-751 21 Uppsala, Sweden
Received: 21 March 2001 – Revised: 15 June 2001 – Accepted: 19 June 2001
Abstract. The Cluster spacecraft experienced several bound-ary layer encounters when flying outbound from the mag-netosphere to the magnetosheath in the dusk sector on 14 January 2001. The dayside boundary layer was populated by magnetosheath electrons, but not with quite as high densi-ties as in the magnetosheath itself. The Cluster ground track was calculated using the Tsyganenko-96 model which ap-pears to be a strong tool for combining high-altitude satel-lite and ground observations, given that the solar wind con-ditions are known. This paper focuses on identifying auro-ral responses corresponding to boundary layer dynamics ob-served by Cluster. The first boundary layer encounter stud-ied was a brief visit into a closed LLBL, most likely due to a boundary wave that travelled tailward over the spacecraft. A corresponding equatorward and eastward movement was seen in the post-noon aurora between Greenland and Sval-bard. The second boundary encounter was in a high-latitude cusp, and occurred as a consequence of a transient reconfig-uration of the cusp. The cusp expanded duskward over the spacecraft into the late post-noon sector. NOAA-12 probed the 16:30 MLT sector of this auroral activity, and measured a 1.4 keV electron beam located poleward of the 30 keV electron-trapping boundary. A sequence of three moving au-roral forms emanating from this active region are likely can-didates for flux transfer events. The auroral signatures are discussed in relation to earlier observations, and appear to be an example of accelerated electrons/discrete post-noon au-rora on open magnetic field lines.
Key words. Ionosphere (particle precipitation) Magneto-spheric physics (auroral phenomena; magnetopause, cusp
Correspondence to: J. Moen ([email protected])
and boundary layers)
1 Introduction
Data from low-altitude polar orbiting satellites, combined with optical observations from the ground, have been used intensively for more than a decade as an indirect approach for determining magnetospheric boundary layer sources of auroral phenomena. Newell and Meng (1988, 1992) subdi-vided the “soft zone” dayside precipitation region, located poleward of the central plasma sheet (CPS), into four differ-ent regions: the dayside extension of the boundary plasma sheet (BPS), the low-latitude boundary layer (LLBL), cusp proper, and mantle. They established an automated identifi-cation scheme to discriminate among the four precipitation regions. Newell and Meng (1992) presented a probability map for observing the various boundary layers, where the cusp proper spans ∼ 3 hours centred on local noon (∼ 10:30– 13:30 MLT). In the ionosphere, the LLBL borders on the equatorward side of the cusp near noon, but extends further pre- and post-noon than the cusp (∼ 09:00–15:00 MLT). The plasma mantle borders on the poleward side of the cusp and the LLBL. The BPS borders on the dawn and dusk end of the LLBL. The key distinction between the LLBL and the cusp is the presence of energetic magnetospheric particles in the LLBL. The BPS is characterised by more spatially and spectrally structured electron precipitation than the CPS. The BPS also contains a dense component of accelerated magnetosheath-like ions.
Sandholt et al. (1998) subdivided dayside auroral activi-ties into seven types, and tentatively associated them with the statistical precipitation map described above. Type 1
occurs in the midday sector (09:00–15:00 MLT) for south-ward IMF, and is dominated by the 630.0 nm emission. It in-cludes rayed bands and quasi-periodic sequences of poleward moving auroral forms (PMAFs). Type 1 aurora comprise of open LLBL, cusp, and mantle (Sandholt et al., 1993; Moen et al., 1998), and the moving auroral forms are believed to be footprints of flux transfer events (FTEs). Type 2 is dom-inated by the 630.0 nm emission, but is located at much higher latitudes than type 1. Type 2 is stimulated by mag-netosheath electrons injected by lobe reconnection for north-ward IMF (Øieroset et al., 1997). Type 3 is a diffuse glow of 557.7 nm, and is located equatorward of type 1 with an emis-sion gap in between. It is attributed to pitch-angle scattered energetic electrons from the CPS (Lorentzen et al., 1996; Moen et al., 1998). Types 4 and 6 are discrete forms in the pre-noon sector (06:00–09:00 MLT) for IMF BZ north and
south, respectively. They are strong in both the 557.7 and 630.0 nm, and attributed to a BPS origin on sunward convec-tion (Ober et al., 2000; Farrugia et al., 2000; Lorentzen and Moen, 2000). Types 5 (IMF BZnorth) and 7 (IMF BZnorth)
are discrete forms in the dusk sector (15:00–18:00 MLT) con-taining strong red and green line emissions, also attributed to BPS on a sunward flow. It must be noted that the division of DMSP precipitation signatures into BPS, LLBL, cusp and mantle regions are based strictly on quantitative criteria and as such, are just names referring to the classification scheme invented by Newell and Meng (1988). However, it does not seem likely that what is identified as BPS in the ionosphere always maps to the boundary of the plasma sheet in the mag-netosphere. Model simulations have shown that open LLBL, cusp, and mantle are at different stages of the evolution of a newly-reconnected flux convecting away from the merg-ing site. It is now accepted that the LLBL may be entirely on open field lines (Lockwood and Moen, 1996; Moen et al., 1996; Lockwood et al., 1998). “BPS precipitation”, dif-ferentiated from low-altitude LLBL signatures by spatially structured field-aligned acceleration and discrete arcs, is be-lieved to map to the boundary of the plasma sheet and hence, is located on closed field lines. However, the energy-disper-sed ion signature, interpreted as a reconnection signature, sometimes begins in the “BPS” (Lockwood et al., 1998). Mi-lan et al. (2000) presented UVI images and HF radar obser-vations suggesting that PMAFs can be seven hours of MLT in length and extend as far as 19:00 MLT. Hence, the “BPS” class of auroral precipitation may not always have a physical relationship to the “boundary of the plasma sheet”, which is per definition closed.
In this paper, we present two auroral events in the 15:00– 17:00 MLT sector west of Svalbard, which appear magneti-cally conjugate with high-altitude Cluster observations. Con-junction was obtained when Cluster encountered the bound-ary layer plasma in the dusk sector on 14 Janubound-ary 2001. We will demonstrate the use of the Tsyganenko-96 model (Tsy-ganenko, 1995) to identify magnetic conjugacy between the Cluster spacecraft and the auroral ionosphere, noting that conjugacy is sensitive to solar wind conditions and has as-sociated uncertainties. Available Cluster data for this study
are electron particle data from the plasma electron and cur-rent experiment (PEACE), spacecraft potential, electric field measurements from the field and wave experiment (EFW), and magnetic field measurements from the fluxgate magne-tometers (FGM).
2 Instrumentation
Each cluster spacecraft carries an electric field and wave ex-periment (EFW). This exex-periment measures the potential dif-ference between two perpendicular axes of double probes; the spherical probes are mounted at the tips of four radial booms 44 m in length. The electric field probes are electron-ically controlled to be 0.5 to 1.0 V positive, relative to the ambient plasma and can serve as a reference for the space-craft potential which, in turn, can be calibrated to provide information about electron density. More details are given in Gustafsson et al. (2001, this issue). Initial calculations in the solar wind, when compared with measured ion drift speeds, have demonstrated accuracies to a fraction of one mV/m. The electric field experiment provides information about the electric field components EX(GSE) and EY(GSE)
in the spin plane.
Each Cluster spacecraft carries two triaxial fluxgate mag-netometers (FGM) to measure the magnetic field, one located at the end of a 5.2 m radial boom of the spacecraft and the other 1.5 m inward from the end of the boom. Either sensor can be designated as the primary sensor. At nominal mode, the primary sensor provides 15.519 magnetic field vectors per second. The data presented in this paper has the spin rate resolution of 4 s (see Balogh et al. (1997) for a detailed description of the Cluster magnetic field investigation).
The PEACE (Plasma Electron and Current Experiment) instrument is a dual sensor system designed to measure the three-dimensional velocity distribution of electrons in the energy range from 0.6 eV to 27 keV, and to detect elec-trons arriving from all pitch-angles. The instrument con-sists of a data processing unit and two sensors. The sen-sors are hemispherical electrostatic energy analysers with position-sensitive micro-channel plate detectors. Each sen-sor is mounted on the spacecraft so as to observe a 180◦ field-of-view in the plane defined by the spacecraft spin axis and the radial direction in the spin plane. The two sensors, LEEA and HEEA (Low and High Energy Electron Analysers), are mounted on opposite sides of the spacecraft so that they have a combined instantaneous field-of-view of 360◦. In normal
operations, the sensors operate at a rate of 32 sweeps in each four-second satellite spin. LEEA covers the range up to about 1000 eV, and HEEA covers the range from about 40 eV to about 27 keV. Technically, either sensor can cover the full energy range, although in certain environments, the differ-ence in geometric factor means that one or the other sensor is preferred to cover particular energy ranges (the reader is re-ferred to Johnstone et al. (1997) for a full description of the instrument).
X
Y
GSE XZ
GSE YZ
Figure 1
Fig. 1. An illustration of the flight path (in red) of Cluster from 12:30 to 14:00 UT in a GSE X − Z and Y − Z plane. Cluster moved radially
outward in the dusk sector for the actual time interval.
Essential information about auroral particle precipitation is provided by the low-altitude, sun-synchronous polar or-biting satellites DMSP-14 and NOAA-12, which both oper-ate at about an 800 km altitude. The DMSP soper-atellites are equipped with separate electron and ion ElectroStatic Analy-sers (ESAs) having fields-of-view along the local zenith. The ESAs measure the energy spectrum once per second of pre-cipitating charged particles within the range from 32 eV to 32 keV. They are also equipped with a thermal plasma drift meter (DM) measuring the horizontal and vertical cross-track velocity components of the ionospheric plasma. The NOAA satellites carry two complements of particle instruments, the Total Energy Detector (TED) and the Medium Energy Pro-ton and Electron Detector (MEPED). TED measures elec-trons and ions between 0.3 and 20 keV, in two viewing di-rections, one toward zenith and the other 30◦to zenith. This instrument has been designed to obtain the energy flux mo-ment, but also provides crude electron and ion energy spectra as well. MEPED consists of solid-state detector telescopes, one pointing toward zenith to view particles that precipitate into the ionosphere, the other at 90◦to zenith to view par-ticles that will magnetically mirror above the atmosphere. The energy ranges for electrons are > 30 keV, > 100 keV,
>300 keV, all with a 1000 keV maximum energy, and for ions 30–80 keV, 80–250 keV, 250–800 keV, 800–2500 keV and > 2500 keV. MEPED provides information on energetic magnetospheric particle fluxes (> 30 keV) and helps locate the electron trapping boundary.
The auroral activity was surveyed by an all-sky im-ager (ASI) located at Ny- ˚Alesund (78.9◦N, 11.9◦E, 76.07◦ CGMLAT). The Tsyganenko-96 magnetic field model (T96) is used to connect the Cluster in situ measurements to the ground-optical observations.
3 Observations
Figure 1 illustrates the location of Cluster above the north-ern hemisphere on 14 January 2001, viewed in a GSE XZ plane in the left panel and in a GSE Y Z plane on the right. The spacecraft 1, like the other three spacecraft (spacecraft 2 to spacecraft 4) were at GSE position (2.72, 8.03, 9.13) RE
at 12:30 UT. The red curve in each panel marks the orbital path travelled from 12:30 to 14:00 UT. Direction of move-ment is indicated by an arrow. The Cluster satellites moved outward from the magnetosphere towards the post-noon day-side magnetopause when collecting the data to be presented. The figure was made using the orbit visualization tool for Cluster (http://ovt.irfu.se) employing the T96 model for the magnetic field.
Figure 2 shows the interplanetary magnetic field observed by ACE in GSM coordinates from 11:00–14:00 UT. BZwas
predominantly positive up to 13:30 UT, except for brief nega-tive excursions at around 11:50 UT, 12:30 UT and 12:40 UT.
BX varied between 0 and −5 nT, and BY from −4 to 4 nT.
ACE measured a solar wind bulk speed of ∼ 380 km/s, cor-responding to an advection time of about one hour between the position of ACE at ∼ 230 RE upstream and the Earth’s
magnetopause. We are going to study two boundary layer encounters starting at 12:51 and 13:30 UT. The dot-dashed vertical lines indicate the corresponding IMF at the begin-ning of these two encounters (BL-E1 and BL-E2), assuming a 60 min signal propagation time between ACE and Cluster. The two full lines mark the time lag of 75 min. Lockwood et al. (2001, this issue) applied a time shift of 75 min for the time interval between ∼ 08:30 and 12:00 UT, and found good correlation between IMF BZand the X component
BL-E2 BL-E1
75min 60 min 75min 60min
Figure 2
Bx nT (GSM)
Bz nT (GSM)
By nT (GSM)
Fig. 2. The components BX, BY, and BZof the interplanetary magnetic field
in GSM coordinates observed by ACE near the L1 point. The full and dot-dashed vertical lines mark the IMF con-ditions for two boundary layer encoun-ters by Cluster assuming a time shift of 75 and 60 min.
Optgenoorth et al. (2001, this issue) report an excellent cor-relation between the IMF clock angle (in the GSE Y − Z plane) observed by ACE and that observed by Cluster in the magnetosheath after about 15:00 UT, when the space-craft had crossed the magnetopause. Their cross-correlation peaked for a time shift of 74 min. Such a firm assessment of the time lag has not been established between 12:00 and 15:00 UT, and we will run the Tsyganenko model with both 60 and 75 min time lags of the IMF.
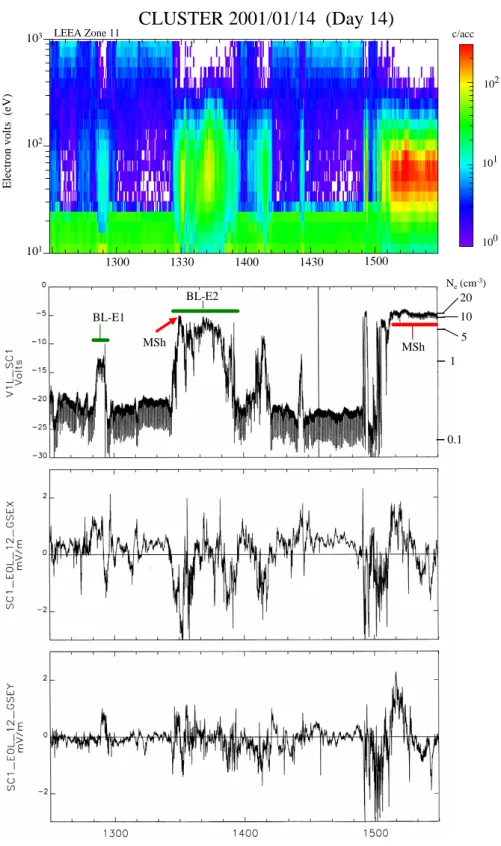
Figure 3 presents observations from the PEACE and EFW experiments on spacecraft 1 from 12:30 to 15:30 UT. The top panel shows a colour-coded electron spectrogram from PEACE, where accumulated counts (for LEEA) are plotted versus energy and time. At first glance, we see that the space-craft alternated between two distinct plasma populations, i.e. high-density low energy electrons (30–200 eV), and low-density energetic electrons that can be glimpsed at the high-est energy ranges. The absence of the low energy electrons at the beginning tells us that the spacecraft initially was inside the magnetopause, where the measurements are dominated
by the energetic (E > 1 keV) particles usually encountered on closed field lines. Between 12:52 and 15:15 UT, it had several encounters with a low energy electron population; the first one lasted ∼ 4 min from 12:52 to 12:56 UT, and the most extensive one lasted ∼ 30 min from 13:27 to 13:57 UT. No-tably, the high-energy component disappears at every excur-sion into the low energy electron regime. At 15:15 UT, the spacecraft had definitely reached the magnetosheath.
The second panel from the top in Fig. 3 shows the negative of the spacecraft potential with an electron density scale on the right side. This way of plotting the spacecraft potential means that increasing electron density is upwards. This pa-rameter has periodic variations between −20 V and −25 V in the tenuous magnetospheric plasma. This periodic varia-tion is caused by the short operavaria-tion of the plasma resonance sounder, Whisper, on Cluster. The upper trace corresponds to the Nescale on the right side of this panel.
By comparing spacecraft potential with PEACE electron data, it is evident that spacecraft potential is a useful param-eter for locating boundary layer crossings between low- and
BL-E1 BL-E2 MSh MSh
CLUSTER 2001/01/14 (Day 14)
c/acc 100 101 102 20 10 5 1 0.1 Ne(cm-3) 1300 1330 1400 1430 1500 LEEA Zone 11 101 102 103Electron volts (eV)
Fig. 3. The top panel shows the
spec-trogram obtained by PEACE at space-craft 1 from 12:30–15:30 UT. The accu-mulated counts in each energy bin (for LEEA) have been plotted as a function of time (colour bar on right side). The second panel from the top represents the negative of the spacecraft potential for spacecraft 1. The spacecraft poten-tial has been calibrated against electron density, and the electron density scale is given on the right. The two bottom pan-els show the GSE X and Y components of the electric field versus time.
high-density plasma populations. After 15:15 UT, when the satellite had entered the magnetosheath, the negative of the plasma potential reaches a quasi-steady level of −5 V. The two boundary layer excursions that will be linked to auroral activity enhancements west of Svalbard are annotated BL-E1 and BL-E2, meaning boundary layer encounter 1 and 2. The density associated with BL-E1 is significantly lower than
that for BL-E2, and the corresponding spacecraft potential is around −14 V and −7 V, respectively. The electric field com-ponents EX(GSE) and EY(GSE) are given in the lower two
panels of Fig. 3. The electric field GSE EX and EY
com-ponents are directly measured on Cluster. The XY -plane is identical to the spacecraft spin plane. When the magnetic field has a direction larger than approximately 10◦with the
Figure 4
Time (UT)
Cluster 1 FGM data 2001/01/14
Fig. 4. Cluster magnetic field
measure-ments versus time. The six panels from top to bottom show: the elevation angle θ (positive northwards), the longitude angle 8 (zero along the X-axis towards the Sun, and positive duskwards), the GSE components BX, BY, BZand the
total magnetic field. The two vertical dot-dashed lines mark the first bound-ary layer encounter (BL-E1), and the two vertical full lines mark the second boundary layer encounter (BL-E2).
spin plane, it is possible to calculate EZ from the
assump-tion that Ek > E⊥and E · B ∼= 0, which will be seen in
Sect. 4.2. Figure 4 shows the corresponding magnetic field observations for the interval of 12:30–15:30 UT. Plotted in the panels from top to bottom are: the elevation angle θ (an-gle made by the magnetic field vector with the X − Y -plane, positive northwards), the longitude angle 8 (zero along the
X-axis towards the Sun and positive duskwards), the GSE components BX, BY, BZ, and the total magnetic field. The
pair of vertical dashed lines and the pair of vertical full lines mark the duration that the boundary layer encounters, BL-E1 and BL-E2, respectively. It is notable from Fig. 4 that the ambient magnetic field of Cluster is dominated by a negative
BY component up to about 13:15, i.e. a duskward directed
field. BZ experienced a positive deflection associated with
BL-E1, while BY stayed around −20 nT and BXwas nearly
zero. The fluctuation level is apparently much higher dur-ing BL-E2 than durdur-ing BL-E1. The irregular pulsations are observed during BL-E2 and after 14:55 UT, when the
space-craft definitely traversed the magnetopause and entered the magnetosheath.
Figure 5 presents a sequence of 630.0 nm all-sky images from ∼ 12:44 to 12:56 UT. The raw images have been cut at a 75◦ zenith angle and projected onto a map, assuming an altitude of 250 km for the 630.0 nm emission. The acquisi-tion time is given at the top of each frame. The first im-age was taken at 12:44 UT when DMSP-14 (ground-track is given by the red line) intersected structured auroral activity near the east coast of Greenland. The rest of the sequence covers the time interval when Cluster encountered BL-E1. The Cluster ground-track was calculated by the T96 model which required IMF BX, BY and BZ, the solar wind
dy-namic pressure, and the magnetic Dst index as input. For all the mappings in this paper, we used constant values for the solar wind pressure and the Dst index. For the solar wind pressure, we used 0.5 nPa, which is an average value for the actual time interval. The hourly average of the Dst was −2 nT. For IMF, we have experimented with 60 and
DMSP F14 75 min
60 min
Figure 5
BL-E1
Fig. 5. A sequence of digital all-sky images of the 630.0 nm emission taken at Ny- ˚Alesund displayed on a geographical frame of reference. The auroral emission is mapped to an Earth-centred sphere at 250 km. Time is given at the top of each frame. The colour scale is linear with increasing intensity from blue to red. The red straight line intersecting the auroral activity near the east coast of Greenland in the 12:44:10 UT image marks the trajectory of a DMSP-F14 pass. The red and the yellow curves in the following image represent the nominal ground tracks of Cluster calculated for two different time lags of the IMF observations, 75 and 60 min, respectively.
75 min time lags for the IMF. The yellow curved line super-imposed on the frames from 12:52 UT onwards in Fig. 5 rep-resents a 60 min time lag, i.e. IMF values: BX = −4.2 nT,
BY = −2.0 nT, BZ =0 nT. The red curve north of the
yel-low one in the 12:52 UT frame demonstrates a 75 min time lag and IMF values: BX= −4.6 nT, BY =0 nT, BZ=2 nT.
Cluster’s position along the ground-track is marked with a white square at 20 min intervals in the top middle frame from 10:20 UT until it went out of the field-of-view over Green-land around 13:20 UT. In the subsequent frames, the calcu-lated position corresponding to the time the picture was taken has been marked on the yellow curve (60 min time lag). It should be kept in mind that static magnetic field mapping can only give us a proxy of the ionospheric foot track since it does not account for dynamic movements of the magne-topause and the boundary layers. However, in the 11:52 UT image, we see two arc filaments between Greenland and Svalbard, located poleward of the nominal Cluster path (both paths). At ∼ 12:53 UT, a third form brightened near eastern Greenland. This form intruded in the field-of-view in a re-gion equatorward of where the other two subsequently faded, between 12:54:10 and 12:55:30 UT. This third form reached the Cluster footprint between 12:52 and 12:53 UT. The
auro-ral form expanded further eastward, and retreated poleward from 12:55 UT. At 12:56:30 UT, the footprint of Cluster was at the equatorward edge of the auroral transient. Please note that enter and exit times of Cluster into BL-E1 corresponds in time with the auroral form moving over the satellite ground-track.
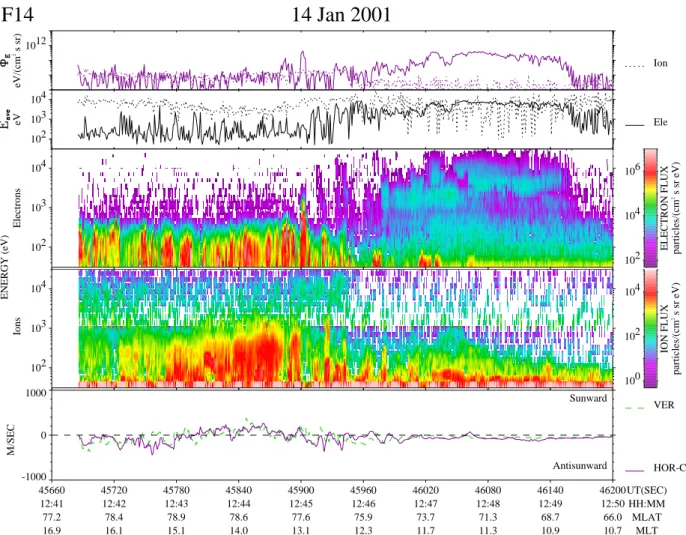
Figure 6 shows electron and ion particle fluxes and plasma flow measured by DMSP-F14 along the track illustrated in the top left frame of Fig. 5. The satellite flew south-west closely adjacent to the discrete 630.0 nm auroral activ-ity from 12:43 UT onwards, and intersected a bright form around 12:44 UT, just before it left the camera’s field-of-view. From 12:43 to 14:44:45 UT, the particle fluxes are dominated by low energy magnetosheath-like electron and ion fluxes, with a modest flux of energetic ions. The verti-cal (green curve) and horizontal (magenta curve) components of the cross-track plasma velocity are plotted in the bottom panel. Please note that the 630.0 nm activity is located on a sunward plasma flow.
Figure 7 shows a sequence of all-sky images demonstrat-ing the auroral activity to be discussed in relation to Cluster’s boundary layer excursion BL-E2 from 13:27–13:57 UT. The yellow ground-track was obtained assuming a 60 min time
102 103 104 102 103 104 1012 102 103 104 Ion Ele -1000 0 1000 Sunward Antisunward VER HOR-C 102 104 106
ELECTRON FLUX particles/(cm
2 s sr eV) 100 102 104 ION FLUX particles/(cm 2 s sr eV)
F14
M/SEC14 Jan 2001
ENERGY (eV) Electrons Ions eV eV/(cm 2 s sr) 45660 12:41 77.2 16.9 45720 12:42 78.4 16.1 45780 12:43 78.9 15.1 45840 12:44 78.6 14.0 45900 12:45 77.6 13.1 45960 12:46 75.9 12.3 46020 12:47 73.7 11.7 46080 12:48 71.3 11.3 46140 12:49 68.7 10.9 46200 12:50 66.0 10.7 UT(SEC) HH:MM MLAT MLTFig. 6. DMSP-F14 observations of particle precipitation and plasma flow along the path indicated by the straight red line in the top left frame
of Fig. 5. The upper two panels display energy flux and average energy for the ion and electron precipitation. The third and the fourth panels show electron and ion fluxes versus energy and time. The bottom panel displays the cross-track plasma flow versus time. The green curve represents the vertical component (positive upward) and the magenta curve represents the horizontal component (positive sunward).
lag for the IMF observations (BX = −3 nT, BY = 4 nT,
BZ = 0 nT) and the red ground-track was obtained for a
75 min time lag (BX= −2.6 nT, BY = −1 nT, BZ =4 nT).
The difference between the two will be discussed in Sect. 4. At the event onset, Cluster had already moved out of the field-of-view over Greenland. We see an initial brighten-ing above eastern Greenland around 13:31 UT. This activity expanded rapidly toward Svalbard. Between 13:41:30 and 13:44:10 UT, an auroral form detached from the main activity region and propagated east towards Heiss Island. NOAA-12 traversed the quasi-persistent auroral arc between 13:48 and 13:49 UT, as illustrated in the two right-hand frames in the bottom row of Fig. 7. The satellite flew along the straight red line from southeast to northwest. Electron particle data sam-pled along this trajectory are presented in Fig. 8. The solid curves in the three upper panels represent precipitating elec-trons at given energies, while the dot-dashed curves in the second and third panels represent fluxes perpendicular to the magnetic field. NOAA-12 crossed northbound through the 30 keV electron-trapping boundary at 13:47:45 UT, indicated
by the vertical line. North of the electron-trapping boundary, there is a belt of structured 0.3–0.46 keV electron precipi-tation. At ∼ 13:48:30 UT, the electron energy flux peaked at 10 mWm−2, which corresponds to the intersection of the bright arc. The characteristic energy associated with this dis-tinct peak in energy flux is 1.4 keV. The eastward-moving form break off from the quasi-persistent background arc, as described above, was followed by two similar ones that tore off the background arc at ∼ 13:51 and ∼ 13:53 UT. Then the auroral activity ceased, and the background arc faded at the time Cluster went out of BL-E2 at 13:57 UT.
4 Discussion
The discussion section is organised as follows. First, we discuss the problems associated with field-aligned mapping. Then we focus on boundary layer sources and dynamics, and the associated auroral response. Finally, we will consider the 15:00–17:00 MLT cusp auroral activity in more detail.
Figure 7
NOAA-12 30 keV trapping boundary 75 min 60 minFig. 7. An all-sky sequence for Cluster event BL-E2 presented in the same format as Fig. 5. The straight red line west of Svalbard in the
Arc crossing
Figure 8
mWm
-2
Fig. 8. NOAA-12 electron particle
ob-servations along the path indicated by the straight red line west of Svalbard in the 13:48:10 and 13:49:10 UT frames in Fig. 4 (bottom row). The upper panel shows the integral of downward moving electrons over the energy range 0.30– 0.46 keV. The second and third panels from the top represent the integral flux over 30–1000 keV and 100–1000 keV for electrons. The solid line is the flux measured along the zenith direc-tion, and the dot-dashed line is the flux perpendicular to the zenith. The two bottom panels give characteristic en-ergy and enen-ergy flux for the electron precipitation.
4.1 Field-aligned mapping and magnetic conjugate mea-surements
Mapping along magnetic field lines from the outer magne-tosphere to the ground is a non-trivial task involving uncer-tainties. Since we do not know the exact time lag of the IMF observations we have used for each case two sets of driving parameters. Figure 8 illustrates a ∼ 80 km southeast shift of the ground trajectory, basically changing BY =1 nT to 4 nT
and BZfrom 4 nT to 0 nT. Ober et al. (2000) demonstrated a
similar displacement for a polar pass over Svalbard. In order
to obtain a quantitative agreement between electron fluxes observed by polar and the resulting auroral emissions in the ionosphere, they shifted the footprint trajectory by adjusting the dynamic pressure input to the model, i.e. they used dy-namic pressure as a free parameter to obtain good correspon-dence between electron precipitation fluxes and auroral ac-tivity. For the two situations presented here, when the aurora is far off zenith of the optical site, a quantitative comparison between variations in auroral intensity and spectral content, with variations in field-aligned electron fluxes and energy, is not feasible.
Despite all the uncertainties involved, the mapping in Fig. 3 ties the boundary layer crossing BL-E1 quite convinc-ingly to the crossing of the discrete post-noon auroral form. It is not possible to judge the accuracy of the mapping in Fig. 4, as the Cluster footprint was west of the all-sky field-of-view. However, the transient eastward expansion of the auroral activity coincided in time with Cluster’s encounter of BL-E2, which indicates a close relationship between the two phenomena.
4.2 Boundary layer crossings and plasma sources
We conclude from Fig. 3 that Cluster was initially in the magnetosphere at 12:30 UT and had definitely crossed the magnetopause by 15:15 UT. In between these two extremes, Cluster had several encounters with a boundary layer pop-ulated by a magnetosheath plasma component, but not with quite as high densities as in the magnetosheath itself. During the first encounter, from 12:52–12:56 UT, the characteristic energy ranged from 50 to 60 eV, which is expected for the magnetosheath electron plasma. The density varied between 3–6 cm−3, which is an order of magnitude higher than in the magnetosphere, but significantly lower than in the magne-tosheath.
The elevation angle of the magnetic field (θ ) is small up to about 13:15 UT, which makes it impossible to calculate E ×
B/B2for the first event. However, the positive E
Xsignature
of ∼ 1 mV/m at the start and about −1 mV/m at the end of BL-E1 can be combined with a corresponding BY of ∼ 20 nT
to yield the Z-component of E × B/B2. At the beginning and the end, (E × B/B2)Zare, respectively, of the order of
−50 km/s and +50 km/s, indicating an inward motion at the beginning and an outward motion at the end.
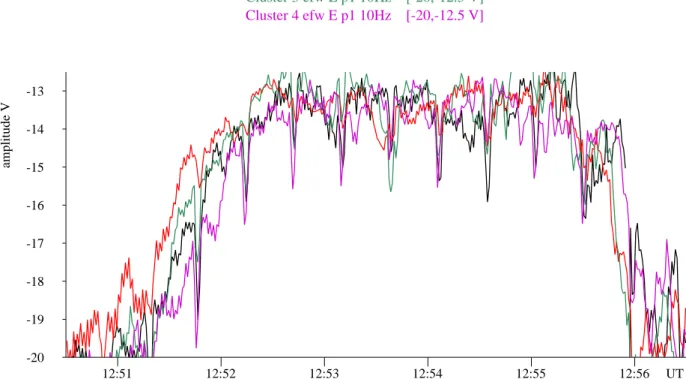
The spacecraft potential is a key parameter for accurately defining boundary layer crossings. The time sequence of spacecraft potential changes, combined with the separation between the spacecraft, can be used to identify the approxi-mate boundary orientation and velocity. The spacecraft po-tential measurements have a time resolution of 0.1 s and have been used for detailed studies of dusk flank magnetopause crossings (Bale et al., 2001). These authors found periodic bulges of the magnetopause, probably due to Kelvin-Helm-holtz instabilities and boundary motions of typically 50– 100 km/s. All boundary and magnetopause motions have velocities far greater than typical spacecraft velocities of a few km/s, and it is a good approximation to assume that the spacecraft are practically stationary. Figure 9 shows a high time resolution plot of the potential on all four spacecraft during the encounter of the BL-E1 structure. The spacecraft traverses the leading flank of the boundary layer, encounter-ing it in the order of spacecraft 2, 3, 1 and 4. The same order is maintained when the spacecraft are leaving the boundary layer. This indicates that an inward bulge of the boundary layer propagated tailward over the satellites caused the in-bound and outin-bound encounters. The increase in magnetic field strength associated with BL-E1 (Fig. 4) is indicative of a compressional MHD wave. For this case, the boundary
sur-face was relatively close to the model magnetopause and at the encounter, it moved in the −X and slightly in the +Y directions with a velocity of 30–40 km/s. The return to the magnetopause is more irregular and difficult to analyse.
The auroral brightening south of the pre-existing activity, seen from 12:53 UT onwards in Fig. 5, seems consistent with the inward push of the boundary layer. The eastward mo-tion/expansion of this form may correspond to the tailward movement of the boundary layer structure seen by Cluster. The auroral form attributed to BL-E1 was an intensification within the active band traversed by DMSP-F14 ∼ 10 min ear-lier. DMSP-F14 probed a mixture of intense magnetosheath-like ion and electron fluxes with a small flux of energetic ions, which is a key characteristic of the LLBL. The auro-ral activity was found to be located on sunward convecting field lines. Under the prevailing north IMF BZ, and
with-out any signatures of energy dispersed ions, the LLBL au-rora are likely to be located on closed field lines (Newell and Meng, 1998). Hence, it is reasonable to propose that Cluster had a brief encounter with a closed LLBL.
At 13:27 UT, spacecraft 1 made another crossing out of the magnetosphere, again marked by the disappearance of high-energy electrons and the occurrence of a colder and denser population. This population is characterised by energies in the range of 50–80 eV and densities of 20–40 cm−3. Note that in a short interval between 13:30 and 13:32 UT, Ne
in-creases to magnetosheath values (marked MSh in Fig. 3).
BZincreased to 20 nT, and the E × B velocity increased to
125 km/s in the −X and +Y directions, which is the expected direction and velocity in the magnetosheath. Therefore, this was a clear crossing of the magnetopause. The spacecraft returned to a less dense plasma, presumably just inside the magnetopause, and the satellite remained in this environ-ment until 13:57 UT when it again returned into the magneto-sphere, as seen by the reappearance of the high-energy elec-trons. It is interesting to observe that for the brief MSh inter-val of 13:30 to 13:32 UT, electron energy was nearly identical to that observed deeper in the magnetosheath at 15:10 UT. In the interval of 13:40–13:43 UT (inside the magnetopause), the electron energy was higher (increase from a 25–75 eV range to a 35–120 eV range). This period very likely repre-sented a crossing of the outer cusp region (around 13 RE). It
turned out to consist of a fairly structured electron popula-tion with irregular density variapopula-tions, but a general increase towards higher energies during the crossing.
Opgenoorth et al. (2001, this issue) have synthesised a global picture of the cusp reconfiguration associated with BL-E2. In a detailed analysis, they demonstrate how the cusp moved from an initially pre-noon location into the late post-noon sector. The eastward expansion over Svalbard is nicely illustrated in Fig. 7. Moen et al. (1999) reported a rapid east-ward shift of at least 3 hours in magnetic local time con-trolled by a transition in the IMF BY from −15 to +15 nT.
Sandholt et al. (1999) reported a similar transient expansion of the cusp aurora into the post-noon sector in response to a sharp southward turning of the IMF. In the case presented here, the reconfiguration of the cusp was likely controlled by
amplitude V -20 -19 -18 -17 -16 -15 -14 -13
14 Jan 2001
12:51 12:52 12:53 12:54 12:55 12:56 UT Cluster 1 efw E p1 10Hz [-20,-12.5 V] Cluster 2 efw E p1 10Hz [-35,-15 V] Cluster 3 efw E p1 10Hz [-20,-12.5 V] Cluster 4 efw E p1 10Hz [-20,-12.5 V]Fig. 9. High time resolution plots of the negative of the spacecraft potential of the four Cluster spacecraft during the BL-E1 encounter. The
data points represent 1 s averages. The scale of the potential of spacecraft 2 has been adjusted to be on the same level as the other three. Due to an unscheduled high beam current in the EDI experiment, this spacecraft was shifted to a lower potential. The periodic dips in the potential are due to the operation of the Whisper sounder.
the combination of a positive gradient in BY and the
nega-tive gradient in BZ, observed at the ACE location between
∼12:15 and 12:45 UT. The Pi-1 pulsations observed during BL-E2 (but not during BL-E2) is an indication of open field lines and turbulent plasma. We recall from Sect. 3 that the auroral activity ceased and the background arc faded at the time Cluster left BL-E2. Therefore, it is likely that Cluster’s encounter with BL-E2 was facilitated by an eastward expan-sion of the cusp over the spacecraft, and that it retreated to the magnetosphere when the extraordinary strong cusp event ceased.
4.3 Cusp auroral activities in the late post-noon sector NOAA-12 cut through the east end of the auroral activity that surged into the field-of-view from the west and reached Svalbard around 13:41 UT (see Fig. 4). It passed the 30 keV electron-trapping boundary marked by the vertical line in Fig. 5 at 13:47:45 UT. By inspecting the red satellite path in the 13:48:10 UT frame of Fig. 4, we can see that the satellite was then at a position well south of the bright arc (∼ 250 km). Sometimes a drizzle of energetic electrons occurs south of the electron-trapping boundary, giving rise to a 557.7 nm glow aurora (Moen et al., 1998), termed a type 3 aurora by Sandholt et al. (1998) (see Introduction). A type 3 aurora was not observed here, but we can see some precipitating high-energy electrons around 13:46 UT (the solid curve in the
sec-ond and third panels in Fig. 5). Poleward of the electron-trapping boundary, a significant flux of 0.3–0.46 keV elec-trons was observed between 13:47:45–13:50 UT, likely of magnetosheath origin, and it gave rise to the faint 630.0 nm luminosity seen at either side of the bright arc. The most sig-nificant energy flux peaking at 10 mWm−2, corresponding to the bright arc, was not spectrally resolved by NOAA-12. However, the characteristic energy of 1–2 keV indicates that the precipitating electrons had been through a potential drop, and that the arc is representing an upward field-aligned cur-rent sheet. In light of accumulated knowledge from DMSP observations, the region of structured electron precipitation and inverted Vs, mixed with a low energy component in this time sector (16:30 MLT), is what traditionally is classified as a BPS precipitation (see Introduction).
Another very interesting feature of the auroral activity ob-served in Fig. 7 is the sequence of moving auroral forms detaching from the quasi-persistent background arc. At
∼13:42 UT, the first form in the sequence separated from the background aurora between Greenland and Svalbard and subsequently drifted eastward. This moving auroral form was followed by two similar ones that separated from the active region at ∼ 13:51 and ∼ 13:53 UT, after which all the activity faded. The category of moving auroral forms is taken as a candidate signature of flux transfer events (FTEs; e.g. Sandholt et al., 1993 and Moen et al., 1995). This is probably
the type of auroral activity that Sandholt et al. (1998) named type 7 (see Introduction), which they pointed out is similar to the type 1 activity, except for the more intense 557.7 nm emission. Milan et al. (2000) attributed a discrete Polar UVI arc extending into the 19:00 MLT sector to a reconnection
X-line. Poleward-moving forms emanated from this arc in the 14:00–16:00 MLT sector, very similar to what we have reported here.
5 Summary and concluding remarks
We have related two boundary layer encounters experienced by Cluster to dynamic changes in the 15:00–17:00 MLT au-roral activity observed between Greenland and Svalbard. We have demonstrated the use of the T96 model to identify the nominal Cluster footprint in the ionosphere. Although the mapping is quite sensitive to solar wind conditions, it ap-pears to be a strong tool to identify the ionospheric regions of interest. The first boundary layer encounter occurred when the cusp was located in the pre-noon sector (Opgenoorth et al., this issue), and was addressed to closed LLBL field lines on a sunward convecting flow. The observations were found to be consistent with an inward bulge propagating tailward, most likely a boundary layer wave. The other boundary layer encounter was found to be consistent with a rapid reconfig-uration of the cusp, which moved over the spacecraft into the post-noon sector. The IMF was dominated by a nega-tive BX component and an increasingly positive BY which
is in favour of dusk flank reconnection. Therefore, it is quite unlikely that Cluster was close to a merging location in this case. A more detailed study including all electron and ion particle data with pitch-angle information will be con-ducted in order to identify key signatures to discriminate be-tween open and closed dayside boundary layers. Finally, this study supports the view that cusp auroral activity may oc-cur in the very late post-noon sector, and that discrete auro-ral forms and accelerated electron beams may occur on open field lines.
Acknowledgements. The Norwegian Research Council has funded
the Norwegian participation in the Cluster mission. This work has also benefited from the AFOSR grant F61775–01-WE014. We wish to acknowledge the World Data Centre for Geomagnetism for pro-viding the Dst magnetic index, and to California Institute of Tech-nology for giving www-access to ACE satellite data. A special thank to D. Evans for providing NOAA particle data. Thanks to K. Stasiewicz and co-workers who have developed the orbit visual-isation tool for Cluster.
Topical Editor M. Lester thanks S. W. H. Cowley and another referee for their help in evaluating this paper.
References
Bale, S. D., Mozer, F. S., Andre, M., Ericsson, A., Gustaffson, G., Holmgren, G., Lindqvist, P.-A., Holtet, J. A., Lybekk, B., Ped-ersen, A., Grard, R., Laakso, H., Mursula, K., Tanskanen, P., and Yerby, K.: The normal, thickness, and speed of the dusk
magnetopause from Cluster electric field and wave experiment measurements, submitted to Geophys. Res. Lett., 2001. Balogh, A., Dunlop, M. W., Cowley, S. W. H., Southwood, D. J.,
Thomlinson, J. G., Glassmeier, K. H., Musmann, G., L¨uhr, H., Buchert, S., Acu˜na, M. H., Fairfield, D. H., Slavin, J. A., Riedler, W., Schwingenschuh, K., Kievelson, M. G., and the Cluster mag-netometer team: The Cluster Magnetic Field Investigation, in The Cluster and Phoenix missions, (Eds) Escoubet, C. P., et al., Kluwer Academic Press, Dordrecht, 65–92, 1997.
Farrugia, C. J., Sandholt, P. E., Maynard, N. C., Burke, W. J., Scud-der, J. D., Ober, D. M., Moen, J., and Russell, C. T.: Pulsating mid-morning auroral arcs, filamentation of a mixing region in a flank boundary layer, and ULF ULF waves observed during a POLAR-Svalbard conjunction, J. Geophys. Res., 105, 27 531– 27 554, 2000.
Gustafsson, G., Andr´e, M., Eriksson, A.I., et al.: First results of electric field and density observations by Cluster EFW based on initial amounts of operations, Ann. Geophysicae, this issue, 2001.
Johnstone, A. D., Alsop, C., Burge, S., Carter, P. J., Coates, A. J., Coker, A. J., Fazakerley, A. N., Grande, M., Gowen, R. A., Gur-giolo, C., Hancock, B. K., Narheim, B., Preece, A., Sheather, P. H., Winningham, J. D., and Woodliffe, R. D.: PEACE: A plasma electron and current instrument, Space Sci Rev, 79, 351– 398, 1897. Reprinted in (Eds) Escoubet, C. P., Russell, C. T. and Schmidt, R. The Cluster and Phoenix missions, Kluwer Aca-demic Press, Dordrecht, 1997.
Lockwood, M.: Identifying the open-closed field line boundary, in Polar Cap Boundary Phenomena, (Eds) Moen, J., et al., Ad-vanced Study Institute Series, Kluwer Academic Press, Dor-drecht, Vol. 509, 415–432, 1998.
Lockwood, M. and Moen, J.: Ion populations on open field lines within the low-latitude boundary layer: theory and observations during a dayside transient event, Geophys. Res. Lett., 23, 2895– 2898, 1996.
Lockwood., M., Fuselier, S., Walker, A. D. M., and Søraas, F.: A summary of the NATO ASI on polar cap boundary phenomena, in Polar Cap Boundary Phenomena (Eds) Moen, J., et al., NATO Advanced Study Institute Series, Kluwer Academic Press, Dor-drecht, Vol. 509, 415–432, 1998.
Lockwood, M., Opgenoorth, H., van Eyken, A. P., Fazakerley, A., Bosqued, J. M., Denig, W. F., Wild, J., Cully, C., Greenwald, R., Lu, G., Amm, O., Frey, H., Strømme, A., Prikryl, P., Hap-good, H. A., Wild, M. N., Stamper, R., Taylor, M., McCrea, I., Kauristie, K., Pulkinnen, T., Pitout, F., Balogh, A., Dunlop, M., R`eme, H., Behlke, R., Hansen, T., Provan, G., Eglitis, P., Morley, S. K., Alcayd´e, D., Blelly, P.-L., Moen, J., Donovan, E., Engebregtson, M., Lester, M., Waterman, J., and Marcucci, M. F.: Coordinated Cluster, ground-based instrumentation and low-altitude satellite observations of transient poleward moving events in the ionosphere and the tail lobe, Ann. Geophysicae, this issue, 2001.
Lorentzen, D. A., Deehr, C. S., Minow, J. I., Smith, R. W., Stenbaek-Nielsen, H. C., Sigernes, F., Arnoldy, R. L., and Lynch, K.: SCIFER-Dayside auroral signatures of magnetospheric ener-getic electrons, Geophys. Res. Lett., 23, 1885–1888, 1996. Lorentzen, D. A. and Moen, J.: Auroral proton and electron
sig-natures in the dayside aurora, J. Geophys. Res., 105, 12 733– 12 745, 2000.
Milan, S. E., Lester, M., Cowley, S. W. H., and Brittnacher, M.: Convection and auroral response to a southward turning of the IMF: Polar UVI, CUTLASS, and IMAGE signatures of transient
magnetic flux transfer at the magnetopause, J. Geophys. Res., 105, 15 741–15 755, 2000.
Moen, J., Sandholt, P. E., Lockwood, M., Denig, W. F., Løvhaug, U. P., Lybekk, B., Egeland, A., Opsvik, D., and Friis-Christensen, E.: Events of enhanced convection and related dayside auroral activity, J. Geophys. Res., 100, 23 917–23 934, 1995.
Moen, J., Evans, D., Carlson, H. C., and Lockwood, M.: Dayside moving auroral transients related to LLBL dynamics, Geophys. Res. Lett., 23, 3247–3250, 1996.
Moen, J., Lorentzen, D. A., and Sigernes, F.: Dayside moving au-roral forms and bursty proton auau-roral events in relation to par-ticle boundaries observed by NOAA-12, J. Geophys. Res., 103, 14 855–14 863, 1998.
Moen, J., Carlson, H. C., and Sandholt, P. E.: Continuous observa-tions of cusp auroral dynamics in response to an IMF BYpolarity
change, Geophys. Res. Lett., 26, 1243–1246, 1999.
Newell, P. T. and Meng, C.-I.: The cusp and the cleft/boundary layer: low-altitude identification and statistical local time varia-tion, J. Geophys. Res., 93, 14 549–14 556, 1988.
Newell, P. T. and Meng, C.-I.: Mapping the dayside ionosphere to the magnetosphere according to particle precipitation character-istics, Geophys. Res. Lett., 19, 609–612, 1992.
Newell, P. T. and Meng, C.-I.: Open and closed low latitude bound-ary layer, in Polar Cap Boundbound-ary Phenomena, (Eds) Moen, J., et al., NATO Advanced Study Institute Series, Kluwer Academic Press, Dordrecht, 509, 91–101, 1998.
Ober, D. M., Maynard, N. C., Burke, W. J., Moen, J., Egeland, A., Sandholt, P. E., Farrugia, C. J., Weber, E. J., and Scudder, J. D.: Mapping of ionospheric auroral features associated with the prenoon boundary layer to the magnetosphere, J. Geophys. Res., 105, 27 519–27 530, 2000.
Øieroset, M., Sandholt, P. E., Denig, W. F., and Cowley, S. W. H.: Northward interplanetary magnetic field cusp aurora and
high-latitude magnetopause reconnection, J. Geophys. Res., 102, 11 349–11 362, 1997.
Opgenoorth, H, Lockwood, M., Alcayd´e, D., Donovan, E., En-gebretson, M. J., van Eyken, A. P., Kauristie, K., Lester, M., Moen, J., Waterman, J., Alleyne, H., Andr´e, M., Dunlop, M. W., Cornilleau-Wehrlin, N., D´ecr´eau, P. M. E., Fazerkerley, A., R`eme, H. M., Andr´e, R., Amm, O., Balogh, A., Behlke, R., Blelly, P. L., Boholm, H., Bor¨alv, E., Bosqued, J. M., Buchert, S., Candidi, M., Cerisier, J. C., Cully, Ch., Denig, W. F., Doe, R., Eglitis, P., Greenwald, R. A., Jackal, B., Kelly, J. D., Krauklis, I., Lu, G., Mann, I. R., Marcucci, M. F., McCrea, I. W., Mak-simovic, M., Massetti, S., Masson, A., Milling, D. K., Orsini, S., Pitout, F., Provan, G., Ruohoniemi, J. M., Samson, J. C., Schott, J. J., Sedgemore-Schulthess, F., Stamper, R., Stauning, P., Strømme, A., Taylor, M., Vaivads, A., Villain, J. P., Voronkov, I., Wild, J., and Wild, M.: Coordinated ground-based, low altitude satellite and Cluster observations on global and local scales dur-ing a transient postnoon sector excursion of the magnetospheric cusp, Ann. Geophysicae, this issue, 2001.
Sandholt, P. E., Moen, J., Rudland, A., Opsvik, D., Denig, W. F., and Hansen, T.: Auroral event sequences at the dayside polar cap boundary for positive and negative IMF BY, J. Geophys. Res.,
98, 7737–7755, 1993.
Sandholt, P. E., Farrugia, C. J., Moen, J., Noraberg, Ø., Lybekk, B., Sten, T., and Hansen, T. L.: A classification of dayside auroral forms and activities as a function of IMF orientation, J. Geophys. Res., 103, 23 325–23 345, 1998.
Sandholt, P. E., Farrugia, C. J., and Lybekk, B.: The dynamic cusp aurora on 30 November 1997: response to southward turning of the IMF, Ann. Geophysicae., 17, 1155–1165, 1999.
Tsyganenko, N. A.: Modelling the Earth’s magnetospheric mag-netic field confined with a realistic magnetopause, J. Geophys. Res., 100, 5999, 1995.