HAL Id: hal-02354799
https://hal.archives-ouvertes.fr/hal-02354799
Submitted on 2 Jan 2021
HAL is a multi-disciplinary open access
archive for the deposit and dissemination of
sci-entific research documents, whether they are
pub-lished or not. The documents may come from
teaching and research institutions in France or
abroad, or from public or private research centers.
L’archive ouverte pluridisciplinaire HAL, est
destinée au dépôt et à la diffusion de documents
scientifiques de niveau recherche, publiés ou non,
émanant des établissements d’enseignement et de
recherche français ou étrangers, des laboratoires
publics ou privés.
Internal Source of Hydrogen on Ca-Modified TiO 2
Supported Ru Catalysts
Joanna Wojciechowska, Marcin Jędrzejczyk, Jacek Grams, Nicolas Keller,
Agnieszka Ruppert
To cite this version:
Joanna Wojciechowska, Marcin Jędrzejczyk, Jacek Grams, Nicolas Keller, Agnieszka Ruppert.
En-hanced Production of γ-Valerolactone with an Internal Source of Hydrogen on Ca-Modified TiO 2
Supported Ru Catalysts. ChemSusChem, ChemPubSoc Europe/Wiley, 2019, 50 years of the Jerzy
Haber Institute, 12 (3), pp.553-553. �10.1002/cssc.201900236�. �hal-02354799�
Enhanced production of
𝛾-valerolactone with internal source of
hydrogen on Ca-modified TiO
2
supported Ru catalysts
Joanna Wojciechowska,
[a,b]Marcin Jędrzejczyk,
[a]Jacek Grams,
[a]Nicolas Keller,*
[b]Agnieszka M.
Ruppert,*
[a]Abstract: In this work, calcium-modified titania supported Ru
catalysts were synthesized and evaluated in the levulinic acid hydrogenation with formic acid as internal hydrogen source and water as green solvent. A new elegant photo-assisted method allowing the synthesis of uniform size and evenly distributed Ru particles on the titania surface was developed. Compared to the counterpart catalysts prepared by classical wet impregnation, enhanced levulinic acid conversion and 𝛾-valerolactone yield were reached, and further exalted thanks to the support modification via the calcium introduction into the titania support. This synthesis approach resulted in a change of the surface and bulk properties of the support, namely a decrease in the anatase crystallite size and the formation of new calcium titanate phase. In consequence the properties of the catalysts were modified, and smaller ruthenium particles interacting stronger with the support were developed. This affected the strength of CO adsorption on the catalyst surface and facilitated the reaction performance. The optimum size of Ru particles allowing for most efficient levulinic acid conversion was established.
Introduction
The depletion of fossil fuel reserves associated to the necessity of limiting the worldwide CO2 release has been the driving force
over the last decades in the search for alternative value chains for producing sustainable fuels and chemicals. Value added platform molecules issued from the conversion of lignocellulosic biomass feedstock are expected to play a pivotal role in the move towards future 'renewable-based chemicals' biorefinery schemes.[1]
In this frame, 𝛾-valerolactone (GVL) has attracted a significant attention since it is used in many potential versatile applications, as biofuel additive thanks to a low volatility, a minimum toxicity and a good stability, as well as eg. as solvent or precursor in chemical syntheses.[2] GVL can be obtained by catalytic
hydrogenation of levulinic acid (LA) issued from the hydrolytic conversion of lignocellulosic biomass, most of the studies being performed with a pressurized external source of hydrogen.[3]
Ruthenium remains often a metal of choice for LA hydrogenation in water solvent due to its outstanding performance, which is related to the decrease of its energetic span in the presence of a protic solvent.[4] The nature of the
catalyst support was also reported to be of high importance, and TiO2 was proved to be a promising candidate for supporting Ru
nanoparticles for producing GVL. Indeed, Lange indicated that TiO2 was a support of high interest due to good mechanical and
thermal stability under hydrothermal, acidic conditions.[5] Later
on, we evidenced that the phase composition of the TiO2 support
directly influenced the catalytic performance of the Ru catalysts, the highest activity being observed for an anatase/rutile mixed phase support when compared to the counterpart catalysts on the pure anatase or rutile phase supports.[6] This behavior was
related to the selective deposition of Ru with optimum size distribution on the rutile fraction of the mixed phase support. By contrast, the formation of either too small Ru crystallites too strongly interacting with pure large surface area rutile, or of too large aggregates of Ru on the pure anatase phase, resulted in both cases in catalysts with low activity.
Kuwahara et al. studied the catalytic transfer hydrogenation of levulinate esters with alcohols as hydrogen donors using Ru(OH)x/TiO2 catalysts, and evidenced that high surface area
anatase TiO2 supported highly-dispersed Ru(OH)x nano-clusters
were the most active catalyst.[7] Furthermore, Tan et al.
compared commercial titania and zirconia materials as supports for Ru catalyst for performing the reaction in water phase. They claimed that titania is more suitable than ZrO2, as the strong
metal–support interaction between Ru and TiO2 facilitates the
metal dispersion and therefore increases the catalyst stability.[8]
The proper modification however allows also to prepare Ru/ZrO2
of high stability and activity.[9]
Optimum dispersion and distribution of Ru on the TiO2
support was recently proposed for explaining the high activity and stability displayed by a 5%Ru/TiO2 catalyst in the
continuous flow hydrogenation of methyl levulinate when compared to commercial Ru/C and Ru/Al2O3 reference catalysts. [10] In addition, Li et al. showed that the high activity and
selectivity achieved on anatase TiO2 supported Ru catalysts
were attributed to enhanced metal-support interaction thanks to intimate contact between Ru and anatase nanoparticles and to the Ru nano-size. A stronger electron donation from TiO2 to Ru
and an easier reducibility of Ru species were proposed to modify both activity and selectivity patterns and to boost Ru for the selective transformation of substrates.[11]
So far, most of the studies used externally supplied H2 for
performing the hydrogenation of LA into GVL. However, a step forward in the design of sustainable biomass hydrogenation processes can be achieved by using formic acid (FA) as internal source of H2. Indeed, the acidic hydrolysis of lignocellulosic
biomass forms an LA/FA equimolar mixture, while FA can be further selectively decomposed into H2. So far this internal H2
supply approach was not investigated to such extend as the LA hydrogenation using high pressure H2, and is more challenging,
since the strategy requires that both the hydrogenation of LA to GVL and the FA dehydrogenation can be catalyzed by a single material in similar reaction conditions.[12] Taking into account that
FA can decompose either via dehydrogenation into H2 and CO2
or via dehydration into CO2 and CO - with possible side
reactions like the water-gas-shift reaction or Fischer-Tropsch with methane production, the first step H2 formation from FA is
often considered as a limiting factor. Indeed, FA dehydration and side reactions negatively impact on the H2 selectivity while CO
[a] Dr. A.M. Ruppert, Dr. J. Grams, Dr. M. Jędrzejczyk, J. Wojciechowska Institute of General and Ecological Chemistry, Faculty of Chemistry,
Łódź University of Technology
ul. Żeromskiego 116, 90-924 Łódź (Poland) E-mail: agnieszka.ruppert@p.lodz.pl [b] Dr. N. Keller, J. Wojciechowska
Institut de Chimie et Procédés pour l'Energie, l'Environnement et la Santé (ICPEES), CNRS, University of Strasbourg,
25 rue Becquerel, 67087, Strasbourg (France) E-mail: nkeller@unistra.fr
acts as a poison for the active sites, so that designing selective and robust catalysts still remains a crucial challenge.
Although being very active for LA hydrogenation, Ru catalysts are known to also catalyze side reactions that affect strongly the selectivity to hydrogen of the FA decomposition, so there the implementation of adequate modification of Ru catalysts remains actually an approach of high interest in this respect. One of the strategies for selectivity improvement relates with the introduction of bases to the reaction system, either by addition of free bases to the reaction mixture or by introducing directly basic sites to the catalyst surface through material modification. For instance, high TOF up to 1590 h-1 were achieved at 50°C on Au/
ZrO2 with the addition of NEt3 maintaining a low CO level below
5 ppm.[13] On another hand, the design of heterogeneous
catalysts with basic sites is an elegant and more sustainable approach for avoiding separation issues resulting from the continuous supply of the reaction media with high amounts of amine additives. Further, the presence of suitable surface groups in a close vicinity of metal active centers was already proposed to positively impact on the catalytic activity. Recently, great improvement was achieved in terms of hydrogen production from formic acid in vapour phase with a very high selectivity thanks to the addition of K to a Au/Al2O3 and Pd/C
catalysts through incipient wetness impregnation.[14,15]
A proof of concept for the use of Ru catalysts with supports exposing basic surface sites was already demonstrated in the LA hydrogenation with external hydrogen supply. Indeed, Ru supported on Mg-LaO mixed oxide obtained from hydrotalcite was efficiently used as catalyst for producing GVL.[16] However
no explanation for the role of basic sites in this system was proposed. Further, Cao et al. showed the beneficial effect of adding potassium to Ru/C and Ru/Al2O3 catalysts via KNO3
impregnation in the LA hydrogenation at 220°C under 13.8 bars of H2 using 1,4-dioxane as solvent.[17] The higher activity of
K-modified Ru catalysts was ascribed to an increase of electron donation from the K promotor to the Ru nanoparticles, providing enhanced metallic character to Ru, as well as to the decreased CO adsorption on K-doped materials. They proposed that LA hydrogenation is structure sensitive and depends on the Ru particle size, with an activity maximum at about 1.5 nm.
Here, we show the synthesis of Ca-modified TiO2 supported
Ru catalysts and their application in the hydrogenation of LA towards GVL with FA as internal hydrogen source and water as green solvent. We evidenced that the controlled modification of the TiO2 support by calcium influenced both bulk and surface
properties of the Ru catalysts and positively impacted on the FA dehydrogenation step as well as on the LA hydrogenation reaction. Further, an elegant photo-assisted synthesis method under solar light allowing the synthesis of Ru catalysts with enhanced GVL formation was developed for subsequently investigating the effect of the Ru particle size in the transfer hydrogenation as well as in both FA dehydrogenation and LA hydrogenation separated reactions, and for getting insight on the catalyst features playing a role in the achievement of enhanced performances in the process.
Results and Discussion
Materials characterization
Characterization of TiO2 and Ca-modified TiO2 supports
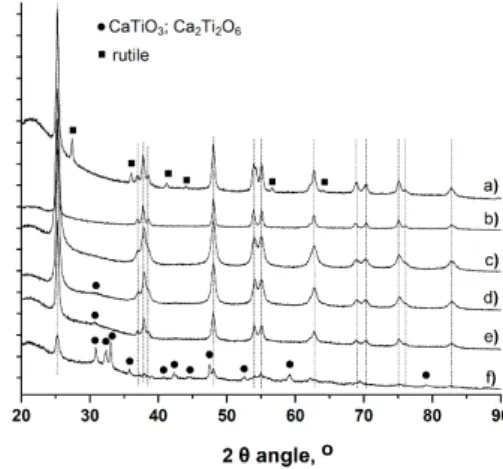
Figure 1 shows the powder XRD patterns of the TiO2-based
supports. Whether TiO2 was modified with Ca or not, they
exhibited diffraction reflexes corresponding to anatase TiO2
(JCPDS card 21-1272), with the characteristic most intense peak at 25.3° corresponding to the diffraction of (101) planes, no rutile phase being observed, except in the case of the TiO2 P25
commercial reference. For low Ca content, no phase related to the presence of Ca such as oxides or hydroxides was observed, in agreement with previous works on the modification of sol-gel TiO2 by Ca ions.[19,20] Increasing the Ca content resulted in the
progressive appearance of a weak and broad diffraction signal at 2θ = 31.0° assigned to the Ca2Ti2O6 phase (JCPDS card
40-0103), and in the observation of clear diffraction peaks corresponding to both CaTiO3 (JCPDS cards 78-1013) and
Ca2Ti2O6 phases) for the 20Ca-T500. It is however difficult to
distinguish between those two phases of calcium titanate due to signal overlaps. This was accompanied with a strong decrease in the intensity of the anatase diffraction peaks, in agreement with the work of Al-Salim et al. that showed that increasing the content of alkaline earth ion such as Ca2+ in the sol-gel
synthesis of TiO2 strongly increased the amorphous content.[20]
Figure 1. Powder XRD pattern of the support materials a) TiO2 P25 ;b) T500 ;
c) 1Ca-T500 ; d) 5Ca-T500 ; e) 10Ca-T500 ; f) 20Ca-T500. (vertical lines) diffraction peaks corresponding to the anatase TiO2 phase ; (!) most intense
peaks corresponding to the titanate phases.
Whether calcium titanate phases were observed or not, the modification of titania with Ca2+ ions caused also some distortion
in the TiO2 lattice, as a result of the intermediate ionic radius of
Ca2+ at 1.06 Å being larger than that of Ti4+ (0.64 Å) and smaller
than that of O2- (1.31 Å), so that Ca2+ ions could be either
isomorphously substituted or interstitially introduced into the TiO2 lattice with the corresponding formation of oxygen
vacancies or of Ti3+ centers, respectively. In agreement with
Al-Salim et al. [20] and Hameed et al.,[19] this was experimentally
visualized by an increase in the a cell parameter and a decrease in the c parameter, resulting in an overall change in the anatase cell volume (Table 1). Both commercial TiO2 P25 and sol-gel
TiO2 T500 displayed the largest anatase mean crystallite size at
21 and 25 nm, respectively, whereas the Ca-modified TiO2
materials exhibited a lower mean crystallite size at 13-16 nm, with no significant differences between the different Ca contents. This indicated that the modification with Ca2+ can inhibit the TiO2
crystallite growth, due to lower nucleation.
This TiO2 crystal size decrease upon doping with alkaline earth
ions was previously reported by Al-Salim et al. and Fu et al.,[20,21]
more generally of transition metal oxides nanomaterials. The smaller mean anatase crystallite size of Ca-modified samples compared to that of the Ca-free reference correlated well with their higher non-microporous BET specific surface area in the 40-60 m2/g range vs. 27 m2/g for the TiO2 T500 (Table 1). The
decrease in surface area when increasing the Ca content could be explained by the slight increase in the mean crystallite size of anatase. It is worth noting that the surface area and the pore volume of Ca-TiO2 materials remained lower than those of the
TiO2 P25, probably due to the existence of grain boundaries
between crystallites in the samples that lower the overall specific surface area. One could note that modifying TiO2 with Ca2+ led
to a decrease in the isoelectric point of the supports, with values within the 2.4-3.0 range for Ca-modified TiO2 materials
compared to 3.4 for the and 4.5 for the TiO2 T500 reference and
the TiO2 P25.
This decrease in isoelectric point might be related to the formation of new basic sites at the support surface. Indeed, it has been reported that the doping of metal oxide by Ca promotor can cause an increase in the number and strength of basic sites, in the form of coordinately unsaturated oxygen ions O2-.[22,23] For instance, the nature of alumina supports has been
reported to be strongly shifted from acidic to basic by addition of growing amount of Ca.[22,23] Therefore the Ca-modified samples
required the addition of a higher amount of H+ during the zeta
potential measurement for neutralizing the more negative surface by charge compensation, so resulting in the measurement of a lower isoelectric point. Further, the slight increase of the isoelectric point for 10 wt.% of Ca might result from the formation in large amount of CaTiO3 phase at the
support surface, or from the increase in the amorphous content of the support.
The SEM images shown in Figure 2 revealed the morphological changes observed when modifying the TiO2 with
calcium. While the Ca-free TiO2 reference displayed the
classical morphology of sol-gel TiO2 materials, the incorporation
of calcium into the support increased the heterogeneity of the material surface. This property may be assigned to the smaller TiO2 crystallite size and the progressive appearance of the
calcium titanate phases when increasing the calcium content. Indeed, the sample with 20 wt.% of Ca revealed the most altered morphology with the appearance of melted-like small size particles. Whatever the Ca content, the Ti, Ca and O elemental
mapping evidenced the homogeneous distribution of the calcium heteroatoms in the TiO2-based supports, whether the Ca ions
distributed within the TiO2 lattice or the Ca ions from the titanate
phase are concerned. In addition, the Ca contents derived from the EDS analysis were in good agreement with the theoretical values from the modified sol-gel syntheses, confirming that the Ca species were evenly distributed in the samples.
Figure 2. SEM images and the corresponding O, Ti and Ca element mapping
images of selected support materials : a) T500; b) 1Ca-T500; c) 5Ca-T500; d) 20Ca-T500.
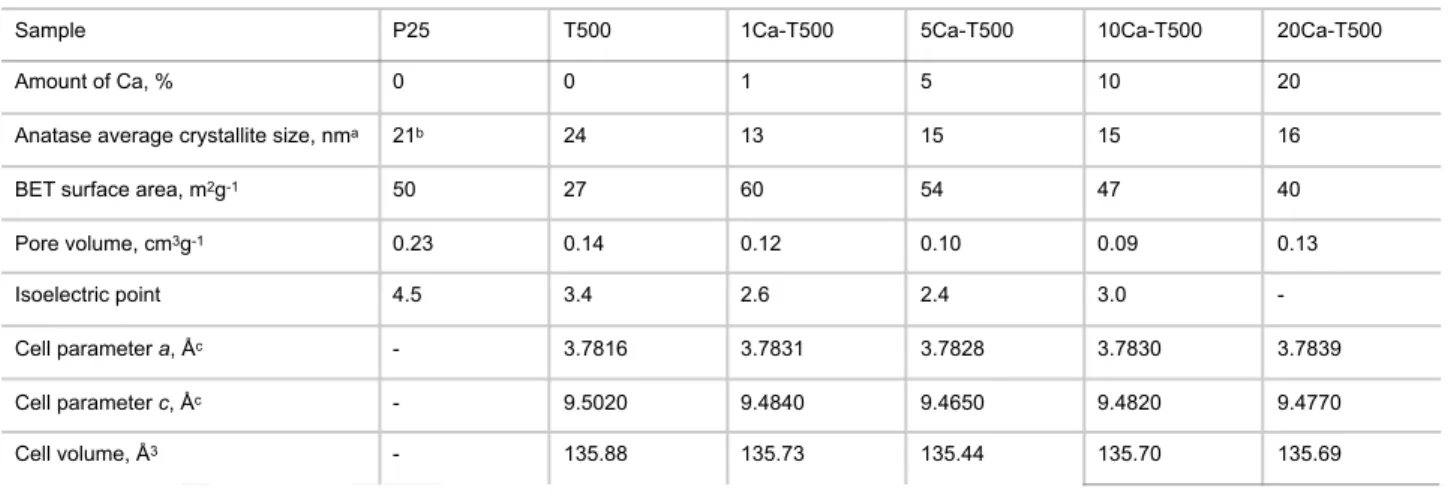
Table 1. Physicochemical characterization of the TiO2-based supports
Sample P25 T500 1Ca-T500 5Ca-T500 10Ca-T500 20Ca-T500
Amount of Ca, % 0 0 1 5 10 20
Anatase average crystallite size, nma 21b 24 13 15 15 16
BET surface area, m2g-1 50 27 60 54 47 40
Pore volume, cm3g-1 0.23 0.14 0.12 0.10 0.09 0.13
Isoelectric point 4.5 3.4 2.6 2.4 3.0
-Cell parameter a, Åc - 3.7816 3.7831 3.7828 3.7830 3.7839
Cell parameter c, Åc - 9.5020 9.4840 9.4650 9.4820 9.4770
Cell volume, Å3 - 135.88 135.73 135.44 135.70 135.69
[a] The mean TiO2 crystallite size, i.e. the average size of the coherent diffracting domains, was derived from XRD measurement through the Scherrer
equation applied to the (101) peak of anatase at 25.7° with the usual assumption of spherical crystallites. [b] calculated on the anatase phase ; [c] Derived from XRD patterns (recorded for 12 h) by the Rietveld refinement method using the FULLPROF software.[18]
Characterization of Ru catalysts
Figure 3 shows representative TEM images of Ru-based catalysts prepared via impregnation and thermal reduction under hydrogen, along with the corresponding Ru nanoparticle size distributions. The Ru/P25-I sample exhibited the smallest mean particle size of 2.9 nm with the narrowest size distribution (FWHM = 1.9). By contrast, the Ru/T500-I sample was characterized by a broader nanoparticle size distribution (FWHM = 6.2), centered on a much larger mean Ru nanoparticle size at 5 nm, together with the contribution of very large particles, up to 18 nm in size. Modifying the support with 10% of Ca improved the dispersion of the supported nanoparticles, with a reduced mean Ru particle size at 3.8 nm and a more homogeneous size distribution (FWHM = 2.4)
Figure 3. TEM images and the corresponding histograms of the Ru
nanoparticle size distribution for the catalysts prepared via classical incipient wet impregnation with final thermal treatment under hydrogen : a) Ru/P25-I; b) Ru/T500-I; c) Ru/10Ca-T500-I.
The TEM images of the Ru/TiO2 catalysts prepared via the
photodeposition method are presented in Figure 4, together with the corresponding Ru nanoparticle size distributions. Whatever the TiO2 support, the nanoparticle size distributions strongly
differed from those achieved for Ru catalysts prepared by classical incipient wet impregnation. The supported nanoparticles were homogeneously dispersed and no ruthenium aggregates were observed. Their metallic character was evidenced by TEM and X-Ray Photoelectron Spectroscopy analyses shown in Supporting Information SI 1 and SI 2. Small Ru nanoparticles were synthesized on the supports, with sharp nanoparticle size distributions centered on remarkably small particle sizes. Recently, sub-nanometric and narrow particle size distributions were obtained for Ru/TiO2 catalysts.[24] Similarly
here the smallest and sharpest Ru nanoparticle size distribution was obtained on the Ru/P25-P catalyst with a sub-nanometric mean size of 0.8 nm and a very small FWHM of 0.3 nm, while the Ru/T500-P catalyst displayed the largest particle size
centered on 3 nm with the largest FWHM of 1.8 nm. Modifying the TiO2 support with 1-5 wt.% of Ca led to reduce the mean Ru
particle size down to 1.4-1.5 nm with a much sharper size distribution (FWHM=0.6-0.8 nm) when compared to that obtained on the sol-gel TiO2 reference. Only in the case of the
Ru/10Ca-T500-P catalyst, a bimodal distribution was identified, with the significant contribution of larger particles centered around 5 nm in size in parallel to the well-calibrated small size particles at 1.8 nm. This bimodal distribution might result from the increased amount of amorphous phase in the material when increasing the Ca content or from different bulk and surface charge recombination rates between both CaTiO3 and TiO2
semiconductor phases, that in both cases might impact the photogenerated charge dynamics at the support surface during the UV-A light-assisted preparation method.
Figure 4. TEM images and the corresponding histograms of the Ru
nanoparticle size distribution for the catalysts prepared via the photo-assisted synthesis approach : a) Ru/P25-P; b) Ru/T500-P; c) Ru/1Ca-T500-P; d) Ru/ 5Ca-T500-P; e) Ru/10Ca-T500-P.
It could be evidenced that the use of the photodeposition preparation method allowed to prepare Ru/TiO2 catalysts with
much smaller Ru nanoparticle size than when using the classical incipient wet impregnation. The photo-deposition method takes advantage of the redox photoactivity developed under UV-A light by the TiO2 semi-conductor support for promoting electrons to
the conduction band of the semi-conductor, further able to directly reduce at room temperature highly dispersed pre-adsorbed metal ions at the surface of the support. This low-temperature photoassisted redox strategy has been reported to offer a potential control over the Ru nanoparticle size and their size distribution, allowing the synthesis of well-calibrated metallic nanoparticles to be achieved.[24-26]
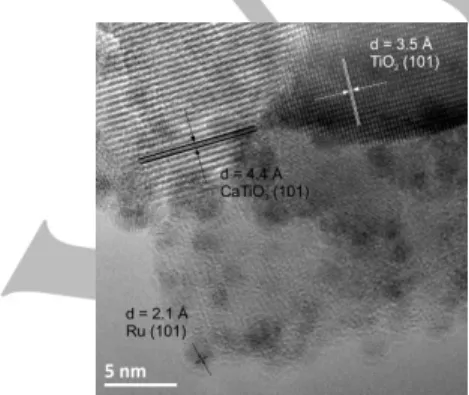
The high resolution TEM image of the Ru/5Ca-T500-P catalyst shown in Figure 5 confirmed the coexistence of both the anatase TiO2 and the calcium titanate phase inside the support,
and of the nanosized metallic Ru nanoparticles.
Figure 5. High resolution TEM images of the Ru/5Ca-T500-P catalysts, with
the interplane distances of (101) planes of metallic Ru, of (101) planes for anatase TiO2 and of (101) planes for CaTiO3.
Temperature programed reduction (TPR) measurements To study the reducibility of the Ru/TiO2 catalysts prepared by
impregnation and photodeposition as well as to understand the influence of the Ca modification on the physicochemical properties of the catalysts, temperature programed reduction (TPR) measurements were performed. TPR profiles are only shown for Ru catalysts prepared by impregnation, since the photodeposition method led to directly synthesize metallic Ru nanoparticles on the support (SI 1 and SI 2).
Figure 6. TPR profiles for Ru catalysts prepared by the impregnation method
a) Ru/P25-I; b) Ru/T500-I; c) Ru/1Ca-T500-I; d) Ru/5Ca-T500-I; e) Ru/10Ca-T500-I; f) Ru/20Ca-T500-I.
Figure 6 show that all the catalysts prepared by impregnation exhibit one main reduction maximum. On both commercial and sol-gel titania, the profiles look very similar, with a maximum at 110°C that could be most probably attributed to the reduction of well dispersed crystalline RuO2.[27,28] The very low H2
consumption with no clear maximum observed at lower temperature before the main signal could be assigned to the presence of well dispersed, small and amorphous RuO2.[29] With
the addition of Ca to the support, the reduction maximum is shifted towards higher temperatures, from 140°C for 1%, to 200-210°C for the highest Ca content, indicating stronger interactions of RuOx with the support. This trend with increasing
the amount of Ca could be related to the increase in the content of the CaTiO3 phase on which Ru is evenly distributed. This can
result in stronger interaction with the support, leading to the shift in the reduction peak. Similar effect of strengthening of the metal–support interaction was observed by Carrero et al. in Mg and Ca-promoted Ni–Cu/SiO2 catalysts.[30] Moreover in the case
of the Ca-modified samples, a third smaller and very broad shoulder is observed between 190°C-300°C, which increases with the Ca loading. This could be associated with the RuOx with
strong interactions with the CaTiO3 phase.
CO-FTIR studies
FTIR spectra of adsorbed CO are presented in Figure 7 for catalysts prepared by impregnation. The spectra show bands at frequencies 2138 cm-1, 2084 cm-1 and 2016 cm-1 with a shoulder
at 1980 cm-1 that are attributed to CO adsorbed on Ru
crystallites. In addition, in the spectra of samples containing 5%, 10% and 20% of Ca, a band at 1620 cm-1 is visible.
Figure 7. TFTIR spectra of adsorbed CO obtained for the catalysts prepared
by the impregnation method a) Ru/P25-I; b) Ru/T500-I; c) Ru/1Ca-T500-I; d) Ru/5Ca-T500-I; e) Ru/10Ca-T500-I; f) Ru/20Ca-T500-I.
It has to be mentioned that in the case of supported Ru catalysts, there is an ongoing discussion on the interpretation of the FTIR spectra and on the peak assignment.[31-37] Both bands
at 2084 cm-1 and 2138 cm-1 are assigned to the multicoordinated
CO adsorption on electron deficient ruthenium particles Ruδ+. [31-37] The presence of positively-charged metal particles may
result from its strong interaction with the carrier or the presence of chlorine.[34,36,37] Another mechanism involves the oxidation of
metallic Ru induced by the reaction of adsorbed CO and hydroxyl groups of the support.[31] The band at 2016 cm-1 with a
shoulder at 1980 cm-1 is attributed to CO linearly adsorbed on
ascribed to the linear CO adsorption on faces and steps of Ru crystallites. It is however difficult to clearly differentiate between them as their exact position depends on the CO coverage. On one hand, according to Blyholder et al., the shoulder at 1980 cm-1 represents the CO adsorption on edges, corners or
dislocations of Ru particles. CO adsorption on lower coordination sites (like corners or edges) is stronger due to the reduced competition for electrons involved in the back-donation from the central Ru atom to carbon.[38] On another hand, this
band was assigned by Elmasides at al. to CO adsorbed on metal sites strongly interacting with the support in Ca-doped Ru/ TiO2 materials.[39] This is in agreement, first with Figure 7,
evidencing that the contribution of this shoulder becomes more prominent (in respect of the 2016 cm-1 band) for samples
containing more Ca, and further with the TPR results, showing that increasing the Ca content in the support facilitates stronger Ru-support interactions.
Furthermore, the band located at 1620 cm-1, which can be
assigned to the carbonate type species formed on the surface of the available calcium cations, was evidenced in the case of the samples containing 5%, 10% and 20% of Ca.
When it comes to the intensity of different bands, it is necessary to point out that several aspects such as the metal particle size or the metal-support interactions can be responsible for the level of CO adsorbed. For Ru/P25-I, the highest CO adsorption was observed most probably due to the smallest Ru particle size. For Ru/T500-I, larger metal particles caused a drop in the amount of the adsorbed CO. Furthermore, a clear trend is observed, CO adsorption decreased with increasing the Ca content. Based on the TPR results, increasing contribution of Ca-modified support cause stronger Ru-support interactions. Therefore, it could be concluded that the CO adsorption on Ru strongly interacting with the support remains limited.
Figure 8 shows CO-FTIR spectra of the samples prepared by the photodeposition method. Analogous bands to those obtained for the materials prepared by impregnation were observed, however with a the red shift for each band of about 10-20 cm-1.
The red shift could be explained either by the smaller Ru particle size for samples prepared by photodeposition or by a decrease in the dipole-dipole coupling effect of adsorbed CO molecules with decreasing coverage.[40] The band in the region 2000-1990
cm-1 is attributed to the linear CO adsorption on Ru, while the
two bands at 2063 cm-1 and 2126 cm-1 represent the
multicoordinated CO adsorption on Ruδ+.
Figure 8. FTIR spectra of adsorbed CO obtained for the catalysts prepared by
the photodeposition method a) Ru/P25-P; b) Ru/T500-P; c) Ru/1Ca-T500-P; d) Ru/5Ca-T500-P; e) Ru/10Ca-T500-P; f) Ru/20Ca-T500-P.
The relationship between the particle size and the CO adsorption was similar for samples prepared by photodeposition, namely the highest intensity of the bands was identified on smallest particles of Ru/P25-P. A similar CO adsorption was observed whatever the Ca content of the modified TiO2
materials, in agreement with the TPR analyses, for which it was concluded that all the tested samples exhibited the same type of metal-support interactions.
Signals at 1458 cm-1 and 1554 cm-1 which are especially
identified for Ru/20Ca-T500 correspond to the carbonate species adsorbed on the support.
Analysis of the catalysts surface by ToF-SIMS analysis ToF-SIMS analysis of the catalyst surface was performed in order to understand the effect of the calcium modification and the ruthenium interactions with the support (Table 2).
It was observed that the signals from ruthenium and the Ru+/
Ti+ ratio are the lowest in the case of Ru/T500-I and
Ru/1Ca-T500-I among the samples prepared by the impregnation method. Moreover, by comparing the catalysts prepared by the two different methods, a slightly lower Ru intensity is observed for the ones prepared by impregnation. This can be explained by the partial coverage of Ru by titania migrating during the thermal treatment which occurs to higher extent for samples prepared by impregnation.[41] This suggests also that the modification with Ca
could stabilize the support to some extent. The smaller Ru intensity could be also related with the presence of larger crystallites.
It is worth noting that the intensities of Ru signal observed for those samples prepared by photodeposition are similar to each other meaning that metal particles deposited on the surface are within the same size range. Based on the comparison of the Ru+/Ti+ ratio, it is possible to say that either Ru is more exposed
on the surface of TiO2 in the case of the catalysts with higher
Table 2. Normalized intensities of ions calculated on the basis of ToF-SIMS
spectra collected from the surface of catalysts prepared by the impregnation and the photodeposition method.
Ion intensities Sample Ru+/total+. × 10-2 Ru +/Ti+. × 10-1 Ca +/total+. × 10-2 CaRuO2+/total +. × 10-4 Ru/T500-I 1.3 1.8 - -Ru/1Ca-T500-I 1.2 1.8 3.8 1.3 Ru/5Ca-T500-I 1.9 6.1 14.0 3.9 Ru/10Ca-T500-I 2.0 7.1 13.0 4.4 Ru/20Ca-T500-I 2.1 8.0 18.0 3.0 Ru/T500-P 2.3 7.7 - -Ru/1Ca-T500-P 2.2 5.6 2.7 1.2 Ru/5Ca-T500-P 2.5 11 5.6 1.8 Ru/10Ca-T500-P 2.6 9.0 7.0 1.9 Ru/20Ca-T500-P 2.2 6.0 9.1 2.2
amount of Ca (5, 10 and 20%). This effect is more pronounced in the case of the catalysts prepared by impregnation.
Further, the intensities of the signal originating from Ca+ ion
confirmed that there is more Ca on the surface when a higher amount of Ca was used for the support preparation whatever the synthesis method. It is however important to note that generally the intensity of the signals coming from Ca+ are lower for the
samples prepared by photodeposition, indicating that Ca is less exposed on the catalyst surface. The presence of CaRuO2+ ion
confirms the existence of the interactions between the Ca-based phase and Ru, the intensity of the CaRuO2+ being globally
higher for Ca-rich catalysts whatever the preparation method.
Catalytic activity
The catalytic activity of the different materials was evaluated in the simultaneous FA decomposition and LA hydrogenation towards GVL (FALA). Figure 9 shows both liquid and gaseous products formed in the reaction using Ru catalysts prepared by impregnation. First, full decomposition of FA was achieved with all catalysts. Further, the Ca-modified Ru catalysts performed much better than Ru supported on bare sol-gel TiO2 and
commercial P25, with the highest LA conversion (38%) and the highest GVL yield (30%) obtained for Ru/5Ca-T500-I.
Figure 9. Catalytic activity of the Ru catalysts prepared by the impregnation
method in the FALA reaction, in terms of a) LA hydrogenation, FA decomposition and GVL yield ; and b) Gaseous product distribution.
When it comes to the distribution of gaseous products, expressed as vol%, it can be concluded that FA is decomposed most probably via two pathways, i.e. dehydration and dehydrogenation, leading to the formation of both CO and CO2.
Methane was also identified in the gas phase as a result of a secondary reaction (CO + 3H2 → CH4 + H2O). The higher
amount of CO detected in the case of Ru/5Ca-T500-I could be most probably explained by the fact that less CO remained
adsorbed on the catalyst surface. CO could be also consumed for the methane formation.
The catalysts prepared by the photodeposition method performed much better in the FALA reaction, while they exhibited the same trend in terms of LA conversion and GVL yield as their counterparts prepared by impregnation (Figure 10). The highest yield also occurred for Ru/5Ca-T500-P giving almost 50% of the final product, however this maximum was less pronounced than for the catalysts prepared by impregnation.
Whatever the Ru catalyst, negligible Ru leaching to the solution was observed, and Ru concentrations ranging from 0 to 0.34 ppm were released to the reaction mixture.
Figure 10. Catalytic activity of the Ru catalysts prepared by the
photodeposition method in the FALA reaction, in terms of a) LA hydrogenation, FA decomposition and GVL yield ; and b) Gaseous product distribution.
Further, since the catalysts were used in the reaction without any thermal reduction, it was interesting to check how they behave when additionally reduced in the same conditions than the ones prepared by impregnation. The reduced sample Ru/ 5Ca-T500-P showed much lower performance and two times lower LA conversion and GVL yield was achieved despite a full decomposition of formic acid. The distributions of gaseous products are quite similar to those obtained on their counterparts prepared by impregnation, meaning that two decomposition pathways of FA also took place. In all cases, formation of CH4
was evidenced. On one hand, the much higher volume of H2
recorded for Ru/5Ca-T500-P and Ru/10Ca-T500-P samples as well for Ru/P25-P could mean that a small Ru size improves the selectivity of FA decomposition, while by contrast the hydrogenation reaction was blocked by strongly adsorbed CO in this case.
The catalysts were also tested separately in both FA decomposition and LA hydrogenation (Figure 11 and 12) to evaluate in more details the influence of the Ca modification and
of the new preparation method in each step of the GVL synthesis.
Figure 11. Catalytic activity of the Ru catalysts prepared by a) impregnation
and b) photodeposition in the FA decomposition.
Compared to FALA reaction, similar trends were observed for both types of materials. In both separated reactions, the catalysts prepared by photodeposition led to higher catalytic performances compared to their counterparts prepared by impregnation, in terms of levulinic acid conversion and valerolactone yield in the LA hydrogenation, and of FA conversion with higher H2 production in the FA decomposition.
First, in FA decomposition (Figure 11) it was observed that the modification with Ca2+ improved the catalytic performance
forming a clear volcano-type profile for both series of Ru catalysts, with Ru/5Ca-T500 as the best materials.
Moreover, it was also shown that the selectivity to H2 of the FA
decomposition was improved using Ca-based catalysts prepared by impregnation (with less CO produced) compared to Ru/T500-I. On the other hand, the selectivity was not significantly changed in the case of catalysts prepared by photodeposition and remained similar to the Ca-based impregnated ones except for Ru/20Ca-T500 where quite a lot of CO was recorded. Figure 12 shows the results of LA hydrogenation for both series of catalysts. It is very important to notice that the modification with Ca has a positive effect in the case of the hydrogenation reaction as well. Again, the sample containing 5% of Ca allowed to reach the highest LA conversion and the highest GVL yield, whatever the preparation method.
Figure 12. Catalytic activity in terms of LA hydrogenation, FA decomposition
and GVL yield of the Ru catalysts prepared by a) impregnation and b) photodeposition in the LA hydrogenation with external H2.
Discussion
In this work, we investigated the influence of several factors (Ru particle size, support modification, novel synthesis method) on the hydrogenation of LA into GVL with FA as internal hydrogen source at low temperatures in water.
Focusing firstly on the Ru particle size effect it can be seen that for both P25 and T500 supported materials the GVL yield is higher when smaller Ru nanoparticles were tested meaning those prepared by the photodeposition method. (Figure 12a) Moreover it is worth noting that small Ru size is beneficial for both processes FA decomposition (Figure 12b) and LA hydrogenation (Figure 12c).
Figure 12. a) Influence of the Ru nanoparticle size on a) the GVL yield in
FALA, b) the FA decomposition and c) the GVL yield in LA hydrogenation with external hydrogen, for Ru catalysts prepared by impregnation and photodeposition.
The size effect in FA dehydrogenation was investigated using mainly Pd based catalysts, although the optimum size letting to obtain highest conversion of FA is still under the debate as depends also on the reaction conditions. Generally the smallest particles showed higher activity.Although in the work of Navlani‐ García et al. [42] the volcano type relationship with optimum
moderate Pd nanoparticle size of 3.9 nm was associated with the suitable proportion of low-coordinated (small particles) and high-coordinated (large particles) palladium atoms. The mechanism of the FA dehydrogenation on metals and metal oxides was proposed by Mars.[43] In the initial step formic acid is
adsorbed on the surface and donates a proton to the catalyst leading to the formation of formate intermediate.[44,45] Then the
metal-formate species undergo β-hydride elimination producing CO2 and the H- that forms H2 with previously adsorbed H+ on the
catalyst.[46-48] According to the work of Navlani-Garcia et al.
regarding the Pd catalysts the adsorption of HCOO- is favored
on the smaller NPs owing its high reactivity to a large number of unsaturated atoms. Therefore in our case it could be said that higher yield of FA decomposition achieved on smaller Ru supported on TiO2 is due to the larger proportion of unsaturated
low coordinated Ru atoms.
In case of LA hydrogenation the higher activity of smaller Ru nanoparticles is most probably attributed to the higher number of metal active sites available.[49,50] When we consider also Ru
particles supported on Ca-based supports a clear maximum of catalytic performance was observed with the NP of 1.5 nm being the most active in all reactions. Interestingly for the most active
catalyst Ru/5Ca-T500 the GVL yield dropped from ca. 50% to ca. 20% after reducing at 200oC which resulted in an increase in
nanoparticle size.
The optimal Ru particles size is however not the only factor responsible for reaching high activity. Comparing two samples Ru/1Ca-T500 and Ru/5Ca-T500 with almost the same Ru particle size (1.4 and 1.5 nm) the catalyst with 5% of Ca exhibited higher activity suggesting that addition of Ca2+ has a
crucial effect as well. Based on XRD results titania modification with Ca2+ resulted in decreased anatase crystallite size which
could favor the formation of smaller metal particles on the surface of the support.[51] However the role of calcium can not be
limited to the effect of the nanoparticle size. Ca2+ ions are
incorporated into the TiO2 crystal lattice together with the
formation of new calcium titanate phase. This in turn has an effect on the supported Ru nanoparticles which are interacting stronger with the support when the calcium content is increasing. This is well evidenced on TPR profiles for the catalysts prepared by the impregnation method as well as on CO-FTIR spectra with the presence of the band at 1980 cm-1
assigned to the adsorption of CO on Ru strongly interacting with the support. Another prove of Ru being in direct interactions with the Ca-modified support is given by ToF-SIMS. The presence of CaRuO2+ ions was identified for catalysts containing more Ca2+.
Changes in the metal-support interaction strength resulted in a change of the nature of CO molecule adsorption. Apparently for Ca-based materials the CO adsorption was lower which could be one reason for their generally better performance since CO could act as poison for the active metal centers.
Generally the better activity of the catalysts prepared by the photodeposition method could be explained by several factors with the smaller Ru nanoparticle size and their higher distribution being one of them.
The role of modification with Ca2+ is also strongly associated
with the increase in the concentration and strength of surface basic sites,[22,23] The presence of basic sites explains well the
improved catalytic performance of Ca-based catalysts in both reactions FA decomposition and LA hydrogenation despite the catalyst preparation method. Dehydrogenation of FA is facilitated by the presence of basic sites which act as a proton scavenger in O-H bond cleavage step.[13,52,53] On the other hand the
mechanism of improved catalytic performance in LA hydrogenation could be related to the activation of the carbonyl compound where basic sites would interact with π* orbital of C=O group.[54,55]
Conclusions
We have reported on the synthesis and application of novel Ca-modified TiO2 supported Ru catalysts in the hydrogenation of LA
towards GVL with FA as internal hydrogen source and water as green solvent. We developed a sustainable one-pot photo-assisted synthesis method that allowed to obtain TiO2 and
Ca-modified TiO2 supported Ru catalysts with enhanced catalytic
activity towards GVL production with FA as hydrogen source in comparison to the reference counterparts prepared by impregnation. This was possible owing to the formation of uniform, small and well-dispersed metal crystallites.
Further, we evidenced that the controlled modification of the TiO2 support by calcium addition improved the catalytic
performance in both the FA dehydrogenation step and the LA hydrogenation reaction. Such modification resulted in a decreased anatase crystallite size, together with the formation of
a new calcium titanate phase, leading to the stabilization of smaller ruthenium particles on the support. Stronger interaction of ruthenium with the support was observed, which affected the strength of CO adsorption on the surface of the Ca-modified catalyst, thus facilitating the reaction performance. Thanks to the newly develop method it was possible to control precisely the Ru nanoparticle size which in turn allowed to tune the size of Ru crystallites for the transfer hydrogenation reaction.
Experimental Section
Materials preparation
Support synthesis. Ca-modified TiO2 supports were synthesized according to a sol-gel method in basic conditions using titanium tetraisopropoxide (TTIP, 97%, Sigma–Aldrich) and calcium nitrate (Ca(NO3)2·4H2O, 99%, Sigma–Aldrich) as precursors. First, TTIP was
added to a 40 mL ethanolic solution of calcium nitrates, with calcium contents corresponding to 1, 5, 10 and 20 wt. % relatively to TiO2, before
a similar volume of water was added dropwise to solution. After rectification of the pH to 9 by adding ammonia (Carlo Erba, 30% aqueous solution), the solution was left under agitation at room temperature until dry paste was obtained. The resulting powder was further dried and finally calcined at 500°C in static air for 3 h with a heating rate of 5°C/min to form the Ca-TiO2 supports. A reference TiO2 support was synthesized
according to a similar sol-gel method in the absence of any calcium nitrate, and the resulting material after calcination at 500°C was labelled as T500.
Incipient wet impregnation. Ruthenium catalysts were prepared by
incipient wet impregnation from aqueous RuCl3 (Sigma-Aldrich, min 40%
Ru content) solutions on commercial TiO2 (Aeroxide© P25, Evonik), TiO2
prepared by sol-gel method (T500) and Ca-modified TiO2 supports to
obtain the 5wt. % of the Ru loading. The catalysts were then reduced for 1 h in hydrogen flow at 200°C and labelled as 5%Ru/P25-I, 5%Ru/T500-I and 5%Ru/Ca-T500-I.
Photodeposition. Ruthenium (III) chloride hydrate (RuCl3•xH2O, min
40% Ru content, Sigma-Aldrich) was used as ruthenium precursor salt for the catalyst preparation by the photodeposition method. RuCl3 was
dissolved under stirring in 100 ml of methanol for 12 h, prior to the addition of 900 ml of distilled water to give a methanol:water ratio of 1:9 v/v. Subsequently the TiO2 support was dispersed under stirring in 1 L of
ruthenium solution in a beaker-type glass reactor at a 1 g/L TiO2
concentration, and with a ruthenium precursor concentration corresponding to 5 wt. % of Ru relative to TiO2. After stirring for 1 h in the
dark, the pH was adjusted with NaOH to pH=8 before the suspension was subsequently stirred in the dark for another 1 h to ensure the establishment of the adsorption-desorption equilibrium prior to irradiation. The TiO2 suspension was further exposed under stirring to a 500 W/m2
solar light irradiation within an ATLAS Suntest XLS+ reaction chamber equipped with a Xenon arc lamp NXE 2201. At each time interval, 1 mL of solution was sampled and filtrated through a 0.20 µm porosity filter (Aireka Cells) to remove the TiO2 powder if any. The deposition was
followed by UV-vis spectrophotometry using a Cary 100 Scan Varian spectrophotometer monitoring the disappearance of the main absorption peak at λ=324 nm assigned to the RuCl3 precursor. After completion of
the process, the catalysts were recovered by filtration and dried at 100°C for 1 h. The catalysts were labelled as 5%Ru/P25-P, 5%Ru/T500-P and 5%Ru/Ca-T500-P.
Material characterisation
The surface area measurements have been carried out on a Micrometrics Tristar 3000 using N2 as adsorbent at −196°C with a prior
outgassing at 200°C overnight in order to desorb the impurities or moisture. The Brunauer-Emmett-Teller (BET) specific surface area and the total pore volume have been calculated from the N2 adsorption
isotherm.
Zeta Potential measurements were conducted on a Malvern Zetasizer NanoZS system with irradiation from a 632.8 nm He-Ne laser. The zeta-potential was determined from the measured electrophoretic mobility using the Smoluchowski approximation.
X-ray diffraction (XRD) patterns were recorded on a D8 Advance Bruker diffractometer in a θ/θ mode and using the Kα1 radiation of a Cu anticathode (λ = 1.5406 Å). The anatase mean crystallite size was calculated from the Scherrer equation applied with the usual assumption of spherical crystallites. Anatase cell parameters and cell volume were calculated using FullProf software.
Scanning electron microscopy (SEM) and elemental mapping was performed in secondary electron mode on a JEOL JSM-6700 F FEG microscope.
Temperature-programmed reduction (TPR) was performed on AMI1 system (Altamira Instruments) equipped with a thermal conductivity detector (TCD) and was used for examining the catalyst reducibility. The catalysts were submitted to H2/Ar (5:95 v/v) flow at a weight hourly space
velocity (WHSV) of 0.161 h-1 and using a heating rate of 10°C min-1. For
studying the catalyst reducibility, the TPR profiles were recorded after performing a slight in-situ oxidative treatment in air (200°C for 30 min) on the impregnated supports after a drying step, allowing the decomposition of the chloride precursor.
CO adsorption and desorption measurements were carried out with Nicolet 6700 FTIR spectrometer equipped with MCT detector made by Thermo Scientific, using transmission cell. Number of scans was chosen as 64 and spectral resolution was set as 4 cm-1. Before the
measurements, the samples were first reduced in H2 flow at 200°C for 1
h, before to be cooled down to 40°C in argon. Then carbon monoxide sorption was performed for 20 min and during this process spectra were collected every 5 min. After that time CO desorption was performed for 20 min in Ar flow. During desorption, spectra was collected every 2 minutes. Gas flow was set every time as 20 ml/min.
The Ru nanoparticle size distribution of Ru/TiO2 samples was determined
by transmission electron microscopy (TEM) performed using a JEOL 2100F with a point resolution of 0.2 nm. The samples were sonically dispersed in an ethanol solution before a drop of the solution was deposited onto a copper grid covered by a holey carbon membrane for observation. The size distributions were calculated for each nanoparticle sample by averaging 300 particles from the TEM images using ImageJ software. They were also characterized by the Full Width at Half Maximum (FWHM).
Time-of-flight secondary ion mass spectrometry (ToF-SIMS) measurements were performed using ION-TOF GmbH instrument (ToF-SIMS IV) equipped with a 25 kV pulsed Bi+ primary ion gun in static
mode. The samples were pressed into pellets before the measurements and attached to the sample holder using double-sided tape. The analyzed area corresponded to a 500 µm × 500 µm size square. For each sample, three spectra were collected. A pulsed electron flood gun was used for the charge compensation. Depth of the analysis did not exceed 1 nm, mass resolution at m/z=29 was in the range of 4000-7000. The samples were stored and transported in disposable containers for avoiding any contamination.
Atomic absorption spectroscopy (AAS) was used to determine the Ru concentration in the post-reaction mixtures using SOLAAR M6 Unicam Atomic Absorption Spectrometer.
Catalytic tests
Levulinic acid hydrogenation. In a typical levulinic acid (LA)
hydrogenation experiment, 1 g of LA, 0.15 g of catalyst and 30 ml of water were mixed in a stainless steel autoclave (Berghof, Germany), equipped with a Teflon insert allowing a reaction volume of 45 ml. The reactor was pressurized with H2 to 5 bar and the temperature was
was cooled down, the remaining pressure was released and the reaction mixture was centrifuged to separate the solid catalyst and the product solution.
Formic acid decomposition. In a typical experiment, 0.4 ml of formic
acid (FA), 0.15 g of reduced catalyst, and 30 ml of distilled water were mixed in a stainless steel autoclave (Berghof) equipped with a Teflon insert allowing a reaction volume of 45 ml. The reactor was flushed with H2 for 30 s and Ar for 15 s. The reactor was then heated to 190°C for 2 h.
LA hydrogenation with formic acid as a hydrogen source (FALA). In
a typical LA hydrogenation experiment, 1 g of LA, 0.4 ml of FA, 0.6 g of a catalyst and 30 ml of water were mixed in a stainless steel autoclave (Berghof) equipped with a Teflon insert allowing a reaction volume of 45 ml. The temperature was maintained at 190°C for 5 h. At the end of the reaction the reactor was cooled down, the remaining pressure was released and the reaction mixture was centrifuged to separate the solid catalyst and the product solution.
Reaction product analysis. The gaseous products were analyzed by
gas chromatography (VEB Chromatrom, Berlin) equipped with a TCD detector. Argon was used as the carrier gas with a flow rate of 15 ml min−1 and the injections were performed with a volume of 2 ml. The liquid
products were analyzed by high- performance liquid chromatography (Perlan) equipped with a refractive index detector and a Rezex ROA column, and 0.0025 mol dm−3 H2SO4 was used as an eluent.
Acknowledgements
The French Embassy in Poland is thanked for supporting the PhD work of J.W. via a French Government Grant. T. Dintzer (ICPEES, Strasbourg) and D. Ihiawakrim (IPCMS, Strasbourg) a r e a c k n o w l e d g e d f o r p e r f o r m i n g S E M a n d T E M characterization, respectively.
Keywords: platform molecules • 𝛾-valerolactone • Ru/Ca-TiO2
catalysts • photo-assisted preparation method • formic acid
(1) a) D. M. Alonso, S. G. Wettstein, J. A. Dumesic, Green Chem. 2013, 15, 584; b) W. Luo, M. Sankar, A. M. Beale, Q. He, C. J. Kiely, P. C. A. Bruijnincx, B. M. Weckhuysen, Nat. Commun. 2015, 6, 6540– 6549; c) A. M. Ruppert, K. Weinberg, R. Palkovits, Angew. Chem. Int. Ed. 2012, 51, 2564; Angew. Chem. 2012, 124, 2614.
(2) a) I. T. Horváth, H. Mehdi, V. Fábos, L. Boda, L. T. Mika, Green Chem 2008, 10, 238-242; b) J. P. Lange, R. Price, P. M. Ayoub, J. Louis, L. Petrus, L. Clarke, H. Gosselink, Angew. Chem. Int. Ed. 2010, 49, 4479-4483; Angew. Chem. 2010, 122, 4581-4585.
(3) W. Luo, U. Deka, A. M. Beale, E. R.H. van Eck, P. C.A. Bruijnincx, B. M. Weckhuysen, J Catal. 2013, 301, 175-186.
(4) C. Michel, J. Zaffran, A. M. Ruppert, J. Matras-Michalska, M. Jędrzejczyk, J. Grams, P. Sautet, Chem. Commun. 2014, 50, 12450-12453.
(5) J.P. Lange, Angew. Chem. Int. Ed. 2015, 54,13186 –13197
(6) A.M. Ruppert, J. Grams, M. Jedrzejczyk, J. Matras-Michalska, N. Keller, K. Ostojska, P. Sautet, ChemSusChem 2015, 8, 1538–1547. (7) Y. Kuwahara, W. Kaburagi, T. Fujitani, RSC Adv. 2014, 4, 45848–
45855.
(8) J. Tan, J. Cui, T. Deng, X. Cui, G. Ding, Y. Zhu, Y. Li, ChemCatChem
2015, 7, 508–512.
(9) W. Cao, W. Luo, H. Ge, Y. Su, A. Wang, T. Zhang, Green Chem. 2017, 19, 2201.
(10) C. Xu, W. Ouyang, M. J. Muñoz‐Batista, M. Fernández‐García, R. Luque, ChemSusChem 2018, 11, 2604 – 2611.
(11) G. Li, H. Yang, M. Cheng, W. Hu, L. Tian, W. Mao, R. Nie, Mol. Catal.
2018, 455, 95–102.
(12) M.-C. Fu, R. Shang, Z. Huang, Y. Fu, Synlett 2014, 25(19), 2748. (13) Q.-Y. Bi, X.-L. Du, Y.-M. Liu, Y. Cao, H.-Y. He, K.-N. Fan, J. Am. Chem.
Soc. 2012, 134, 8926.
(14) D. A. Bulushev, M. Zacharska, Y. Guo, S. Beloshapkin, A. Simakov, Catalysis Comm 2017, 92, 86-89.
(15) D. A. Bulushev, L. Jia, S. Beloshapkin, J. R. H. Ross, Chem Comm
2012, 48, 4184.
(16) V. S. Jaya, M. Sudhakar, S. N. Kumar, A. Venugopal, RSC Adv. 2015, 5, 9044.
(17) S. Cao, J. R. Monnier, C. T. Williams, W. Diao, J. R. Regalbuto, J Catal
2015, 326, 69-81.
(18) H. M Rietveld. J Appl Crystallography, 1967, 22, 151–152. (19) U.G.Akpan, B.H.Hameed, J Col Interface Sci 2011, 357, 168. (20) N. I. Al-Salim, S. A. Bagshaw, A. Bittar, T. Kemmitt, A. J. McQuillan, A.
M. Mills, M. J. Ryan, J. Mater. Chem. 2000, 10, 2358-2363. (21) W. Fu, S. Ding, Y. Wang, L. Wu, D. Zhang, Z. Pan, R. Wang, Z. Zhang,
S. Qiu, Dalton Trans 2014, 43, 16160.
(22) S. Scirè, C. Crisafulli, R. Maggiore, S. Minicò, S. Galvagno, Appl Surf Sci. 1998, 136, 311-320.
(23) C. Morterra, G. Magnacca, G. Cerrato, N. Del Favero, F. Filippi, C. V. Folonari, J. Chem. Soc. Faraday Trans. 1993, 89, 135.
(24) J. Wojciechowska, E. Gitzhofer, J. Grams, A. M. Ruppert, N. Keller, Catalysis Today, 2018, doi.org/10.1016/j.cattod.2018.07.013 (25) K. Wenderich, G. Mul, Chem. Rev. 2016, 116, 14587.
(26) S. Scirè, C. Crisafulli, S. Giuffrida, G. Ventimiglia, C. Bongiorno, C. Spinella, J of Molecular Cat A: Chemical 2010, 333, 100.
(27) X. Liu, J. Zeng, W. Shi, J. Wang, T. Zhu, Y. Chen, Catal. Sci. Technol.
2017, 7, 213.
(28) D. P. Debecker, B. Farin, E. M. Gaigneaux, C. Sanchez, C. Sassoye, Appl Catal A, 2014, 481, 11-18.
(29) L. Li, L. Qu, J. Cheng, J. Li, Z. Hao, Appl Catal B, 2009, 88, 224-231. (30) A. Carrero, J.A. Calles, A.J. Vizcaíno, Chem Eng J. 2010, 163,
395-402.
(31) K. Hadjivanov, J.-C. Lavalley, J. Lamotte, F. Mauge, J. Saint-Just, M.Che, J Catal. 1998, 176, 415-425.
(32) P. Panagiotopoulou, D. I. Kondarides, X. E. Verykios, J. Phys. Chem.
2011, 115, 1220-1230.
(33) A. M. Abdel-Mageed, D. Widmann, S.E. Olesen, I. Chorkendorff, J. Biskupek, R.J. Behm, ASC Catal. 2015, 5, 6753-6763.
(34) V. Mazzieri, F. Coloma-Pascual, A. Arcoya, P.C. L`Argentiere, N.S. Figoli, Appl Surf Sci. 2003, 210, 222-230.
(35) S. Scirè, C. Crisafulli, R. Maggiore, S. Minicò, S. Galvagno, Catal Lett.
1998, 51, 41-45.
(36) C. Elmasides, D.I. Kondarides, J. Phys. Chem. B. 1999, 103, 5227-5239.
(37) E. Guglielminotti, G.C. Bond, J. Chem. Soc. Faraday Trans. 1990, 86, 979-987.
(38) G. Blyholder, J Phys Chem. 1964, 68, 2772-2777.
(39) C. Elmasides, D.I. Kondarides, S.G. Neophytides, X. E. Verykios, J Catal. 2001, 198, 195-207
(40) P. Panagiotopoulou, D. I. Kondarides, Appl Catal B. 2011, 101, 738-746.
(41) A. M. Ruppert, T. Paryjczak, Appl. Catal. A 2007, 320, 80
(42) M. Navlani‐García, K. Mori, A. Nozaki, Y. Kuwahara, H. Yamashita, Chem Select 2016, 1, 1879
(43) P. Mars, J.J.F. Scholten, P. Zwietering, Adv Catal. 1963, 14, 35-113. (44) A. Masami, K. Kosaku, I.Toshinobu, T. Shiichiro, Bull Chem Soc Japan,
1966, 40, 1290-1292.
(45) a) M. Adachi, T. Imanaka, S. Teranishi, Nippon Kagaku Kaishi. 1968, 89, 446; Nippon Kagaku Kaishi 1969, 90, 348; Nippon Kagaku Kaishi
1970, 91, 400.
(46) M. Ojeda, E. Iglesia, Angew Chem Int Ed 2009, 48, 4800.
(47) S. Fukuzumi, T. Kobayashi, T. Suenobu, ChemSusChem 2008,1, 827. (48) S. Fukuzumi, T. Kobayashi, T. Suenobu, JACS 2010, 132, 1496. (49) M. Nemanashi, J.-H. Noh, R. Meijboom, Appl Catal A 2018, 550, 77-89. (50) D. R. Jones, S. Iqbal, P. J. Miedziak, D. J. Morgan, J. K. Edwards, Q.
He, G. J. Hutchings, Topics in Catal. 2018, 61, 833-843
(51) G. Li, H. Yang, M. Cheng, W. Hu, L. Tian, W. Mao, R. Nie, Mol Catal.
2018, 455, 95-102.
(52) K. Mori, M. Dojo, H. Yamashita, ACS Catal. 2013, 3, 1114. (53) M. Ai, J. Catal. 1977, 50(2) 291-300
(54) H. Liu, Q. Hu, G. Fan, L. Yang, F. Li, Catal. Sci. Technol. 2015, 5, 3960– 3969.
(55) Y. Zhang, S. Zhang, X. Pan, M. Bao, J. Huang, W. Shen, Catal Lett.
FULL PAPER
A new elegant photo-assisted method allowing the synthesis of uniform size and evenly distributed Ru particles on the titania surface was developed. Enhanced catalytic performance compared to the counterparts catalysts prepared by classical wet
impregnation were reached, and further exalted thanks to the support modification via the calcium introduction into the titania support.
Joanna Wojciechowska, Marcin Jędrzejczyk, Jacek Grams, Nicolas Keller,* Agnieszka M. Ruppert*
Page No. – Page No.
Enhanced production of
𝛾-valerolactone with internal source of hydrogen on Ca-modified TiO2