HAL Id: hal-00153399
https://hal.archives-ouvertes.fr/hal-00153399
Submitted on 25 Dec 2015
HAL is a multi-disciplinary open access
archive for the deposit and dissemination of
sci-entific research documents, whether they are
pub-lished or not. The documents may come from
teaching and research institutions in France or
abroad, or from public or private research centers.
L’archive ouverte pluridisciplinaire HAL, est
destinée au dépôt et à la diffusion de documents
scientifiques de niveau recherche, publiés ou non,
émanant des établissements d’enseignement et de
recherche français ou étrangers, des laboratoires
publics ou privés.
Radial variation of whistler-mode chorus:first results
from the STAFF/DWP instrument onboard the Double
Star TC 1 Spacecraft.
O. Santolik, E. Macúšová, K. H. Yearby, Nicole Cornilleau-Wehrlin, H. Stc.
K. Alleyne
To cite this version:
O. Santolik, E. Macúšová, K. H. Yearby, Nicole Cornilleau-Wehrlin, H. Stc. K. Alleyne. Radial
variation of whistler-mode chorus:first results from the STAFF/DWP instrument onboard the Double
Star TC 1 Spacecraft.. Annales Geophysicae, European Geosciences Union, 2005, 23 (8), pp.2937-2942.
�10.5194/angeo-23-2937-2005�. �hal-00153399�
© European Geosciences Union 2005
Geophysicae
Radial variation of whistler-mode chorus: first results from the
STAFF/DWP instrument on board the Double Star TC-1 spacecraft
O. Santol´ık1,2, E. Mac ´uˇsov´a1, K. H. Yearby3, N. Cornilleau-Wehrlin4, and H. StC. K. Alleyne31Faculty of Mathematics and Physics, Charles University, V Holeˇsoviˇck´ach 2, CZ-18000 Prague, Czech Republic 2also at: IAP, Czech Academy of Sciences, Boˇcn´ı II/1401, CZ-14131 Prague, Czech Republic
3University of Sheffield, Mappin Street, Sheffield, S1 3JD, UK 4CETP/IPSL, 10-12 Av. de l’Europe, F-78140 V´elizy, France
Received: 22 February 2005 – Revised: 12 June 2005 – Accepted: 6 June 2005 – Published: 8 November 2005 Part of Special Issue “Double Star – First Results”
Abstract. We use the first measurements of the STAFF/DWP
instrument on the Double Star TC-1 spacecraft to investigate whistler-mode chorus. We present initial results of a system-atic study on radial variation of dawn chorus. The chorus events show an increased intensity at L parameter above 6. This is important for the possible explanation of intensifica-tions of chorus, which were previously observed closer to the Earth at higher latitudes. Our results also indicate that the upper band of chorus at frequencies above one-half of the electron cyclotron frequency disappears for L above 8. The lower band of chorus is observed at frequencies below 0.4 of the electron cyclotron frequency up to L of 11–12. The max-ima of the chorus power spectra are found at slightly lower frequencies compared to previous studies. We do not observe any distinct evolution of the position of the chorus frequency band as a function of L. More data of the TC-1 spacecraft are needed to verify these initial results and to increase the MLT coverage.
Keywords. Magnetospheric physics (Plasma waves and
in-stabilities) – Space plasma physics (Waves and inin-stabilities) – Radio science (Magnetospheric physics)
1 Introduction
Whistler-mode chorus (Storey, 1953) is an electromagnetic wave emission occurring in the Earth’s magnetosphere. It often contains many distinct short-duration wave packets which change their frequency at time scales of a fraction of a second (see reviews by Sazhin and Hayakawa, 1992; Omura et al., 1991). The generation of these wave packets is not yet well understood. It is most often accepted that chorus is
Correspondence to: O. Santol´ık
generated by a nonlinear process (Nunn et al., 1997; Trakht-engerts, 1999), based on the electron cyclotron resonance of whistler-mode waves with energetic electrons (Kennel and Petschek, 1966), taking place close to the geomagnetic equa-torial plane (Burton and Holzer, 1974; LeDocq et al., 1998; Santol´ık et al., 2003; Parrot et al., 2003; Santol´ık et al., 2004, 2005). In its source region, chorus has been observed in two frequency bands (Burtis and Helliwell, 1976), separated by a (yet unexplained) narrow band of decreased intensity at one-half of the local electron cyclotron frequency (fce). The im-portance of chorus is reflected by the recent discussion on the acceleration of energetic electrons in the outer radiation belt (e.g. Meredith et al., 2003).
The purpose of the present paper is to show that the STAFF/DWP instrument on board the Double Star TC-1 spacecraft (Cornilleau-Wehrlin et al., 2005; Yearby et al., 2005) is well suited for the investigation of chorus and to present the first results of a systematic study on radial vari-ation of these emissions. The orbit of TC-1 has a low incli-nation of 28.5◦with an apogee of 13.3 Earth radii (RE). The spacecraft thus stays at low geomagnetic latitudes during its orbit. It is then able to observe the chorus emissions close to their anticipated source region, and scan their variation as a function of the geocentric radial distance. For investiga-tion of chorus, the TC-1 orbit is complementary to the orbit of the Cluster spacefleet which crosses the chorus source re-gion at a nearly constant radial distance of 4–5 RE and in a roughly perpendicular direction with respect to the geomag-netic equator (Escoubet et al., 1997).
Chorus is known to frequently occur on the dawn side (see Sazhin and Hayakawa, 1992, and references therein). The orbits of the Double Star TC-1 spacecraft in its initial oper-ational period were situated in this chorus-favorable sector. We could thus accumulate a number of observations, allow-ing us to investigate the radial evolution of chorus in a more
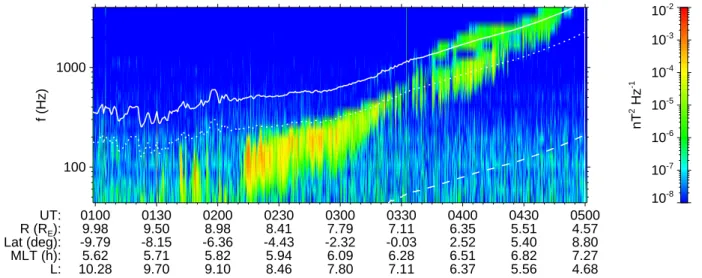
2938 O. Santol´ık et al.: Radial variation of whistler-mode chorus UT: 0100 0130 0200 0230 0300 0330 0400 0430 0500 R (RE): 9.98 9.50 8.98 8.41 7.79 7.11 6.35 5.51 4.57 Lat (deg): -9.79 -8.15 -6.36 -4.43 -2.32 -0.03 2.52 5.40 8.80 MLT (h): 5.62 5.71 5.82 5.94 6.09 6.28 6.51 6.82 7.27 L: 10.28 9.70 9.10 8.46 7.80 7.11 6.37 5.56 4.68 10-8 10-7 10-6 10-5 10-4 10-3 10-2 nT 2 Hz -1 100 1000 f (Hz)
Fig. 1. Power-spectral density spectrogram of the magnetic field fluctuations measured during an inbound orbit on 28 June 2004. The
over-plotted white lines reflect different fractions of the local fce. Solid line: fce/2; dotted line: fce/4; dashed line: fce/42.85 (approximation
for the lower hybrid frequency). Spacecraft position is given on the bottom: R-geocentric radial distance; MLat-magnetic dipole latitude; MLT-magnetic local time; McIlwain’s L parameter.
systematic way. In spite of the failure of the STAFF antenna boom to deploy, we were able to estimate the power spectra of dawn chorus at different radial distances, ranging from the average plasmapause position up to the regions close to the magnetopause. This is very important since, as the ray trac-ing studies indicate (Parrot et al., 2004), chorus can propa-gate to higher latitudes from source locations distributed in such a wide range of radial distances. Using the initial mea-surements of the TC-1 spacecraft, we address the important questions on the frequency band and relative intensity of cho-rus as a function of the geocentric radial distance.
In Sect. 2 we describe the data and show an example of chorus observations by the STAFF/DWP instrument on the TC-1 spacecraft. Section 3 presents our initial systematic analysis of the radial evolution of chorus; in Sect. 4 we dis-cuss the obtained average properties of selected cases and, finally, in Sect. 5 we summarize these first results.
2 Observations of chorus on board the TC-1 spacecraft
The Double Star TC-1 spacecraft is equipped with a three-axis search coil magnetometer STAFF which measures mag-netic fluctuations at frequencies between 0.1 Hz and 4 kHz (see Cornilleau-Wehrlin et al., 2005, for more details). The magnetometer signals are further processed by the Magnetic Wave Form (MWF) unit and by the Digital Wave Processor (DWP), which handles and formats the waveform data. At higher frequencies, the DWP unit also performs an onboard spectrum analysis, resulting in power spectra of the three components and their mutual phases in 27 frequency chan-nels between 20 Hz and 4 kHz. The data set for the present paper comes from this onboard spectrum analysis, obtained with a time resolution of 1 s. As discussed by Cornilleau-Wehrlin et al. (2005), the STAFF magnetometer boom failed
to deploy. As a consequence, the sensors are located close to the spacecraft body and the data are polluted by interference signals from the spacecraft systems. The received spectrum-analyzer data are therefore reprocessed using a noise reduc-tion algorithm which includes a procedure to synthesize the power spectra in a direction where continuous interference is minimum (see Cornilleau-Wehrlin et al., 2005). This proce-dure has been used to process our entire data set. We further average the data to a 4-s time resolution which is sufficient for this study and provides us with a better signal-to-noise ratio.
Figure 1 shows an example of chorus observed by the TC-1 spacecraft during an inbound orbit on 28 June 2004 be-tween 01:00 and 05:00 UT. The spacecraft is located close to the magnetic equatorial plane during the entire time interval. Intense chorus emissions are observed starting at ∼02:15 UT and persist until the end of the interval, constantly shifting their frequency band to higher frequencies. For compari-son, different fractions of the local fcehave been calculated using measurements of the onboard flux-gate magnetometer (Carr et al., 2005). At 02:15 UT, when the spacecraft is at large radial distances, chorus appears below one-quarter of the local fce. As the spacecraft moves closer to the Earth, around 04:00 UT, chorus becomes weaker and starts to oc-cupy frequency bands above and below one-half of the local
fce. We can identify a narrow gap of decreased power just below 12fce.
3 Initial results of a systematic analysis of chorus power spectra
A similar analysis has been performed for the data recorded between 13 January 2004 and 7 July 2004. We have visu-ally inspected the results and selected a set of 25 continuous
time intervals in 16 orbits where sufficiently intense chorus emissions have been identified. This limited set of data has been used in the subsequent analysis. It represents nearly 48 h of measurements containing approximately 42 000 indi-vidual spectra. Figure 2a shows spacecraft positions during these time intervals in polar coordinates, where McIlwain’s
Lparameter is represented as the radius and the magnetic lo-cal time is plotted as the polar angle. The selected chorus events are located in the morning sector, at L between 4 and 12.
Recent experimental studies based on Poynting flux and polarization measurements indicate that the dimension of the source region is a few thousands of km along the magnetic field lines (Santol´ık et al., 2003, 2004, 2005), and that its central position fluctuates around the geomagnetic equator. In Figure 2b we present the selected data set with respect to a coordinate s parallel to the magnetic field lines. This coordinate is defined as the arc length along the given field line measured from the geomagnetic equator, with the sign of the corresponding geomagnetic latitude. We have divided a larger interval of s around the equator into 5000-km bins and the histogram in Fig. 2b shows the observation time that the spacecraft spent during the selected events in each of these bins. The results indicate that most of these events have been recorded within several lengths of the source region from its expected position.
Each individual power spectrum obtained with a 4-s time resolution during these selected time intervals has been ex-pressed as a function of the normalized frequency f/fce. Here, f are the central frequencies of the 27 channels of the STAFF/DWF instrument. The local electron cyclotron fre-quency fce is obtained for each spectrum from the onboard measurement of the ambient magnetic field, averaged again to the same 4-s time resolution. A value of the L parameter has also been calculated for each spectrum from the actual spacecraft position.
The measured power-spectral densities have then been ac-cumulated in the L-frequency bins, where we have used 32 L intervals between 3 and 11, together with 25 f/fceintervals between 0.04 and 1.04. In each of these 32×25 bins we have calculated the mean value of the power-spectral density, based on the above described set of visually selected chorus events. We have calculated the mean values in separate bins using both arithmetic averages (in the linear scale) and geo-metric averages (in the logarithmic scale) of the accumulated power-spectral densities.
We have obtained qualitatively similar results from arith-metic and geometric averages and only the results for the arithmetic averages are shown in Fig. 3a, while Fig. 3b repre-sents the number of power-spectral-density data points which were accumulated in each bin. We can see that the num-ber of data points is highest at lower normalized frequencies. This is a consequence of the fact that the central frequen-cies of the 27 channels of the STAFF/DWF instrument are not evenly distributed on a linear scale. In fact, the chan-nels were chosen to be displaced approximately evenly on a logarithmic frequency scale, i.e. the intervals between the
0h 6h 18h 12h MLT → 4 6 8 10 L↓ (a) -20 -10 0 10 20 s (103 km) 0 2 4 6 8 10 12 14 Hours (b)
Fig. 2. Orbits of the TC-1 spacecraft during the selected chorus
events. (a) Polar plot represents portions of orbits (thick blue lines) as a function of McIlwain’s L parameter and the magnetic local time (MLT). (b) Histogram shows number of hours spent by the spacecraft during the selected chorus events at different distances from the geomagnetic equator. The distances are calculated as arc lengths along the magnetic field lines; negative values of s are used for observations at negative geomagnetic latitudes. The histogram bin size is 5000 km. Red rectangle represents expected position of the chorus source region.
central frequencies are narrower at lower frequencies. Con-sequently, more data points fall into the lowest bins of our linear scale of normalized frequencies. The white area on the top left is again an artifact connected to the upper fre-quency limit of the instrument (4 kHz), which is below the local fcewhen the spacecraft approaches the perigee at lower
Lvalues. The large numbers of data points at L between 6 and 11 reflect the distribution of the number of selected cho-rus cases as a function of L. Figure 3b shows that, except for the bins where the instrument does not measure at all (white area), the numbers of power-spectral density points in sepa-rate bins range from a few hundred to a few thousand. These high numbers indicate that the mean values shown in Fig. 3a have a very good statistical significance.
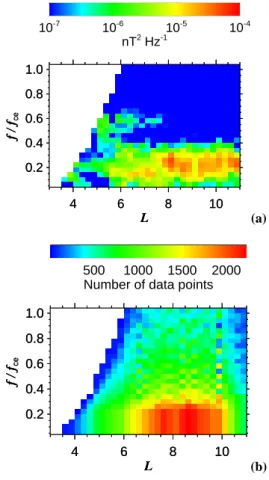
The resulting average power-spectral densities in Fig. 3 are largest for higher L (above ∼6–7). Intense chorus here generally occurs at normalized frequencies below f/fce=0.4, with no clear dependence of this upper limit on L. The maxi-mum power-spectral densities are then observed for f/fce be-tween 0.1 and 0.3. At lower L (below ∼8 but mainly around
L ∼5), a signature of the upper band of chorus appears above
f/fce=0.5. At L&8 this signature disappears and only the lower-band chorus remains.
2940 O. Santol´ık et al.: Radial variation of whistler-mode chorus 4 6 8 10 L 0.2 0.4 0.6 0.8 1.0 f / f ce 4 6 8 10 L 0.2 0.4 0.6 0.8 1.0 f / f ce 10-7 10-6 10-5 10-4 nT2 Hz-1 (a) 4 6 8 10 L 0.2 0.4 0.6 0.8 1.0 f / f ce 4 6 8 10 L 0.2 0.4 0.6 0.8 1.0 f / f ce 500 1000 1500 2000 Number of data points
(b)
Fig. 3. (a) Average power-spectral density spectrogram as a
func-tion of McIlwain’s L parameter and the wave frequency f normal-ized by the local fce. 42 000 individual spectra recorded during the
orbits from Fig. 2 have been accumulated. (b) Number of power-spectral density points used in each bin of Fig. 3a.
To verify the characteristic chorus frequencies, we have further selected a subset of spectra which were recorded at
L≥6 and which have their maxima above 10−4nT2Hz−1. In this subset of 4300 spectra, we have determined normalized frequencies where the individual spectra have their maxima. A histogram of these characteristic normalized frequencies is shown in Fig. 4. The result indicates a bimodal distribution with peaks at f/fceof ∼0.15 and ∼0.24. The main distribu-tion of these characteristic chorus frequencies is contained in an interval between 0.05 and 0.35 fce.
4 Discussion
The histogram in Fig. 4, showing a bimodal feature, should be taken as a very preliminary result. The data from only 16 orbits which are included in this study have a very lim-ited spatial coverage, and detailed features on the histogram might be strongly influenced by this limitation. A more com-prehensive study based on a larger data set is needed, and only a rough shape of the distribution of characteristic fre-quencies should be considered as a result of the present study.
0.0 0.1 0.2 0.3 0.4 f / fce 0 100 200 300 400 Number of spectra
Fig. 4. Histogram of normalized frequencies of maximum
power-spectral density for intense chorus events from Fig. 2 occurring at
L>6.
However, the histogram in Fig. 4 still gives lower characteris-tic frequencies compared to the results of the statischaracteris-tical study of Burtis and Helliwell (1976), who, using data measured in 1966–1967 by the OGO 3 spacecraft, found the peak of the distribution at a frequency close to 0.35 fce. Several possible reasons for this slight discrepancy can be found. First, our method to estimate the characteristic frequency is different from the method of Burtis and Helliwell (1976), who ana-lyzed separate chorus elements. Here we use only a rough procedure based on the maxima of averaged power spectra. This could induce a systematic difference in results. More importantly, we use the local fceto normalize the wave fre-quency. As the spacecraft orbit is not located exactly at the geomagnetic equator, the local fce is always slightly higher than fce which corresponds to the equatorial crossing of the same field line. This effect would move the peak of nor-malized frequencies to lower values. If it is confirmed by future detailed studies, it may, at least partially, explain the observed discrepancy. If the difference cannot be explained by these most likely reasons, it could also be indicative of a long-term variation in the statistical behavior of chorus waves, possibly related to the long-term variations in the magnetosphere connected with the particular phase of the so-lar cycle. A further analysis of this difference might thus be useful.
Another relevant past study is that of Koons and Roeder (1990), who analyzed broad-band VLF data of the SCATHA satellite during one year of operation in 1979–1980. They found chorus during more than 70% of the observation time in the dawn-noon sector at L= 5–8. They also analyzed the occurrence rate of the chorus emissions that displayed a frequency gap at 12fce. They found that these emissions generally followed the same spatial distribution as all chorus but with a reduced occurrence rate. The chorus without the gap was not associated with any upper-band emissions above
1
2fce. The limited data set in our present study does not al-low us to directly compare the results on occurrence rates. However, our Fig. 3a shows that the upper band emissions disappear from the average spectrogram of selected chorus
cases at L&8. This might still be consistent with the results of Koons and Roeder (1990), since their analysis is done be-low L<8. The absence (or strong attenuation) of chorus at frequencies above12fceat L above ∼8 thus needs to be veri-fied by further studies.
Concerning the lower-band chorus below 12fce, Fig. 3a shows that the average power spectrogram of selected chorus events shows a higher intensity at higher L above ∼6. Us-ing the results of ray-tracUs-ing studies (e.g. Parrot et al., 2004), this region can contain sources of chorus which subsequently propagate to higher latitudes and toward the Earth. These waves can be observed by polar orbiting spacecraft at lower radial distances, such as Cluster. If a further study based on a larger data set confirms these results, it could be possible to explain the intensifications of chorus at higher latitudes (e.g. Meredith et al., 2001) just by having more intense chorus generated close to the magnetic equator at higher L.
In Fig. 3a, the lower band of chorus does not show any clear variation of its characteristic frequency band as a func-tion of L in the interval from L∼5 up to L∼11–12. This, together with the observed absence of the upper-band cho-rus at L&8, might be an important test for existing nonlinear
theories on chorus generation (e.g. Trakhtengerts, 1999).
5 Conclusions
We have demonstrated that the measurements of the STAFF/DWP instrument on board the Double Star TC-1 spacecraft are a good tool for the investigation of whistler-mode chorus. We have presented the initial results of a sys-tematic study on the radial variation of dawn chorus emis-sions. The TC-1 orbit is especially favorable for this investi-gation since the spacecraft scans a large range of geocentric radial distances, while staying close to the magnetic equato-rial plane where the source region of chorus is expected.
The most important result is a higher intensity of chorus at L above ∼6, shown on the average power spectrogram ob-tained from selected chorus events. The lower band of chorus below 12fce is observed to be contained at frequencies be-low 0.4 fce up to L of 11–12. The maximum power-spectral densities are found in an interval between 0.05 and 0.3 fce, i.e. at slightly lower frequencies compared to previous statis-tical studies. No clear evolution of the position of this band is observed as a function of L. The signature of the upper band of chorus above12fceis absent in the average spectrogram of selected chorus cases at L&8.
Further chorus studies based on more data of the TC-1 spacecraft are needed to verify these first results. The MLT coverage presented here was limited to the morning sector. Future observations on the nightside will be especially inter-esting, because of the importance of the nightside storm-time chorus for the dynamics of energetic electrons in the outer radiation belt. Simultaneous measurements of the Cluster spacefleet and the TC-1 spacecraft will also be very inter-esting since they open the possibility to observe the same chorus emissions in their source region at higher L by TC-1
and also by Cluster, after they propagated to higher latitudes toward the Earth.
Acknowledgements. The Double Star TC-1 STAFF/DWP
experi-ment was funded by ESA. We thank C. Carr and the FGM team for the use of the flux-gate magnetometer data. This work was supported by the ESA PECS contract No. 98025 and by grants GACR202/03/0832 and 1P05ME811.
Topical Editor T. Pulkkinen thanks U. S. Inan and another ref-eree for their help in evaluating this paper.
References
Burtis, W. J. and Helliwell, R. A.: Magnetospheric chorus: Occur-rence patterens and normalized frequency, Planet. Space Sci., 24, 1007–1024, 1976.
Burton, R. K. and Holzer, R. E.: The origin and propagation of chorus in the outer magnetosphere, J. Geophys. Res., 79, 1014– 1023, 1974.
Carr, C. M., Brown, P., Zhang, T. L., et al.: The Double Star mag-netic field investigation: overview of instrument performance and initial results, Ann. Geophys., 23, 2713–2732, 2005. Cornilleau-Wehrlin, N., Alleyne, H., Yearby, K. H., et al.: The
STAFF-DWP wave instrument on the DSP equatorial spacecraft: description and first results, Ann. Geophys., 23, 2785–2801, 2005.
Escoubet, C. P., Schmidt, R., and Goldstein, M. L.: Cluster – Sci-ence and Mission Overview, Space SciSci-ence Reviews, 79, 11–32, 1997.
Kennel, C. F. and Petschek, H. E.: Limit on stable trapped particle fluxes, J. Geophys. Res., 71, 1–28, 1966.
Koons, H. C. and Roeder, J. L.: A survey of equatorial magneto-spheric wave activity between 5 and 8 RE, Planet. Space. Sci.,
38, 1335–1341, 1990.
LeDocq, M. J., Gurnett, D. A., and Hospodarsky, G. B.: Chorus source locations from VLF Poynting flux measurements with the Polar spacecraft, Geophys. Res. Lett., 25, 4063–4066, 1998. Meredith, N. P., Horne, R. B., and Anderson, R. R.: Substorm
de-pendence of chorus amplitudes: Implications for the accelera-tion of electrons to relativistic energies, J. Geophys. Res., 106, 13 165–13 178, 2001.
Meredith, N. P., Cain, M., Horne, R. B., Thorne, R. M., Summers, D., and Anderson, R. R.: Evidence for chorus-driven electron acceleration to relativistic energies from a survey of geomag-netically disturbed periods, J. Geophys. Res., 108(A6), 1248, doi:10.1029/JA009764, 2003.
Nunn, D., Omura, Y., Matsumoto, H., Nagano, I., and Yagitani, S.: The numerical simulation of VLF chorus and discrete emissions observed on the Geotail satellite using a Vlasov code, J. Geo-phys. Res., 102, 27 083–27 097, 1997.
Omura, Y., Nunn, D., Matsumoto, H., and Rycroft, M. J.: A review of observational, theoretical and numerical studies of VLF trig-gered emissions, J. Atmos. and Terr. Phys., 53, 351–368, 1991. Parrot, M., Santol´ık, O., Cornilleau-Wehrlin, N., Maksimovic, M.,
and Harvey, C.: Source location of chorus emissions observed by Cluster, Ann. Geophys., 21, 473–480, 2003,
SRef-ID: 1432-0576/ag/2003-21-473.
Parrot, M., Santol´ık, O., Gurnett, D., Pickett, J., and Cornilleau-Wehrlin, N.: Characteristics of magnetospherically reflected chorus waves observed by CLUSTER, Ann. Geophys., 22, 2597–
2942 O. Santol´ık et al.: Radial variation of whistler-mode chorus
2606, 2004,
SRef-ID: 1432-0576/ag/2004-22-2597.
Santol´ık, O., Gurnett, D. A., Pickett, J. S., Parrot, M., and Cornilleau-Wehrlin, N.: Spatio-temporal structure of storm-time chorus, J. Geophys. Res., 108, 2003.
Santol´ık, O., Gurnett, D. A., Pickett, J. S., Parrot, M., and Cornilleau-Wehrlin, N.: A microscopic and nanoscopic view of storm-time chorus on 31 March 2001, Geophys. Res. Lett., 31(2), L02801, doi:10.1029/2003GL018757, 2004.
Santol´ık, O., Gurnett, D. A., Pickett, J. S., Parrot, M., and Cornilleau-Wehrlin, N.: Central position of the source region of storm-time chorus, Planet. Space Sci., 53, 299–305, 2005.
Sazhin, S. S. and Hayakawa, M.: Magnetospheric chorus emissions: A review, Planet. Space Sci., 40, 681–697, 1992.
Storey, L. R. O.: An investigation of whistling atmospherics, Phil. Trans. Roy. Soc. London, A246, 113–141, 1953.
Trakhtengerts, V.: A generation mechanism for chorus emission, Ann. Geophys., 17, 95–100, 1999,
SRef-ID: 1432-0576/ag/1999-17-95.
Yearby, K. H., Alleyne, H., Cornilleau-Wehrlin, N., et al.: Obser-vations of lion roars in the magnetosheath by the STAFF/DWP experiment on the Double Star TC-1 spacecraft, Ann. Geophys., 23, 2861–2866, 2005.