HAL Id: hal-00295545
https://hal.archives-ouvertes.fr/hal-00295545
Submitted on 9 Nov 2004
HAL is a multi-disciplinary open access
archive for the deposit and dissemination of
sci-entific research documents, whether they are
pub-lished or not. The documents may come from
teaching and research institutions in France or
abroad, or from public or private research centers.
L’archive ouverte pluridisciplinaire HAL, est
destinée au dépôt et à la diffusion de documents
scientifiques de niveau recherche, publiés ou non,
émanant des établissements d’enseignement et de
recherche français ou étrangers, des laboratoires
publics ou privés.
aerosol scheme 1: comparison with UK PM10 data
K. M. Emmerson, A. R. Mackenzie, S. M. Owen, M. J. Evans, D. E. Shallcross
To cite this version:
K. M. Emmerson, A. R. Mackenzie, S. M. Owen, M. J. Evans, D. E. Shallcross. A Lagrangian model
with simple primary and secondary aerosol scheme 1: comparison with UK PM10 data. Atmospheric
Chemistry and Physics, European Geosciences Union, 2004, 4 (8), pp.2161-2170. �hal-00295545�
Atmos. Chem. Phys., 4, 2161–2170, 2004 www.atmos-chem-phys.org/acp/4/2161/ SRef-ID: 1680-7324/acp/2004-4-2161
Atmospheric
Chemistry
and Physics
A Lagrangian model with simple primary and secondary aerosol
scheme 1: comparison with UK PM
10
data
K. M. Emmerson1, A. R. MacKenzie2, S. M. Owen2, M. J. Evans3, and D. E. Shallcross4
1Environment Department, University of York, YO10 5DD, UK 2Dept. of Environmental Science, Lancaster University, LA1 4YQ, UK 3Harvard University, Cambridge, MA 02138, USA
4School of Chemistry, University of Bristol, BS8 1TS, UK
Received: 24 February 2004 – Published in Atmos. Chem. Phys. Discuss.: 15 June 2004 Revised: 13 September 2004 – Accepted: 5 November 2004 – Published: 9 November 2004
Abstract. A Lagrangian trajectory model used to simulate
photochemistry has been extended to include a simple pa-rameterisation of primary and secondary aerosol particles. The model uses emission inventories of primary particles for the UK from the NAEI (National Atmospheric Emissions In-ventory for the UK), and for Europe from the TNO (Institute of Environmental Sciences, Energy Research and Process In-novation, the Netherlands) respectively, to transport tracers representing PM10. One biogenic and two anthropogenic
or-ganic compounds were chosen as surrogates to model the for-mation of condensable material suitable for the production of secondary organic aerosol (SOA). The SOA is added to the primary PM10and compared to measured PM10at one urban
and two rural UK receptor sites. The results show an average under-prediction by factors of 4.5 and 8.9 in the urban and rural cases respectively. The model is also used to simulate production of two secondary inorganic species, H2SO4 and
HNO3, which are assumed, as a limiting case, to be present
in the particle phase. The relationships between modelled and measured total PM10improved with the addition of
sec-ondary inorganic compounds, and the overall model under-prediction factors are reduced to 3.5 and 3.9 in the urban and rural cases respectively. Nevertheless, our conclusion is that current emissions and chemistry do not appear to provide sufficient information to model PM10 well (i.e. to within a
factor of two). There is a need for further process studies to inform global climate modelling that includes climate forc-ing by aerosol.
Correspondence to: K. M. Emmerson
1 Introduction
Many previous studies of aerosol particles, and especially of secondary aerosol, have focussed on sulphates (IPCC, 2001), while little is known about the behaviour of organic com-pounds with regard to particulate production and their effects on climate change. Organic compounds are usually the most important component, after sulphate, of the smaller size frac-tion of aerosol particles in the troposphere (Heintzenberg, 1989). It is possible that organic aerosol particles are able to produce a similar (but opposite in sign) radiative effect to that produced by sulphate aerosol particles (IPCC, 2001).
Most aerosol particles are assumed to be composed of a mixture of materials, incorporating both the solid and liq-uid phases. Particles that are directly emitted (as a direct product of combustion, for example) are termed primary par-ticles. Particles are also produced from reactions between gases, which yield products sufficiently involatile to parti-tion between the gas and particle phases. Particles formed in this way are termed secondary particles.
CiTTyCAT is a Lagrangian box model that simulates the chemical processes in the atmosphere (Evans et al., 2000). It was developed to reproduce the processes affecting the pro-duction and lifetime of relatively short-lived species such as ozone. The original chemistry scheme used volatile organic compounds (VOCs) from C2 to C7 (e.g. toluene, C7H8).
We have extended CiTTyCAT to include an aerosol module, incorporating primary particles together with the contribu-tion of secondary organic aerosol (SOA) from anthropogenic and biogenic sources, and secondary inorganic aerosol (SIA) from sulphuric and nitric acids.
It has been estimated that 80% of the total SOA produced from aromatic compounds in Europe results from reactions with gas phase toluene, p-xylene and ethylbenzene (Derwent and Malcolm, 2000; Odum et al., 1997). Xylene and toluene
do not have reasonably well established reaction mechanisms (e.g. Calvert et al., 2002), yet have produced condensable material within a smog chamber environment (Pandis et al., 1992). Jenkin (1996) has also published an oxidation scheme for α-pinene that includes the formation of biogenic condens-able material. The importance of biogenic compounds in the production of SOA is discussed in Pandis et al. (1991), Hoff-mann et al. (1997), Christoffersen et al. (1998) and Hallquist et al. (1999).
2 Model treatment of particulate matter
2.1 Primary particles
The TNO provide European emissions of anthropogenic pri-mary PM10that cover the whole of Europe on a 0.5◦×1◦grid
(TNO, 1997). There is a weekday-to-weekend variation in the emissions, based on 20% less mass being emitted at the weekend than during the working week (pers. comm., TNO). As yet, no seasonal cycle has been implemented. Central and Eastern Europe dominate the TNO emissions, which is due to the concentration of heavy industry in that region (ApSimon et al., 2001). A second PM10 inventory from the NAEI has
been nested within the TNO inventory, covering the United Kingdom (including Northern Ireland) on a 1×1 km grid for 1996.
The primary PM10 is treated as an inert species, and no
chemistry occurs. Dry deposition applies, and is based on gravitational settling via Stoke’s law, assuming that all parti-cles have a diameter of 10 µm. We choose the maximum size for all PM10particles because the mass distribution is
domi-nated by the largest particles. We show below that the model results are not very sensitive to the deposition rate and, hence to the assumed particle size. For a particle of 10 µm diame-ter with a deposition rate of 0.6 cm s−1, this has a lifetime of approximately 2 days within a 1 km boundary layer. There is no treatment for wet deposition.
2.2 Anthropogenic and biogenic emission rates
Non-methane VOC emission rates from the EMEP 50×50 km grid for 1998 (available from http://www.emep. int) have been speciated using estimates from the Pho-tochemical Oxidant Review Group (PORG, 1997). This method of splitting the total NMVOC emission rate has been compared to the NAEI’s 50 most abundantly emit-ted compounds in Great Britain (the latest, year 2000 ver-sion available at http://www.naei.org.uk/) and found to con-tain similar species. From a total NMVOC emission rate of 94.5×10⁶kg yr−1, the available species within CiTTy-CAT received 50% of this total. Xylene and ethylbenzene both have the formula C8H10 and a molecular weight of
106 g mol−1, thus are included as a lumped xylene com-pound. The atmospheric chemistry of xylene and ethylben-zene are similar (Atkinson, 2000), and a single generalised
reaction scheme suffices for both compounds. The lumped xylene compound and toluene are initialised with a concen-tration of 0 ppb.
Biogenic compounds are not included in the PORG report (1997) speciation estimate, and are treated separately. Pre-vious modelling studies (e.g. Derwent and Malcolm, 2000) have used the Guenther et al. (1995) Global algorithm and the Simpson et al. (1999) European algorithm. The algorithms generate inventories of isoprene and monoterpene emission rates, based on land cover, land use information and meteo-rology. However, a recent study (Stewart et al., 2003) showed that monoterpene emission rates for Great Britain have been over-estimated by a factor of 2 by Guenther et al. (1995), and under-estimated by a factor of 2 by Simpson et al. (1999). Stewart (2001) completed a data-based study of all isoprene and monoterpene emitting vegetation in Great Britain at a resolution of 1 km2. As these data were not available as a spatially dis-aggregated dataset at the time of writing, it is as-sumed for the purposes of this modelling study, that α-pinene is emitted constantly over every cm2of Great Britain, i.e. as-suming an even distribution of vegetation. The proportion of monoterpenes emitted as α-pinene in the model is estimated to be 50%. This is a higher estimate than Griffin et al. (1999) who estimate that 35% of global monoterpene emissions are attributed to α-pinene. It should be noted that the model re-sponse to increasing emissions is linear (see Sect. 4). The
α-pinene emission rate is seasonally adjusted to emit 50% more mass in summer than in winter (Stewart, 2001), as the monoterpene flux is dependent on temperature (Dement et al., 1975). The majority of monoterpene-emitting vegetation in Great Britain is not light dependent, but this is not true of species native to the European continent (Owen et al., 2002; Schuh et al., 1997). Air parcels traversing over the European continent receive twice the UK average emission rate for α-pinene, to account for higher emissions in Europe that are due to greater afforestation and higher temperatures (Simp-son et al., 1999). For the purposes of the simplified scheme presented here, light dependency of monoterpene emissions is not included and α-pinene is emitted throughout the night. The European TNO grid provides the land mask for estimat-ing the location of α-pinene emissions.
It is recognised that a large (∼50%) proportion of the total PM10 mass could be composed of SIA. HNO3 and H2SO4
are inorganic secondary species produced from the chemical reactions of NO2 and SO2, respectively, and both schemes
are represented in CiTTyCAT (see below). Emissions of NO2
and SO2 are supplied from the EMEP 50×50 km grid for
1998.
2.3 Organic chemistry
The SOA chemical scheme is described in detail in a report by Jenkin (1996) and has since been re-developed as part of the wider Master Chemical Mecha-nism available at http://www.chem.leeds.ac.uk/Atmospheric/
K. M. Emmerson et al.: Comparison with UK PM10data 2163
MCM/mcmproj.html (Jenkin et al., 2003 and Saunders et al., 2003). The reaction mechanisms for the lumped xylene compound and toluene are very similar, in that the parent gas-phase products react only with OH. Reactions with O3
and NO3are not significant in this scheme due to the slow
reaction rates. The condensable product from the toluene scheme, “TOLY”, represents all C7nitrocresols and hydroxy
nitrocresols. TOLY, whilst being subject to dry deposition, is also lost chemically through oxidation by OH and NO3.
Another model parameter, “LMXYLY”, represents all C8
ni-trocresols and hydroxy nini-trocresols from the lumped xylene scheme, and will produce more condensable product than TOLY due to faster reaction rates.
The biogenic compound, α-pinene, reacts with OH, NO3
and O3, producing pinonaldehyde in all cases as the second
product. The condensable product, represented here as the “secondary biogenic component”, is a carboxylic acid pos-sibly related to pinonic acid (C10H16O3), and has been
as-signed a molecular weight of 184 g mol−1. The secondary biogenic component is produced through the reaction of α-pinene with O3in 2 steps, or in 4 steps via the reaction with
OH and NO3. The reaction with OH is the fastest however,
and is the more favoured reaction pathway. 2.4 Inorganic chemistry
Nitric acid, HNO3is formed via the reaction of O3and NO2,
and reaction of OH with NO2.
NO2+O3−→NO3+O2 (1)
NO3+NO2(+M) ↔ N2O5(+M) (2)
N2O5+H2O −→ 2HNO3 (3)
OH + NO2(+M) −→ HNO3(+M) (4)
The rate of removal of N2O5 to produce HNO3 is
vari-able, and may take a few minutes in urban areas, but can be of the order of a few hours in remote regions (PORG, 1997 and references therein). HNO3can produce NOx(NO+NO2)
and OH through very slow photolysis reactions, but the over-all reaction direction favours HNO3 as a sink for the NO3
species. HNO3is a semi-volatile inorganic compound, which
is able to partition between the gas and particle phases. Once in the particle phase, HNO3can be removed from the
atmo-sphere permanently through aerosol depositional processes, but it will also deposit very rapidly in the gas phase. Sul-phuric acid, H2SO4, is involatile and always present in the
particle phase. H2SO4is produced through oxidation of
sul-phur dioxide, SO2, which is emitted ubiquitously through
both anthropogenic and natural sources.
SO2+OH(+M) −→ HSO3(+M) (5)
HSO3+O2−→SO3+HO2 (6)
SO3+H2O(+M) −→ H2SO4(+M) (7)
There are other routes for SO2 oxidation (Calvert et al.,
1978) and N2O5hydrolysis (Jacob, 2000) in the liquid phase,
which are also not considered here. There are many un-certainties with regard to the uptake parameters in hetero-geneous chemical modelling (e.g. DeMore et al., 1994). 2.5 Transfer of condensable material to the particle phase For any condensable material, once saturation in the gas phase is exceeded, equilibrium with the vapour is re-established by converting a portion equal to the concentration in excess of saturation into the particle phase (Pandis et al., 1992). This process only increases the size of existing parti-cles and does not lead to the nucleation of a new particle, as this involves surmounting a critical energy barrier. The con-densation of material into the particle phase does not require any additional energy. If particles exist, and the gas phase concentration becomes less than the vapour pressure, equilib-rium is reached again through evaporation from the particle surface into the gas phase. If the saturation concentration in the gas phase is greater than the total concentration available in the particle phase, then the particle will evaporate com-pletely and leave a particulate mass of zero. This may occur if the emission rate into the gas phase is suddenly reduced, for example, if the air parcel travels from the land out over the sea. Evaporation can also occur if the temperature of the air parcel increases, thus increasing the compound vapour pressure. The saturation vapour pressure also depends on the composition of the condensed phase material, especially when a mixture is present (not treated in CiTTyCAT).
It is assumed that both anthropogenic condensable gas phase products LMXYLY and TOLY have the same vapour pressure, VP (Torr), which is dependent on temperature (Eq. 8; Jenkin, 1996). The vapour pressure of the secondary biogenic component is treated separately (Eq. 9).
log10(VP) = −3.25 − 1450 T (8) log10(VP bio) =15.94 − 7141 T (9)
These vapour pressures are towards the upper limit of what might be expected for the partitioning of the semi-volatile into an organic solid-solution. An examination of the model sensitivity to Vp = 0 is dealt with in a subsequent paper (Emmerson et al., 2004, in preparation1) and produced on average, 50% more SOA mass. However, with total mod-elled SOA mass concentrations below 1 µg m3, partitioning all condensable material into the particle phase did not im-prove the overall modelled case significantly.
1Emmerson, K. M., MacKenzie, A. R., and Owen, S. M.:
De-velopment of a secondary organic aerosol module 2: Application to Europe, in preparation, 2004.
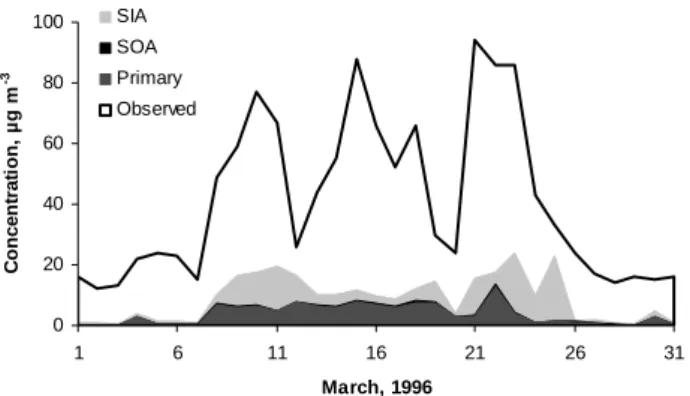
0 20 40 60 80 100 1 6 11 16 21 26 31 March, 1996 C onc e n tr a ti on, µg m -3 SIA SOA Primary Observed
Fig. 1. Time series to show the modelled contribution of SIA, SOA
and primary PM10 to the measured PM10 concentrations at New-castle during March 1996.
Partitioning does not occur in CiTTyCAT for HNO3 and
H2SO4 because it is assumed that all condensable material
will immediately convert into the particle phase, and no par-titioning will be necessary. In real terms, H2SO4is always
present in the particle phase, whilst HNO3 is semi-volatile
and present in both gas and particle phases simultaneously. Usually particle phase HNO3 is associated with the liquid
phase, and is only found in dry aerosol if ammonia is present (Hewitt, 2001 and references therein). However, there is no ammonia present in the model and it is not known what frac-tion of HNO3 is present in the gas phase at any particular
time.
The total mass concentration of particles produced from these new schemes will be added to the concentration of modelled primary PM10. A dry deposition rate of 0.2 cm s−1
is assigned for the SOA and SIA, equivalent to smaller par-ticles with diameters of 0.1 µm (or PM0.1)and a density of
1.6 g cm−3. This is equivalent to an atmospheric residence time of just under 6 days in a 1 km boundary layer.
3 Model receptor sites
The model follows 3-dimensional, 4-day back trajectories. These are supplied by the British Atmospheric Data Cen-tre (BADC) trajectory service, which is available on-line at http://www.badc.rl.ac.uk. 4 trajectories per day were used ending at midnight, 6 am, 12 noon and 6 pm. As the mea-surements were provided as 24 h averages the modelled data was averaged to provide 1 data point per day. All trajecto-ries are calculated using 3-D advection to end at 950 mbars (∼530 m), which usually avoids the problem of air parcel trajectories intersecting the surface and terminating early. As the model assumes that emissions are mixed homoge-neously through the height of the boundary layer (which can reach heights of 2 km), calculating the transport at a height of 530 m is reasonable. Boundary layer heights are taken from an assimilation of data from the GEOS 1
meteorologi-cal satellite, which is archived on a 2.5◦longitude by 2◦ lati-tude grid (Schubert et al., 1993). The data within this grid is assumed to be sufficient to account for all time periods, and therefore does not restrict the use of CiTTyCAT to a particu-lar time for which satellite data was available.
The urban receptor site chosen for this study is Newcas-tle, in the north east of the UK (1.60◦W, 55.0◦N) for the months of March and July 1996. These months were chosen to complement the study of particulate sulphates by Malcolm et al. (2000). The Newcastle site is a “background urban” site, 30 m from the nearest road. Two rural sites, Narberth in west Wales (4.75◦W, 51.75◦N) and Rochester in east Kent (0.55◦E, 51.40◦N), are also analysed for March 1998. Aver-age PM10at Rochester was half of that at Newcastle during
this month. This was a month with little rainfall and is more appropriate for the processes studied here (recall that there is no treatment for wet deposition). Since the PM10signal is the
sum of primary and secondary, carbonaceous and inorganic fractions, it is convenient to have a benchmark aerosol com-position in mind, in order to assess qualitatively how the var-ious parts of the model are performing. Urban and rural mea-surements in Europe (e.g. Kuhlbusch et al., 1999; Zappoli et al., 1999; Harrison et al., 1997) suggest that the total organic fraction (primary and secondary carbon) is a maximum of 40% of total PM10, and the secondary inorganic fraction a
further 50%, the majority of which is composed of sulphate. Other secondary inorganic species are not accounted for in this study, particularly ammonium and chloride, and could provide the remaining 10%. There were no clear patterns be-tween urban and rural sites to suggest that primary/secondary ratio is much larger at urban locations. Emmerson (2002) provides a detailed explanation of how these estimates are made. Below, we will refer to these broad composition frac-tions as the expected mass percentages. This does not mean that we believe the composition of the aerosol is constant in time and space, but rather that the expected composition provides a rough guide to which parts of the model are per-forming well. These expected mass percentages allow us to calculate model under-prediction factors, which are the fac-tors by which the model under-predicts not the whole ob-served mass, but just that part of the whole mass that the model might be expected to under-predict. The total mod-elled time series mass concentrations were then compared to the total measured PM10 mass concentrations at each site,
taken from the NETCEN automated network (available at http://www.airquality.co.uk).
3.1 Urban Newcastle site, March 1996
Figure 1 shows the addition of the modelled SOA and SIA contributions to primary PM10. Three relationships are
ob-tained from the modelled and measured data and shown in Table 1. The first shows the linear correlation between con-centrations of primary PM10 with the observed PM10
K. M. Emmerson et al.: Comparison with UK PM10data 2165
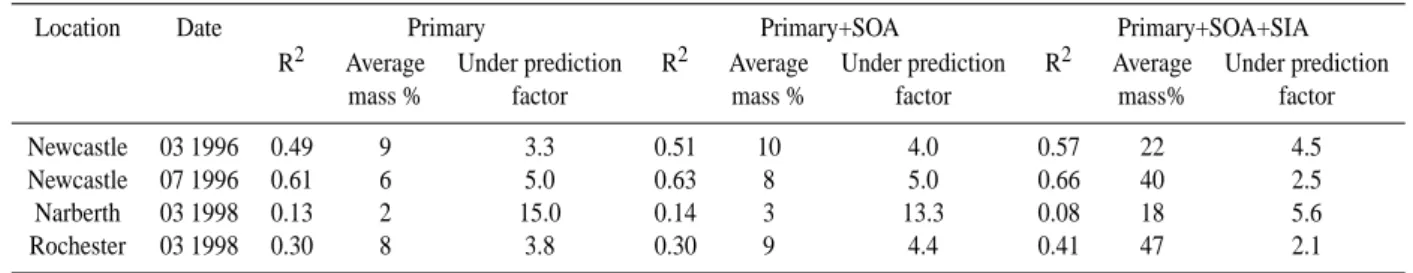
Table 1. Coefficients of determination, average mass percentages and model under-prediction factors in the modelled species for each of
the receptor sites studied here. Under-prediction factor calculations are based on assumed aerosol compositions of 30% primary PM10, 40%
primary PM10+SOA, and 90% primary PM10+SOA+SIA. SOA is secondary organic aerosol; SIA is secondary inorganic aerosol.
Location Date Primary Primary+SOA Primary+SOA+SIA R2 Average Under prediction R2 Average Under prediction R2 Average Under prediction
mass % factor mass % factor mass% factor Newcastle 03 1996 0.49 9 3.3 0.51 10 4.0 0.57 22 4.5 Newcastle 07 1996 0.61 6 5.0 0.63 8 5.0 0.66 40 2.5 Narberth 03 1998 0.13 2 15.0 0.14 3 13.3 0.08 18 5.6 Rochester 03 1998 0.30 8 3.8 0.30 9 4.4 0.41 47 2.1
Factor values >1 represent an under-prediction. Factor values=1 represent a perfect match. Factor values <1 represent an over-prediction.
between concentrations of modelled primary PM10and SOA
only with the measured PM10concentrations. The third
re-lationship is between the modelled primary PM10, SOA, and
total SIA concentrations and the measured PM10
concentra-tions. The coefficients of determination (R2)and the percent-age of the total measured mass that is modelled on averpercent-age, increase as each component of the model is added-in. How-ever the under-prediction factors also increase.
The modelled peak of 19 µg m−3 in the primary PM 10
around the 21–22 March, occurs on the same date as the peak in the observed data. Correlating all the modelled and measured data gives an R2 value of 0.49. The modelled SOA has provided no more than 0.3 µg m−3 (on average) to the average primary PM10 concentration of 3.6 µg m−3.
The secondary biogenic component contributes most of the mass (98%) to the total SOA modelled, because there are very few occurrences of the anthropogenic gas phase con-densable species LMXYLY and TOLY exceeding the satu-ration vapour pressure. Between 10 and 12 March the mod-elled anthropogenic secondary particles reach a maximum of 0.04 µg m−3 in total, and there is a peak of 0.2 µg m−3on 23 March. This peak in the modelled anthropogenic con-densable species occurs 1 day after the 22 March peak in modelled primary PM10. The maximum in the modelled
sec-ondary biogenic component of 0.8 µg m−3occurs on 17 and 22 March, although the whole model time series for this com-pound exhibits strong diurnal cycles.
The combined modelled primary PM10and SOA
concen-tration of 3.9 µg m−3represents one quarter of the expected mass percentage (40%) from the primary and secondary or-ganics, which is therefore under-predicted by a factor of 4. The addition of the modelled SOA to the primary PM10does
not significantly improve the correlation of the modelled time series compared with measurements of PM10(R2=0.51).
Ad-dition of the particle phase H2SO4 only to modelled PM10
resulted in a better correlation of modelled data to measure-ments (R2=0.61). However, addition of particulate HNO3to
the total modelled PM10decreased the R2to 0.57. This
im-plies that the treatment of HNO3as involatile is too
simplis-0 10 20 30 40 1 6 11 16 21 26 31 July, 1996 C onc e n tr a ti on, µg m -3 SIA SOA Primary Observed
Fig. 2. Time series to show the modelled contribution of SIA, SOA
and primary PM10 to the measured PM10 concentrations at
New-castle during July 1996.
tic. However all R2relationships are significant at the 95% confidence interval. Equal concentrations of modelled HNO3
and H2SO4are present at Newcastle during March (assuming
all HNO3is particulate matter), with an average of 4 µg m−3
and 5 µg m−3for the whole of the month, respectively. The combined modelled SIA represents 12% of the total mea-sured PM10mass, which is less than the expected 50%. The
total modelled primary PM10, SOA and SIA for the month
of March is 22% of the observed total. Thus if the maximum mass of PM10expected from all the modelled constituents is
90%, then the model has under-predicted by a factor of 4.5. 3.2 Urban Newcastle, July 1996
Figure 2 shows the modelled time series of SIA, SOA and primary PM10to total measured PM10concentrations for the
July 1996 model runs for Newcastle. Statistics for the case study are given in Table 1. CiTTyCAT results reproduce the shape of the observed values better (R2=0.61) than for March, especially between 17–23 July. The maximum mea-sured PM10(43 µg m−3)occurs on 19–20 July.
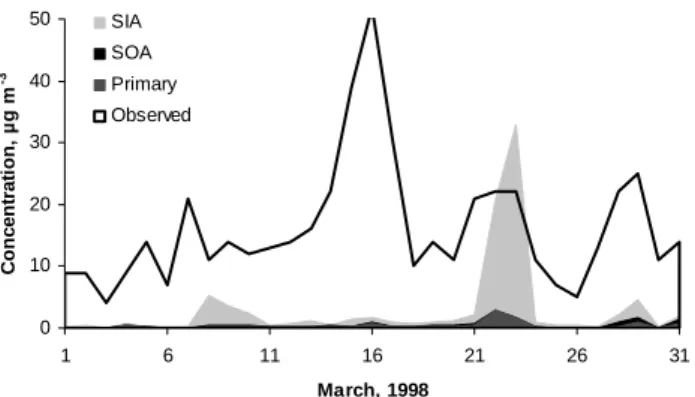
0 10 20 30 40 50 1 6 11 16 21 26 31 March, 1998 C onc e n tr a ti on, µg m -3 SIA SOA Primary Observed
Fig. 3. Time series to show the modelled contribution of SIA, SOA
and primary PM10 to the measured PM10 concentrations at
Nar-berth during March 1998.
Secondary organic and inorganic components make a much larger contribution to the modelled PM10in this
sum-mertime case. This is not as a result of seasonal fluctu-ations in emissions, which were applied to α-pinene for summer model runs. Instead, the concentrations of anthro-pogenic species in summer result from different trajectories, and hence different emission sources from those in March. Concentrations of α-pinene generated by the model for July runs are also double those modelled in March due to natural seasonal variation. A peak in the secondary biogenic compo-nent of 1.5 µg m−3, occurs on 21 July at midnight. The mass percentage of the total modelled SOA species due to the bio-genic compound alone is 95%. However, modelled primary PM10 concentrations for July are about a third of the
mod-elled March concentrations. Higher concentrations of the anthropogenic compounds in July are due to localised emis-sions in the north east of the UK, as the trajectories spend much of their lifetime over the sea, where there are no emis-sions. This also suggests that there was insufficient time for a pulse of anthropogenic emissions during the final part of the trajectories to react; there are no emissions of either anthro-pogenic species for 3.5 days at the start of the 15 July trajec-tory. The total average modelled SOA concentration during July is 0.3 µg m−3and when added to the average modelled concentrations of primary PM10of 1.2 µg m−3gives a total
of 1.5 µg m−3. This combined result under-predicts the es-timated mass percentage from the modelled primary PM10
plus the SOA by a factor of 5. The addition of the modelled SOA increases the R2correlation to 0.63, significant at the 95% confidence level.
In the R2correlations for July (Table 1), the R2 relation-ship is improved further with the addition of the HNO3,
un-like the March model runs. Using only H2SO4together with
the modelled primary PM10 and SOA does not improve the
R2relationship on the 0.63 obtained with the modelled pri-mary PM10and SOA only. However, if it is assumed that all
HNO3 is in the particle phase, the correlation is improved
marginally to 0.66. The improved correlation maybe for-tuitous, as the temperature dependence of HNO3
condensa-tion is neglected. The average concentracondensa-tions of HNO3and
H2SO4 for the whole of July at Newcastle are 0.8 µg m−3
and 1.5 µg m−3, respectively. These concentrations are 4 times less than the concentrations for both particulate inor-ganic species modelled for the month of March at Newcastle. The peak concentration in the modelled time series occurs on 19 July, with 40 µg m−3in total, with 25 µg m−3composed of HNO3and 10 µg m−3from H2SO4. The combined SIA
contributes 32% to the total measured PM10 for the whole
of the month, which is less than the expected 50% mass per-centages for SIA. If the modelled primary PM10 and SOA
concentrations are added to the modelled SIA concentration, the total modelled mass percentage for July at Newcastle is increased to 40%. This represents an under-prediction by a factor of 2.3 on the measured PM10, which is probably due
to the low concentrations of modelled primary PM10.
3.3 Rural Narberth, March 1998
Figure 3 shows the time series in the combined secondary inorganic, organic and primary modelled PM10 at the first
of the UK rural receptor sites, Narberth in west Wales. The total SOA modelled does not generally provide significant additional mass to the modelled primary PM10. As with all
previous SOA modelling studies in this work, the secondary biogenic component forms the greatest fraction of total mod-elled SOA, which is nearly 99% of the total SOA mass. How-ever, the modelled SOA concentration contributed an extra 60% to the total modelled PM10 on 29 March at Narberth,
increasing the modelled PM10from 1 µg m−3to 1.6 µg m−3.
This is the only date in the Narberth study where the addition of the modelled SOA mass concentrations makes a signifi-cant difference to the shape of the total modelled time series. Air mass trajectories on 29 March travel from France and Spain, whilst trajectories for the rest of the month travel straight across the clean Atlantic Ocean. The SOA scheme produces more particulate mass from trajectories that have traversed a greater distance across the continent. This is be-cause there are increased emissions early on in the trajectory which have time to react before reaching the receptor site. The modelled SOA for 10 March also shows an increase over the original modelled PM10, which signifies a land-based
in-fluence. The 10 March trajectory passed over the Birming-ham area and picked up anthropogenic gas phase emissions, but this increase is not mirrored by the modelled primary PM10 as the inventories are different. PMXYLY and
PM-TOLY are only present on two of the 31 days in March (9 and 23 March), in the 0.01 µg m−3range. These anthropogenic particle species therefore produce a factor of 10 to 100 times less mass than the biogenic species, though in most cases the anthropogenic species rarely exceed their vapour pressures and so remain in the gas phase. Plotting the observed PM10
K. M. Emmerson et al.: Comparison with UK PM10data 2167
plus the SOA yields an R2of 0.14 for Narberth. The per-centage of total modelled mass of primary PM10and SOA is
3% of the total measured PM10, which represents an
under-prediction on the expected 40% mass fraction by a factor of 13.3. Previously, the primary modelled fraction was under-predicted by a factor of 15 (shown in Table 1), so this is an improvement.
The average concentrations of HNO3 and H2SO4 for the
whole of March are 2.1 µg m−3and 0.3 µg m−3respectively, with a peak of 33 µg m−3on 23 March mainly due to HNO3.
Both the previous SIA studies at Newcastle showed a greater proportion of H2SO4in the modelled results. The combined
SIA modelled for Narberth forms 15% of the total measured PM10, which is one third of the expected 50% mass
percent-ages for SIA. It is likely that emissions of the gas phase pre-cursor species are not present in the air parcel, as most of the trajectory length is out over the sea. When the mod-elled primary PM10and SOA mass percentage is added to the
modelled SIA contribution, there is still a total model under-prediction by a factor of 5.6. The R2correlation coefficient is reduced to 0.08 for both of the relationships shown alongside Fig. 3, from the previous modelled R2value of 0.14. How-ever, none of these relationships are significant at 95%, and could have occurred by chance. Narberth is the only study where the R2value decreased after adding the contribution of the modelled SIA.
3.4 Rural Rochester, March 1998
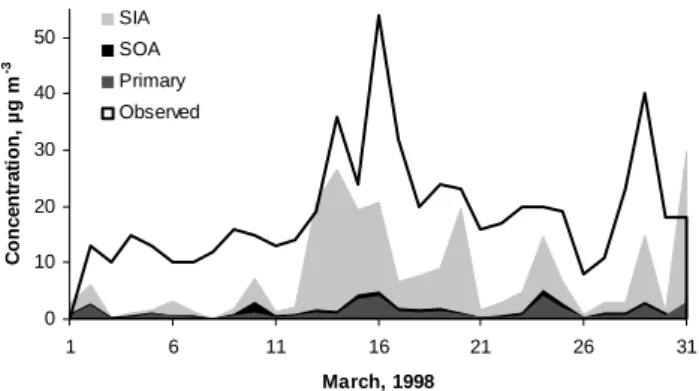
The time series in the contribution of modelled SIA, SOA and primary PM10 combined is shown alongside the total
measured PM10 concentration in Fig. 4 for the second UK
rural site, Rochester in east Kent. There are two mod-elled peaks of primary PM10 on 16 March (4.6 µg m−3,
which is 9% of the measured PM10 peak of 54 µg m−3)
and 24th, though there is only peak in the measured PM10
on 16 March. The monthly average concentration of pri-mary PM10 at Rochester represents 8% of the observed
av-erage concentration. Until 23 March the modelled SOA is around 0.05 µg m−3, and therefore contributes little mass on top of the modelled primary PM10. The trajectories for
the latter period of March traverse more of the European continent and therefore produce slightly more SOA, around 0.2 µg m−3, which is a factor of 10 greater than the partic-ulate mass produced from the non-continental trajectories. The peak day for modelled SOA concentrations is 24 March, which yields 0.6 µg m−3entirely composed of the secondary
biogenic component. The model calculates anthropogenic species PMXYLY and PMTOLY to be in the particle phase at Rochester on only 2 days (25 and 29 March, at concentra-tions of 0.05 µg m−3. These dates at Rochester do not cor-respond with the same dates in March at Narberth when the anthropogenic species were modelled in the particle phase.
The R2of the correlations between the modelled primary and modelled primary plus SOA against measured PM10 at
0 10 20 30 40 50 1 6 11 16 21 26 31 March, 1998 C onc e n tr a ti on, µg m -3 SIA SOA Primary Observed
Fig. 4. Time series to show the modelled contribution of SIA,
SOA and primary PM10 to the measured PM10 concentrations at Rochester during March 1998.
Rochester are both 0.30. The total modelled mass of PM10
for the Rochester case is only 9% of the total measured PM10,
and the expected mass is under-predicted by a factor of 4.4. Both SIA correlations (i.e. H2SO4only and H2SO4plus
HNO3)are an improvement on the previous R2value of 0.30
for Rochester. The coefficients of determination are 0.36 with the addition of H2SO4 only, and 0.41 for the further
addition of HNO3. All R2 values for Rochester border on
significance at the 95% test level. The peaks and troughs in the modelled species shown in Fig. 4 do not reflect the smoothness of the measured data and explains why the cor-relation is poor. However, the modelled time series is very good for the last half of the month, with sharp peaks on 20, 24 and 29 March with 20 µg m−3, 15 µg m−3and 22 µg m−3 re-spectively. The average concentrations of HNO3and H2SO4
modelled for the whole month at Rochester are 6.6 µg m−3 and 0.6 µg m−3, respectively, again showing a dominance of HNO3. This was also the case at Narberth, but H2SO4was
the more dominant SIA species for both months at New-castle. At Rochester, the average model concentration of HNO3is 7 times greater than the H2SO4concentration. The
combined modelled inorganic species forms 38% of the total measured PM10, which represents a slight under-prediction
of the expected SIA mass percentage by the model. Addi-tion of the modelled mass percentage of PM10and SOA for
March gives a total mass of 47% for the modelled species. This still represents an under-prediction by a factor of 1.9 on the measured PM10concentrations, again assumed to be
predominantly due to the under-predicted primary PM10.
4 Sensitivity tests
Two sensitivity tests have been conducted which vary the model initial conditions, emission and deposition rates for the inert primary PM10. In CiTTyCAT, the steady state
con-centration depends linearly on the emission rate E, and on the
Table 2. Results from 22 March trajectory with varying initial
con-ditions. All concentrations in units of µg m−3.
Initial PM10 Resultant PM10
Default 0 19
European Background 16 27.3 European Background × 2 40 40 High Initial Values 120 89
reciprocal of the deposition velocity, 1/VD.
dχi dt = Ei h − VDiχi h (10)
The very simple treatment of PM10in CiTTyCAT will
in-troduce some errors in the model results. The most impor-tant simplifications are (i) no wet deposition and (ii) instan-taneous mixing through the height of the boundary layer. Er-ror (i) could affect the ability of the model to capture vari-ability in the observed time series, but not the consistent under-prediction of the observed aerosol mass. We concen-trate on error (ii) here, since it is related to this first-order under-prediction error. The sensitivity to mixing height may be significant, but is not such a problem for low spatial res-olution in emission inventories, and for gradual changes in emissions between adjacent emission squares, but may be considered for areas of rapidly changing emission values. 4.1 Varying initial conditions
As many of the trajectories begin over Central and Eastern Europe, it may have been more realistic to set the initial par-ticle concentration at a European background value, rather than 0 µg m−3. These regions are known to dominate particle emissions (ApSimon et al., 2001), and air parcels originating here are unlikely to be entirely clean. Table 2 shows the re-sults when the trajectory for the peak concentrations on 22 March at Newcastle is re-run with varying initial concentra-tions. The impact is not linear, due to the self-limiting effect of the first-order deposition scheme. The first row gives the default value and the modelled outcome of 19.4 µg m−3. The
second row uses the estimated European annual average from ApSimon et al. (2001) who also used the TNO inventory. They thought that their original estimates might be under-predicted by a factor of two, and row 3 in the table reflects this. The final row shows that very high initial conditions must be used to approach the measured value of 94 µg m−3 with the primary PM10 alone, yet this neglects the fact that
most PM10is composed of SIA.
4.2 Varying emission and deposition rates
To study the effects of varying emissions and deposition, a trajectory ending on 19 July at Newcastle, the peak in the
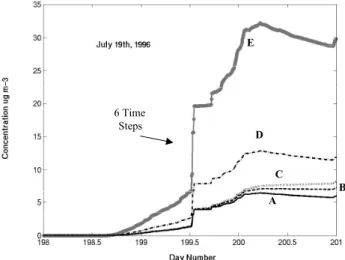
A D E C B 6 Time Steps
Fig. 5. Sensitivity study for trajectory ending at Newcastle on 19
July 1996 (see Fig. 2). (A) is the original response. (B) the depo-sition rate is halved, (C) the depodepo-sition rate is divided by 5, (D) the emission rates were doubled and (E) the emission rates multiplied by 5.
modelled concentrations for that month, is run five times. Figure 5 shows the progression of the trajectory from day 198 as it travels towards Newcastle on day 201 (19 July). Note that approximately half of the final particulate mass is injected in half an hour (6 model time steps) as the air trajectory crosses the UK, illustrating the variability in the emission inventory. Response A shows the default model run. Responses B and C use the default emissions, but divide the deposition rates by 2 and by 5, respectively. Responses D and E use the default deposition rates, but multiply the emission rates by 2 and by 5, respectively. The choices for using the factors 2 and 5 were to test whether a reasonable under or over-prediction would help the modelling case, or whether a 400% increase in emissions was required to reach the observed concentrations. It can be seen that forcing the emissions (D and E) has more effect on the concentration of PM10, than forcing the deposition rate (B and C). The
end point at Newcastle on day 201 shows the original PM10
concentration to be 6 µg m−3. Doubling the emissions (D), gives a PM10 concentration of 12 µg m−3, and multiplying
the emission rate by a factor of 5 (E) gives 30 µg m−3. The response from CiTTyCAT is linear in the emissions for this case. The measured concentrations in Fig. 2 show that at Newcastle there was 43 µg m−3of PM
10on 19 July. If
ap-proximately 30% of the PM10mass is expected to be primary
in an urban area (recall that the Newcastle receptor site is not immediately beside a road), then the target for primary parti-cles is reduced to 13 µg m−3. This can be achieved by mul-tiplying the primary particulate emission rates by 2. We may regard this as a rough estimate of the under-prediction of the emissions inventory, or over-prediction of the boundary layer height.
K. M. Emmerson et al.: Comparison with UK PM10data 2169
5 Conclusions
Our Lagrangian model of primary, organic secondary and in-organic secondary aerosol mass correlates at the 95% signifi-cance level with PM10data measured data background urban
site, but does less well compared to data at two rural sites. Although the correlations are significant, there are consis-tent and substantial under-predictions of average total mass concentrations and of the expected mass percentages of dif-ferent combinations of aerosol components. The model can be brought closer to the observations by including a back-ground initial concentration for PM10, and/or increasing the
emissions of primary particles by a factor of approximately 2.
Secondary organic aerosol mass in the model output is al-ways a fraction of the total aerosol mass, but its inclusion does generally improve the model-data correlations. The sin-gle biogenic species produces significantly more (in excess of 80%) of the condensed particle mass in CiTTyCAT in all cases, than either of the two anthropogenic species. This re-flects the reactivity of biogenic compounds and the model suggests that they could be the main contributors to SOA production. However, there was no spatial variation in the biogenic emissions, and whilst the high molecular weight compounds are more reactive (such as α-pinene), it is the C5-C10 anthropogenic compounds (predominantly the
aro-matics) which contribute most to SOA mass concentrations in urban areas (Isodorov, 1990). It is likely that many other important C5-C10organic compounds are not accounted for
in CiTTyCAT, such as other aromatics, aldehydes, alkenes and ketones. Such VOCs may also be under-estimated in the emission inventories, as measurement techniques have pre-viously misinterpreted their importance (Lewis et al., 2000). The modelling studies undertaken with the new SOA module show minor improvements in correlation with measurements at the UK receptor sites, with the urban case showing the best improvement in the correlation coefficients between the modelled and measured PM10concentrations. The modelled
SOA in the UK urban case produces a factor of 2 more mass than the rural case, which highlights the emission differences incurred when the trajectories travel over the land. The cor-relations between primary modelled PM10and the measured
PM10 were poor, and addition of the modelled SOA did not
improve the strengths or the significance of these relation-ships. Table 1 shows the percentages of the measured data for modelled primary PM10, both with and without the
mod-elled SOA and SIA. These calculations are based on an ex-pected 30% by mass for modelling the primary PM10 only,
an expected 40% for the primary PM10 plus the SOA, and
an expected 90% for modelled primary PM10, SOA and SIA
combined. Generally, the model under-prediction decreases as further species are added. This suggests that if all PM10
species were accounted for explicitly in the model, the re-lationships between modelled and measured PM10will
con-tinue to improve. A perfect correlation (i.e. R2=1) between
such explicit species modelling and measurements is un-likely, as not all compounds that contribute to PM10 will be
accounted for and to some extent parameterisations must be used. In addition, the transport and mixing of the air can never be modelled accurately. In spite of the inherent limita-tions of these process modelling studies, it seems clear that more process studies are necessary to support global climate modelling that includes aerosol forcing, to improve confi-dence that the emissions inventories and model structures are sufficiently accurate to yield useful estimates of aerosol load-ing. A companion paper studying European receptor sites (EMO, 2004) aims to further this understanding.
Acknowledgements. The authors would like to thank H. Stewart and D. Lowe of the atmospheric interactions group at Lancaster University for providing expertise with the biogenic emissions and computer programming, respectively. KME would like to acknowledge her studentship from the UK Universities Global Atmospheric Modelling Programme (UGAMP). CiTTyCAT is a product of UGAMP’s Atmospheric Chemistry Support Unit, at the University Chemical Laboratory, Cambridge, UK.
Edited by: T. Hoffmann
References
ApSimon, H. M., Gonzalez del Campo, M. T., and Adams, H. S.: Modelling long-range transport of primary particulate material over Europe, Atmos. Environ., 35, 343–352, 2001.
Atkinson, R.: Atmospheric chemistry of VOCs and NOx, Atmos.
Environ., 34, 2063–2101, 2000.
Calvert, J. G., Atkinson, R., Becker, K. H., Seinfeld, J. H., Walling-ton, T. J., and Yarwood, G.: The mechanism of atmospheric oxi-dation of aromatic hydrocarbons. Oxford University Press, New York, ISBN 0-19-524628-X, 2002.
Calvert, J. G., Su, F., Bottenheim, J. W., and Strausz, O. P.: Mech-anism of the homogeneous oxidation of sulphur dioxide in the troposphere, Atmos. Environ., 12, 197–226, 1997.
Christoffersen, T. S., Hjorth, J., Horie, O., Jensen, N. R., Kotzias, D., Molander, L. L., Neeb, P., Ruppert, L., Winterhalter, R., Virkkula, A., Wirtz, K., and Larsen, B. R.: Cis-pinic acid, a pos-sible precursor for organic aerosol formation from ozonolysis of
α-pinene, Atmos. Environ., 32, 1657–1661, 1998.
Dement, W. A., Tyson, B. J., and Mooney, H. A.: Mechanism of monoterpene volatilisation in Salvia mellifera, Phytochemistry, 14, 2555–2557, 1975.
DeMore, W. B., Sander, S. P., Golden, D. M., Hampson, R. F., Kurylo, M. J., Howard, C. J., Ravishankara, A. R., Kolb, C. E., and Molina, M. J.: Chemical kinetics and data for use in strato-spheric modelling, Eval 11, Jet Propulsion Laboratory, Pasadena, California, 1994.
Derwent, R. G. and Malcolm, A. L.: Photochemical generation of secondary particles in the United Kingdom, Phil. Trans. R. Soc. Lond, 358, 2643–2657, 2000.
Emmerson, K. M.: Modelling the production of organic atmo-spheric aerosol, PhD thesis, Lancaster University, 2002. Evans, M. J., Shallcross, D. E., Law, K. S., Wild, J. O. F.,
Sim-monds, P. G., Spain, T. G., Berrisford, P., Methven, J. V., Lewis,
A. C., McQuaid, J. B., Pilling, M. J., Bandy, B. J., Penkett, S. A., and Pyle, J. A: Validation of a Lagrangian box model using field measurements from EASE (Eastern Atlantic Summer Ex-periment) 1996, Atmos. Environ., 34, 3843–3863, 2000. Griffin, R. J., Cocker, D. R. III., Seinfeld, J. H., and Dabdub, D. R.:
Estimate of global organic aerosol from oxidation of biogenic hydrocarbons, Geophys. Res. Lett, 26, 2721–2724, 1999. Guenther, A., Hewitt, C. N., Erickson, D., Fall, R., Geron, C.,
Graedel, T., Harley, P., Klinger, L., Lerdau, M., McKay, W. A., Pierce, T., Scholes, B., Steinbrecher, R., Tallamraju, R., Taylor, J., and Zimmerman, P.: A global model of natural volatile or-ganic compound emissions, J. Geophys. Res., 100, 8873–8892, 1995.
Harrison, R. M., Deacon, A. R., Jones, M. R., and Appleby, R. S.: Sources and processes affecting concentrations of PM10and
PM2.5particulate matter in Birmingham (UK), Atmos. Environ.,
31, 4103–4117, 1997.
Hallquist, M., W¨angberg, I., Ljungstr¨om, E., Barnes, I., and Becker, K. H.: Aerosol and product yields from NO3radical initiated oxidation of selected monoterpenes, Environ. Sci. Technol., 33, 553–559, 1999.
Heintzenberg, J.: Fine particles in the global troposphere: A review, Tellus B, 41, 149–160, 1989.
Hoffmann, T., Odum, J. R., Bowman, F., Collins, D., Klockow, D., Flagan, R. C., and Seinfeld, J. H.: Formation of organic atmo-spheric aerosols from the oxidation of biogenic hydrocarbons, J. Atmos. Chem., 26, 189–222, 1997.
Intergovernmental Panel on Climate Change (IPCC): Climate change 2001: The scientific basis, edited by: Houghton, J. T., Ding, Y., and Griggs, D. J., et al., Cambridge University Press, 2001.
Isodorov, V. A.: organic chemistry of the earth’s atmosphere, Springer-Verlag, Berlin, 1990.
Jacob, D. J.: Heterogeneous chemistry and tropospheric ozone, At-mos. Environ., 34, 2131–2159, 2000.
Jenkin, M. E.: Chemical mechanisms forming condensable ma-terial, AEA Technology Report, AEA/RAMP/20010010/002, 1996.
Jenkin, M. E., Saunders, S. M., Wagner, V., and Pilling, M. J.: Pro-tocol for the development of the Master Chemical Mechanism, MCM v3 (Part B): Tropospheric degradation of aromatic volatile organic compounds, Atmos. Chem. Phys, 3, 181–193, 2003,
SRef-ID: 1680-7324/acp/2003-3-181.
Kuhlbusch, T. A. J., John, A. C., Fissan, H., Schmidt, K.-G., Schmidt, F., Pfeffer, H.-U., and Gladtke, D.: PM10 and PM2.5
mass concentration, chemical composition, and size distribution measurements at three different sites in the Ruhr area, Germany, J. Aerosol Sci., 30, S45–S46, 1999.
Lewis, A. C., Carslaw, N., Marriott, P. J., Kinghorn, R. M., Mor-rison, P., Lee, A. M., Bartle, K. D., and Pilling, M. J.: A larger pool of ozone-forming carbon compounds in urban atmospheres, Nature, 405, 778–781, 2000.
Malcolm, A. L., Derwent, R. G., and Maryon, R. H.: Modelling the long range transport of secondary PM10 to the UK, Atmos.
Environ., 34, 881–894, 2000.
Odum, J. R., Hoffmann, T., Bowman, F., Collins, D., Flagan, R. C., and Seinfeld, J. H.: Gas/particle partitioning and secondary organic aerosol yields, Environ. Sci. Technol., 30, 2580–2585, 1996.
Owen, S. M., Harley, P. Guenther, A., and Hewitt, C. N.: Light de-pendency of VOC emissions from selected Mediterranean plant species, Atmos. Environ., 36, 3147–3159, 2002.
Pandis, S. N., Harley, R. A., Cass, G. R., and Seinfeld, J. H.: Sec-ondary organic aerosol formation and transport, Atmos. Envi-ron., 26A, 2269–2282, 1992.
Pandis, S. N., Paulson, S. E., Seinfeld, J. H., and Flagan, R. C.: Aerosol formation in the photo-oxidation of isoprene and β-pinene, Atmos. Environ., 25A, 997–1005, 1991.
Photochemical Oxidants Review Group (PORG): Ozone in the United Kingdom, Fourth report, 1997.
Saunders, S. M., Jenkin, M. E., Derwent, R. G., and Pilling, M. J.: Protocol for the development of the Master Chemical Mech-anism, MCM v3 (Part A): Tropospheric degradation of non-aromatic volatile organic compounds, Atmos. Chem. Phys., 3, 161–180, 2003,
SRef-ID: 1680-7324/acp/2003-3-161.
Schubert, S. D., Rood, R. B., and Pfaendtner, J.: An assimilated data set for earth science applications, Bulletin of the American meteorological Society, 74, No. 12, 1993.
Schuh, G., Heiden, A. C., Hoffmann, T., Kahl, J., Rockel, P., Rudolph, J., and Wildt, J.: Emissions of volatile organic com-pounds from sunflower and beech: Dependence on temperature and light intensity, J. Atmos. Chem., 27, (3), 291–318, 1997. Simpson, D., Winiwarter, W., Borjesson, G., Cinderby, S., Ferreiro,
A., Guenther, A., Hewitt, C. N., Jansen, R., Khalil, M. A. K., Owen, S., Pierce, T. E., Puxbaum, H., Shearer, M., Skiba, U., Steinbrecher, R., Tarrason, L., and Oquist, M. G.: Inventorying emissions from nature in Europe, J. Geophys. Res., 104, 8113– 8152, 1999.
Stewart, H. E.: The development of a biogenic isoprene and monoterpene emission inventory for Great Britain, PhD thesis, Lancaster University, 2001.
Stewart, H. E., Hewitt, C. N., Bunce, R. G. H., Steinbrecher, R., Smiatek, G., and Schoenemeyer, T.: A highly spa-tially and temporally resolved inventory for biogenic isoprene and monoterpene emissions – model description and appli-cation to Great Britain, J. Geophys. Res, 108 (D20), 4644, doi:10.1029/2002JD002694, 2003.
TNO.: Particulate matter emissions (PM10–PM2.5–PM0.1)in Eu-rope in 1990 and 1993, Report TNO-MEP-R96/472, Nether-lands, February 1997, 1997.
Zappoli, S., Andracchio, A., Fuzzi, S., Facchini, M. C., Gelenoser, A., Kiss, G., Krivacsy, Z., Molnar, A., Meszaros, E., Hansson, H-C., Rosman, K., and Zebuhr, Y.: Inorganic, organic and macro-molecular components of fine aerosol in different areas of Europe in relation to their water solubility, Atmos. Environ., 33, 2733– 2743, 1999.