HAL Id: hal-00301526
https://hal.archives-ouvertes.fr/hal-00301526
Submitted on 1 Dec 2004HAL is a multi-disciplinary open access
archive for the deposit and dissemination of sci-entific research documents, whether they are pub-lished or not. The documents may come from teaching and research institutions in France or abroad, or from public or private research centers.
L’archive ouverte pluridisciplinaire HAL, est destinée au dépôt et à la diffusion de documents scientifiques de niveau recherche, publiés ou non, émanant des établissements d’enseignement et de recherche français ou étrangers, des laboratoires publics ou privés.
GPS radio occultation with CHAMP: monitoring of
climate change parameters
T. Schmidt, S. Heise, J. Wickert, G. Beyerle, C. Reigber
To cite this version:
T. Schmidt, S. Heise, J. Wickert, G. Beyerle, C. Reigber. GPS radio occultation with CHAMP: monitoring of climate change parameters. Atmospheric Chemistry and Physics Discussions, European Geosciences Union, 2004, 4 (6), pp.7837-7857. �hal-00301526�
ACPD
4, 7837–7857, 2004 GPS radio occultation with CHAMP T. Schmidt et al. Title Page Abstract Introduction Conclusions References Tables Figures J I J I Back Close Full Screen / EscPrint Version Interactive Discussion
EGU Atmos. Chem. Phys. Discuss., 4, 7837–7857, 2004
www.atmos-chem-phys.org/acpd/4/7837/ SRef-ID: 1680-7375/acpd/2004-4-7837 European Geosciences Union
Atmospheric Chemistry and Physics Discussions
GPS radio occultation with CHAMP:
monitoring of climate change parameters
T. Schmidt, S. Heise, J. Wickert, G. Beyerle, and C. Reigber
GeoForschungsZentrum Potsdam, Department 1: Geodesy and Remote Sensing, Potsdam, Germany
Received: 20 September 2004 – Accepted: 27 October 2004 – Published: 1 December 2004 Correspondence to: T. Schmidt (tschmidt@gfz-potsdam.de)
ACPD
4, 7837–7857, 2004 GPS radio occultation with CHAMP T. Schmidt et al. Title Page Abstract Introduction Conclusions References Tables Figures J I J I Back Close Full Screen / EscPrint Version Interactive Discussion
EGU
Abstract
The Global Positioning System (GPS) radio occultation (RO) technique offers a valu-able new data source for global and continuous monitoring of the Earth’s atmosphere. Refractivity, temperature and water vapor profiles with high accuracy and vertical res-olution can be derived from this method. The GPS RO technique requires no
cali-5
bration, is not affected by clouds, aerosols or precipitation, and the occultations are almost uniformly distributed over the globe. In this paper the potential of GPS RO for monitoring of the temperature is demonstrated exemplarily for the tropical upper tropo-sphere and lower stratotropo-sphere (UTLS) region using GPS RO data from the German CHAMP (CHAllenging Minisatellite Payload) satellite mission. In addition, results of
10
a 1DVAR retrieval scheme to derive tropospheric water vapor profiles using ECMWF data as background will be discussed. CHAMP RO data are available since 2001 with up to 200 high resolution temperature profiles per day. The temperature bias between CHAMP temperature profiles and radiosonde data as well as ECMWF analyses is less than 0.5 K between 300–30 hPa. The CHAMP RO experiment generates the first
long-15
term RO data set. Other satellite missions will follow (GRACE, TerraSAR-X, COSMIC, METOP) generating some thousand profiles of atmospheric parameters daily.
1. Introduction
The availability of GPS radio signals has introduced a new promising remote sensing technique for the Earth’s atmosphere (Melbourne et al.,1994; Kursinski et al.,1997;
20
Anthes et al., 2000). The GPS-based radio occultation (RO) exploits these signals received onboard a Low Earth Orbiting (LEO) satellite for atmospheric limb sounding. The GPS signals are influenced by the atmospheric refractivity field resulting in a time delay and bending of the signal. The atmospheric excess phase is the basic observable that is measured with millimetric accuracy (Wickert et al.,2001a). This is the basis for
25
ACPD
4, 7837–7857, 2004 GPS radio occultation with CHAMP T. Schmidt et al. Title Page Abstract Introduction Conclusions References Tables Figures J I J I Back Close Full Screen / EscPrint Version Interactive Discussion
EGU The proof-of-concept GPS RO experiment GPS/MET (GPS/Meteorology) performed
between 1995 and 1997 has demonstrated for the first time the potential of GPS-based limb sounding from LEO satellites for deriving atmospheric temperature and tropo-spheric water vapor profiles (Ware et al., 1996; Kursinski et al., 1997;Rocken et al., 1997). Further missions with radio occultation experiments followed (Øersted, SAC-C,
5
and CHAMP), with the German geoscience satellite CHAMP measuring continuously in an operational manner since mid-2001 (Wickert et al.,2004a;Hajj et al.,2004). The first test activation of the GPS RO experiment aboard the U.S.-German GRACE (Grav-ity Recovery And Climate Experiment) mission took place on 28 and 29 July 2004 (Wickert et al., submitted, 2004b1).
10
First investigations of the thermal structure and variability in the tropical UTLS region based on GPS RO measurements were performed byNishida et al.(2000) andRandel et al. (2003) on the basis of the GPS/MET data from 1995–1997 with focus to the so-called ‘prime-times’ (June–July 1995, December–February 1996/1997) (Rocken et al., 1997). Applications of CHAMP RO data to that region with a 1 and 2.5-year data set
15
were shown bySchmidt et al.(2004a,b).
One challenge in processing GPS radio occultation measurements is the data anal-ysis in the lower troposphere. A negative refractivity bias in relation to meteorological data is observed, which leads to a corresponding bias in the specific humidity (Ao et al.,2003;Beyerle et al.,2004). Reasons for this bias are GPS receiver tracking errors,
20
uncorrected multipath in signal propagation and critical refraction. The application of advanced retrieval techniques, as the Full Spectrum Inversion (FSI) method (Jensen et al.,2003), reduces the refractivity bias significantly (Wickert et al.,2004a). The FSI is implemented to the current version (005) of the operational CHAMP data analysis software at GFZ Potsdam.
25
1
Wickert, J., Beyerle, G., K ¨onig, R., Grunwaldt, L., Heise, S., Michalak, G., Reigber, C., and Schmidt, T.: GPS radio occultation with CHAMP and GRACE: A first look at a new and promis-ing satellite configuration for global atmospheric soundpromis-ing, Geophys. Res. Lett., submitted, 2004b.
ACPD
4, 7837–7857, 2004 GPS radio occultation with CHAMP T. Schmidt et al. Title Page Abstract Introduction Conclusions References Tables Figures J I J I Back Close Full Screen / EscPrint Version Interactive Discussion
EGU CHAMP was launched on 15 July 2000 from Plesetsk (Russia) into an almost
circu-lar (eccentricity=0.004) and near polar (inclination=87.2◦) orbit with an initial altitude of 454 km. The GPS radio occultation experiment was successfully started on 11 Febru-ary 2001 (Wickert et al., 2001b). Since then up to 200 high-resolution temperature profiles per day were observed.
5
2. Measuring principle and data quality
A detailed description for deriving vertical atmospheric profiles from CHAMP occulta-tion measurements is presented byWickert et al.(2001b,2004a). A Black-Jack GPS receiver (provided by NASA/JPL) onboard CHAMP records phase and amplitude vari-ations with high temporal resolution (50 Hz) during an occultation event (Fig. 1). By
10
using high precision orbit information from CHAMP and occulting GPS satellites the atmospheric excess phase can be extracted which is related to a bending angle profile
α(a). A double differencing method is applied to remove clock errors. For this
pur-pose a GPS ground station network is operated jointly by JPL and GFZ. Ionospheric effects are corrected by a linear combination of the bending angles derived from the
15
two GPS frequencies. Assuming spherical symmetry, refractivity profiles are calculated by inverting the bending angle profiles using the Abel inversion (Eqs.1and2).
α(a)= 2a Z∞ a d a0( 1 p a02− a2 · d ln n(r) d a0 ) with n= n(r) (1) ln n(r)= 1 π Z∞ a d a0 α(a 0 ) p a02− a2 (2) N(r)= (n − 1) · 106= 77.6p T + 3.73 · 10 5pw T2 (3) 20
The atmospheric refractivity N(r) (Eq.3, with p: air pressure; T: air temperature, and
ACPD
4, 7837–7857, 2004 GPS radio occultation with CHAMP T. Schmidt et al. Title Page Abstract Introduction Conclusions References Tables Figures J I J I Back Close Full Screen / EscPrint Version Interactive Discussion
EGU RO technique. It can be derived without any kind of ‘background’ information, a new
dimension of atmospheric remote sensing data. To convert the refractivity profiles into pressure and temperature profiles the assumption of dry air has to be made because of the ambiguity between the dry and wet part in the resulting refractivity profile. The hy-drostatic equation is used to calculate pressure and temperature profiles by downward
5
integration of the refractivity profile. For the initialisation of the hydrostatic equation (at 43 km) ECMWF data are used. Figure2shows a comparison of CHAMP RO tem-peratures with nearby radiosondes. More than 15 000 RO meet the condition that the radiosonde was launched within a distance of less than 300 km and with a time delay less than 3 h from the CHAMP measurement. The comparisons show a temperature
10
bias less than 0.5 K (RMS deviation 1–2 K) between 250–20 hPa (Fig.2a) confirming CHAMP’s excellent data quality especially in the UTLS region. The cold bias in the middle and lower troposphere (below 300 hPa) is caused by the difference between temperature and dry temperature for non-zero humidity (Kursinski et al.,1997).
However, to solve for the ambiguity of the ‘dry’ and ‘wet’ term (Eq.3) additional
me-15
teorological information is necessary. For this purpose a 1Dvar technique (Healy and Eyre, 2000) is used. This method is based on optimal estimation of both, temperature and water vapor, using the error characteristics of the measurement (refractivity) and the ‘background’ information (ECMWF). The 1Dvar technique assumes bias free ob-servations. The known negative refractivity bias in the lower troposphere (Fig.3) leads
20
to a corresponding negative bias of the retrieved water vapor. More detailed results of the 1Dvar retrieval are discussed in Sect.4.
The vertical resolution of the profiles ranges from 0.1–1 km. The resolution along the ray path is around a few hundred km.
3. Application of CHAMP data to the tropical UTLS region
25
In this section an application of CHAMP radio occultation data will be discussed with respect to monitoring of global atmospheric parameters of the climate system. The
ACPD
4, 7837–7857, 2004 GPS radio occultation with CHAMP T. Schmidt et al. Title Page Abstract Introduction Conclusions References Tables Figures J I J I Back Close Full Screen / EscPrint Version Interactive Discussion
EGU focus is concentrated on the tropical UTLS region.
Dynamical, chemical, and radiative coupling between the stratosphere and tropo-sphere are among the many important processes that must be understood for pre-diction of global change (Holton et al.,1995;Sausen et al.,2003). The exchange of mass, water, and chemical matter between the troposphere and stratosphere takes
5
place across the tropopause that is characterised by an abrupt change in the temper-ature lapse-rate. The continuous identification and monitoring of the tropopause on a global scale is an important goal in atmospheric and climate research. This can be per-formed by the radio occultation technique due to its high vertical resolution and global coverage.
10
3.1. Time-averaged and spatial structure
Averaged tropopause statistics were computed from individual high-resolution CHAMP temperature profiles. For the identification of the lapse-rate tropopause (LRT), the WMO definition for the thermal tropopause was used (WMO,1957). In addition to the LRT parameters, the cold-point tropopause (CPT) characteristics and the 100-hPa level
15
features are also included here. The tropical tropopause has not a sharp boundary. As discussed, e.g., in Highwood and Hoskins (1998) a tropical transition layer (TTL) is introduced in which the interaction of convection, the stratospheric wave driven cir-culation and horizontal transport processes determine the troposphere-stratosphere exchange. Gettelman and de Forster (2002) suggest that the CPT forms the upper
20
boundary of the TTL. The 100-hPa level that has also been used for the identification of the tropical tropopause can only serve as a proxy. On the basis of the individual CHAMP RO measurements monthly averages of the tropopause parameters were cal-culated.
Figure 4 shows the monthly mean tropopause parameters for the equatorial zone
25
(10◦S–10◦N). The tropopause is highest and coldest during the northern hemisphere winter months, and lowest and warmest during the northern summer. In the CHAMP data the LRT altitude has its maximum at 17.5 km in December and January and the
ACPD
4, 7837–7857, 2004 GPS radio occultation with CHAMP T. Schmidt et al. Title Page Abstract Introduction Conclusions References Tables Figures J I J I Back Close Full Screen / EscPrint Version Interactive Discussion
EGU minimum in August and September (16.0 km). During all months the CPT is about
300–500 m higher than the LRT. The 100-hPa level is at 16.6 km all time long. In the northern hemisphere winter the 100-hPa level is in the troposphere and during the southern hemisphere winter months the 100-hPa level is located above the LRT, but not above the CPT. Figure 4b shows the mean LRT and CPT pressure supporting
5
the interpretation for LRT and CPT altitude: minimum of LRT pressure in December– January and maximum in August–September. The CPT pressure is about 5–10 hPa lower than the LRT pressure. Figure4c shows mean tropopause temperature values from CHAMP RO data. In the equatorial zone the tropopause temperature is lowest in the northern hemispheric winter months and highest during northern summer. Monthly
10
averaged CPT temperatures reach −86.5◦C in December–January and increase to −79◦C in August. LRT values are about 1 K higher than CPT temperatures. The poten-tial temperature is an important value because the tropical tropopause corresponds to an isentropic surface with a potential temperature of on average about 380 K (Holton et al.,1995). Typical values of mean potential temperature in the equatorial zone found
15
in the CHAMP RO measurements are between 367–376 K for LRT and 374–385 K for the CPT. The number of CHAMP RO temperature profiles that are the basis for these investigations can be found in Fig.4e.
An example for the spatial, i.e. latitudinal-longitudinal, structure of the tropical CPT temperature is shown in Fig.5. One can clearly see the CPT temperature minimum in
20
the western Pacific region during the northern winter months with temperatures reach-ing values lower than −86◦C (Fig.5a). During northern summer the temperature mini-mum is also located in that region but with values of about −80◦C (Fig.5b).
The basis for the contour plots are mean tropopause parameters representing a grid of 10◦resolution in latitude and longitude respectively. The averages for the winter and
25
summer plots are based on 3-year means. The 6 latitudes (25◦S, 15◦S, 5◦S, 5◦N, 15◦N, and 25◦N) and 35 longitudes (175◦W, 165◦W, 155◦W, . . ., 155◦E, 165◦E, and 175◦E) are the centers of the bins. Each of these areas contain on average about 40 CHAMP RO measurements. Thus, already this single satellite constellation leads to a
ACPD
4, 7837–7857, 2004 GPS radio occultation with CHAMP T. Schmidt et al. Title Page Abstract Introduction Conclusions References Tables Figures J I J I Back Close Full Screen / EscPrint Version Interactive Discussion
EGU global coverage of the tropical region for seasonal plots of climate parameters where
no interpolation is necessary. With increasing numbers of RO experiments in the near future the spatial information density (not only in the UTLS region) of atmospheric climate parameters will increase rapidly.
3.2. QBO
5
As already shown byRandel et al. (2003) for the GPS/MET data andSchmidt et al. (2004b) for the first 31 months of CHAMP data the quasi-biennial oscillation (QBO) pattern can also be found in GPS RO temperature data. For that purpose monthly means of temperature, as in Fig.4c, and the annual cycle based on 2- or 3-year val-ues (2001–2004), respectively, were calculated but separately for each altitude level
10
between 10–35 km in 0.5 km intervals over the equator (4◦S–4◦N). Subtracting the an-nual temperature cycle from the individual monthly means leads to Fig.6showing the monthly temperature anomalies in the UTLS over the equator region based on the CHAMP RO measurements from May 2001–May 2004. The downward propagating patterns in the lower stratosphere have a period of about two years with maximum
15
deviations of ±4.5 K between 22 and 31 km. At the tropopause level the anomalies are decreased to about ±0.5 K. This temperature anomaly patterns are caused by the stratospheric QBO (Baldwin et al.,2001).
4. 1DVAR retrieval for water vapor in the troposphere
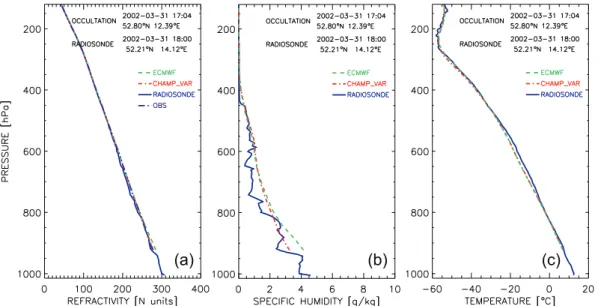
To give an impression on the retrieval results, Fig. 7 shows an example of CHAMP
20
1Dvar refractivity, specific humidity and temperature vertical profiles in comparison to radiosonde and ECMWF data. Figure7reveals significant improvement of background (ECMWF) specific humidity in comparison to radiosonde by the 1Dvar retrieval.
The 1Dvar retrieval results have been validated with radiosonde data. Figure 8 shows the statistical comparison (bias and standard deviation) of specific humidity
ACPD
4, 7837–7857, 2004 GPS radio occultation with CHAMP T. Schmidt et al. Title Page Abstract Introduction Conclusions References Tables Figures J I J I Back Close Full Screen / EscPrint Version Interactive Discussion
EGU tical profiles from CHAMP 1Dvar and background (ECMWF) with coinciding radiosonde
profiles on a global scale. From 2001–2003 about 16 000 coincidences have been found (coincidence radius: 300 km spatial and 3 h temporal). Radiosonde data were quality checked by comparison with ECMWF and have been ignored in case of more than 10 per cent refractivity deviation. The possibility of a priori refractivity bias
cor-5
rection has been evaluated. Bias characteristics have been deduced from statistical comparison of one year of observation data with ECMWF analyses. We assumed sea-sonal and latitudinal dependent refractivity bias (four seasons and 3 latitudinal regions). Comparison of Fig.8b and Fig.8c reveals significant reduction of retrieval specific hu-midity bias with nearly the same standard deviation if a priori bias correction is applied
10
to the refractivity observations.
The 1Dvar humidity profiles may be used for investigation of mean seasonal or medium term water vapor distribution on a global scale. Due to rather low data ex-ploitation in the lower troposphere (see Fig.8d) and accuracy restrictions at low hu-midity levels in the upper troposphere, the mid troposphere region is most appropriate
15
for such investigations. Figure9a and9b show the mean global water vapor distribution at 700 hPa pressure level derived from 1Dvar results for the northern summer season 2003 and winter season 2002/2003 respectively (resolution 2.5◦ in latitude and 5.0◦ in longitude).
5. Conclusions
20
Tropical tropopause parameters on the basis of CHAMP RO measurements for the period May 2001–May 2004 have been discussed. Because of accuracy, high verti-cal resolution, and globally distributed temperature data in the tropopause region the relatively new RO technique is suitable for global monitoring of the UTLS as an impor-tant part of the atmosphere. Changes in tropopause parameters can be used for the
25
detection of climate change as already shown bySausen et al.(2003).
ACPD
4, 7837–7857, 2004 GPS radio occultation with CHAMP T. Schmidt et al. Title Page Abstract Introduction Conclusions References Tables Figures J I J I Back Close Full Screen / EscPrint Version Interactive Discussion
EGU temperature from occultation refractivity measurements in the mid and lower
tropo-sphere. Advanced retrieval techniques like the FSI method significantly reduced the negative refractivity bias in the lower troposphere. Global comparisons with radiosonde data reveal that the impact of the remaining bias on 1Dvar retrieval results can be re-duced by a priori bias correction. Nevertheless, the refractivity retrieval needs further
5
improvement. Potentials for global water vapor monitoring have been demonstrated. The CHAMP RO experiment generates the first long-term RO data set, other satel-lite missions will follow (GRACE, TerraSAR-X, METOP, COSMIC) establishing the RO technique for global temperature monitoring in the UTLS region.
Acknowledgements. We thank K. Sch ¨ollhammer and the Institute for Meteorology at the Free
10
University Berlin for delivering radiosonde data and the ECMWF for supplying global weather analyses. The tracking and orbit part of the study was funded through grant 03F0333A of the BMBF Geotechnology programme.
References
Anthes, R. A., Rocken, C., and Kuo, Y, H.: Applications of COSMIC to meteorology and climate,
15
Terrestrial, Atmospheric and Ocean Sciences, 11, 115–156, 2000. 7838
Ao, C. O., Meehan, T. K., Hajj, G. A., Mannucci, A. J., and Beyerle, G.: Lower tropo-sphere refractivity bias in GPS occultation retrievals, J. Geophys. Res., 108 (D18), 4577, doi:10.1029/2002JD003216, 2003. 7839
Baldwin, M. P., Gray, L. J., Dunkerton, T. J., Hamilton, K., Haynes, P. H., Randel, W. J., Holton,
20
J. R., Alexander, M. J., Hirota, I., Horinouchi, T., Jones, D. B. A., Kinnersley, J. S., Marquardt, C., Sato, K., and Takahashi, M.: The quasi-biennial oscillation, Rev. Geophys., 39, 179–229, 2001. 7844
Beyerle, G., Wickert, J., Schmidt, T., and Reigber, C.: Atmospheric sounding by global navi-gation satellite system radio occultation: An analysis of the negative refractivity bias using
25
CHAMP observations, J. Geophys. Res., 109, D01106, doi:10.1029/2003JD003922, 2004. 7839
Gettelman, A. and de Forster, P. M.: A climatology of the tropical tropopause layer, J. Meteorol. Soc. Japan, 80, 911–924, 2002. 7842
ACPD
4, 7837–7857, 2004 GPS radio occultation with CHAMP T. Schmidt et al. Title Page Abstract Introduction Conclusions References Tables Figures J I J I Back Close Full Screen / EscPrint Version Interactive Discussion
EGU Hajj, G. A., Ao, C. O., Iijima, B. A., Kuang, D., Kursinski, E. R., Mannucci, A. J., Meehan, T. K.,
Romans, L. J., de la Torre Juarez, M., and Yunck, T. P.: CHAMP and SAC-C atmospheric oc-cultation results and intercomparisons, J. Geophys. Res., 109, doi:10.1029/2003JD003909, 2004. 7839
5
Healy, S. B. and Eyre, J. R.: Retrieving temperature, water vapour and surface pressure infor-mation from refractive-index profiles derived by radio occultation data: A simulation study, Q. J. R. Meteorol. Soc., 126, 1661–1683, 2000.
Highwood, E. J. and Hoskins, B. J.: The tropical tropopause, Q. J. R. Meteorol. Soc., 124, 1579–1604, 1998. 7842
10
Holton, J. R., Haynes, P. H., McIntyre, M. E., Douglass, A. R., Rood, R. B., and Pfister, L.: Stratosphere-troposphere exchange, Rev. Geophys., 33, 403–439, 1995. 7842,7843 Jensen, A. S., Lohmann, M., Benzon, H. H., and Nielsen, A.: Full Spectrum inversion of radio
occultation signals, Radio Sci., 38(3), doi:10.1029/2002RS002763, 2003. 7839
Kursinski, E. R., Hajj, G. A., Hardy, K. R., Schofield, J. T., and Linfield, R.: Observing Earth’s
15
atmosphere with radio occultation measurements using the Global Positioning System, J. Geophys. Res., 102, 23 429–23 465, 1997. 7838,7839,7841
Melbourne, W. G., Davis, E. S., Hajj, G. A., Hardy, K. R., Kursinski, E. R., Meehan, T. K., and Young, L. E.: The application of spaceborne GPS to atmospheric limb sounding and global change monitoring, JPL Publication, 94–18, Jet Propulsion Laboratory, Pasadena, California,
20
1994. 7838
Nishida, M., Shimizu, A., Tsuda, T., Rocken, C., and Ware, R. H.: Seasonal and longitu-dinal variations in the tropical tropopause observed with the GPS occultation technique (GPS/MET), J. Meteorol. Soc. Japan, 78, 691–700, 2000. 7839
Randel, W. J., Wu, F., and Rios, W. R.: Thermal variability of the tropical tropopause
25
region derived from GPS/MET observations, J. Geophys. Res., 108(D1), 4020, doi:10.1029/2002JD002595, 2003. 7839,7844
Rocken, C., Anthes, R. A., Exner, M., Hunt, D., Sokolovskiy, S., Ware, R., Gorbunov, M., Schreiner, W., Feng, D., Herman, B., Kuo, Y. H., and Zou, X.: Analysis and validation of GPS/MET data in the neutral atmosphere, J. Geophys. Res., 102(D25), 29 849–29 866,
30
1997. 7839
Sausen, R. and Santer, B. D.: Use of changes in tropopause height to detect influences on climate, Meteorol Z, 12(3), 131–136, 2003. 7842,7845
ACPD
4, 7837–7857, 2004 GPS radio occultation with CHAMP T. Schmidt et al. Title Page Abstract Introduction Conclusions References Tables Figures J I J I Back Close Full Screen / EscPrint Version Interactive Discussion
EGU radio occultation with CHAMP: An innovative remote sensing method of the atmosphere,
Adv. Space Res., 33, 1036–1040, 2004a. 7839
Schmidt, T., Wickert, J., Beyerle, G., and Reigber, C.: Tropical tropopause parameters derived from GPS radio occultation measurements with CHAMP, J. Geophys. Res., 109, D13105,
5
doi:10.1029/2004JD004566, 2004b. 7839,7844
Ware, R., Exner, M., Feng, D., Gorbunov, M., Hardy, K., Melbourne, W., Rocken, C., Schreiner, W., Sokolovsky, S., Solheim, F., Zou, X., Anthes, R., Businger, S., and Trenberth, K.: GPS soundings of the atmosphere from low earth orbit: Preliminary results, Bull. Amer. Meteor. Soc., 77, 19–40, 1996. 7839
10
Wickert, J., Galas, R., Beyerle, G., K ¨onig, R., and Reigber, C.: GPS ground station data for CHAMP radio occultation measurements, Phys. Chem. Earth (A), 26, 503–511, 2001a. 7838 Wickert, J., Reigber, C., Beyerle, G., K ¨onig, R., Marquardt, C., Schmidt, T., Grunwaldt, L., Galas, R., Meehan, T. K., Melbourne, W. G., and Hocke, K.: Atmosphere sounding by GPS radio occultation: First results from CHAMP, Geophys. Res. Lett., 28, 3263–3266, 2001b.
15
7840
Wickert, J., Schmidt, T., Beyerle, G., K ¨onig, R., Reigber, C., and Jakowski, N.: The radio occul-tation experiment aboard CHAMP: Operational data analysis and validation of atmospheric profiles, J. Meteorol. Soc. Japan, 82(1B), 381–395, 2004a. 7839,7840,7849
World Meteorological Organisation (WMO): Definition of the tropopause, WMO Bull., 6,
290
ACPD
4, 7837–7857, 2004 GPS radio occultation with CHAMP T. Schmidt et al. Title Page Abstract Introduction Conclusions References Tables Figures J I J I Back Close Full Screen / EscPrint Version Interactive Discussion
EGU Fig. 1. GPS radio occultation principle (afterWickert et al.,2004a).
ACPD
4, 7837–7857, 2004 GPS radio occultation with CHAMP T. Schmidt et al. Title Page Abstract Introduction Conclusions References Tables Figures J I J I Back Close Full Screen / EscPrint Version Interactive Discussion
EGU Fig. 2. Comparison of CHAMP temperature data with nearby radiosondes (distance
∆d≤300 km and time delay ∆t≤3 h) for the period May 2001–May 2004. The dashed lines denote the standard deviation whereas the shaded area shows the ±1 K interval(a). Number of corresponding data points(b).
ACPD
4, 7837–7857, 2004 GPS radio occultation with CHAMP T. Schmidt et al. Title Page Abstract Introduction Conclusions References Tables Figures J I J I Back Close Full Screen / EscPrint Version Interactive Discussion
EGU Fig. 3. Left: Statistical comparison of mean zonal refractivity from CHAMP radio occultation
(product version 005, 55 802 profiles, September 2002 to August 2003) with ECMWF. Right: Data coverage corresponding to left panel: Number of profiles in relation to profile availability at 10 km altitude.
ACPD
4, 7837–7857, 2004 GPS radio occultation with CHAMP T. Schmidt et al. Title Page Abstract Introduction Conclusions References Tables Figures J I J I Back Close Full Screen / EscPrint Version Interactive Discussion
EGU Fig. 4. Monthly means of CHAMP tropical tropopause parameters for the period May 2001–
ACPD
4, 7837–7857, 2004 GPS radio occultation with CHAMP T. Schmidt et al. Title Page Abstract Introduction Conclusions References Tables Figures J I J I Back Close Full Screen / EscPrint Version Interactive Discussion
EGU Fig. 5. CPT temperature for the northern hemisphere winter (a) and summer (b) months based
ACPD
4, 7837–7857, 2004 GPS radio occultation with CHAMP T. Schmidt et al. Title Page Abstract Introduction Conclusions References Tables Figures J I J I Back Close Full Screen / EscPrint Version Interactive Discussion
EGU Fig. 6. Temperature anomalies over the equator region (4◦S–4◦N) from CHAMP
measure-ments for the period May 2001–May 2004. Contours are ±0.5 K. The heavy dashed line shows the monthly-mean CPT altitude.
ACPD
4, 7837–7857, 2004 GPS radio occultation with CHAMP T. Schmidt et al. Title Page Abstract Introduction Conclusions References Tables Figures J I J I Back Close Full Screen / EscPrint Version Interactive Discussion
EGU
(a) (b) (c)
Fig. 7. Comparison of vertical refractivity (a), specific humidty (b) and temperature (c) profiles derived from CHAMP 1Dvar retrieval with radiosonde Lindenberg and ECMWF data. Example for occultation 090, 31 March 2002, 17:04 UTC, 52.80◦N, 12.39◦E.
ACPD
4, 7837–7857, 2004 GPS radio occultation with CHAMP T. Schmidt et al. Title Page Abstract Introduction Conclusions References Tables Figures J I J I Back Close Full Screen / EscPrint Version Interactive Discussion
EGU
(a) (b) (c) (d)
Fig. 8. Statistical comparison (years 2001–2003) of vertical specific humidity profiles from global radiosonde stations with:(a) ECMWF, (b) 1Dvar, (c) 1Dvar using a priori bias corrected refractivity data. Blue line represents bias, red lines standard deviation. Number of compared data points is shown in(d).
ACPD
4, 7837–7857, 2004 GPS radio occultation with CHAMP T. Schmidt et al. Title Page Abstract Introduction Conclusions References Tables Figures J I J I Back Close Full Screen / EscPrint Version Interactive Discussion
EGU
(a) (b)
Fig. 9. (a): CHAMP 1Dvar mean global water vapor distribution at 700 hPa for northern summer conditions (June–August 2003, 9029 data points). (b): Same as (a) but for northern winter (December–February 2002/2003, 9139 data points).