HAL Id: hal-02478582
https://hal.archives-ouvertes.fr/hal-02478582
Submitted on 14 Feb 2020HAL is a multi-disciplinary open access archive for the deposit and dissemination of sci-entific research documents, whether they are pub-lished or not. The documents may come from teaching and research institutions in France or abroad, or from public or private research centers.
L’archive ouverte pluridisciplinaire HAL, est destinée au dépôt et à la diffusion de documents scientifiques de niveau recherche, publiés ou non, émanant des établissements d’enseignement et de recherche français ou étrangers, des laboratoires publics ou privés.
Gilles Lecaillon, Sylvia Agostini, Philippe Lenfant, Jean-Olivier Irisson
To cite this version:
Robin Faillettaz, Raphaël Voué, Romain Crec’Hriou, Laure-Hélène Garsi, Gilles Lecaillon, et al.. Spatio-temporal patterns of larval fish settlement in the northwestern Mediterranean Sea. Marine Ecology Progress Series, Inter Research, In press, �10.3354/meps13191�. �hal-02478582�
SPATIO-TEMPORAL PATTERNS OF LARVAL FISH SETTLEMENT IN THE NORTHWESTERN MEDITERRANEAN SEA
Robin Faillettaz1, Raphaël Voué1, Romain Crec’hriou2, Laure-Hélène Garsi3, Gilles Lecaillon4,
Sylvia Agostini3, Philippe Lenfant2, Jean-Olivier Irisson1*
1 Sorbonne Université, CNRS, Laboratoire d’Océanographie de Villefranche-sur-Mer, LOV, 06230 Villefranche-sur-mer, France 2 CEFREM, UMR5110 CNRS/UPVD, Université de Perpignan, 66860 Perpignan, France
3 Laboratoire Sciences Pour l’Environnement, UMR 6134 CNRS/UCPP, Université de Corse, France 4 Ecocean, 34070 Montpellier, France
*Corresponding author: irisson@normalesup.org
Abstract: Most coastal fish species spend their early life stages in the pelagic environment, before settling in coastal habitats. The variability in the arrival of larvae to coastal habitats provide information on the species’ biology and recruitment potential. To explore the dynamics of larval fish supply to coastal habitats in the NW Mediterranean Sea, 13 sites were monitored using light-traps, from July 2012 to December 2015. Most variation in Catches Per Unit Effort (CPUE) among topographic basins and species were statistically significant for high (quantile 75%) and very high (quantile 90%) catches only. At year scale, CPUE displayed strong seasonality, and three main species assemblages were detected in late spring-early summer, summer and late autumn-early winter. At month scale, CPUE were higher around the new moon for all quantiles and temporally autocorrelated at a lag of about 28 days. Larval supply also varied spatially with site-specific associations, and with riverine influence. All together, these results confirm that the previously described patterns of larval supply observed in tropical and subtropical environments (e.g., the high variability at all spatial and temporal scales and the strong influence of the moon) also apply to Mediterranean fish assemblages. The larval supply in the NW Mediterranean Sea comes out as a solid candidate for monitoring the state of the marine ecosystems, highlighting the need to continue such time series.
Keywords: Fish larvae; larval supply; light-traps; NW Mediterranean Sea; monitoring time series;
1. INTRODUCTION
By the end of their pelagic phase, coastal fish larvae switch from a pelagic to a demersal lifestyle and need to reach a habitat on the coast to settle. While mortality after this settlement phase can
be high (Planes et al. 1998, Almany & Webster 2006), the bulk of the mortality still occurs during the larval phase, with mortality rates ranging from 10% to >70% per day (Houde 2008, White et al. 2014, Johnson et al. 2015). The intensity of larval supply to coastal habitats at settlement often largely determines recruitment success (i.e. settlers that survive and metamorphose into juveniles; Félix-Hackradt et al. 2013) and local population dynamics (Victor 1986b). Monitoring the intensity of settlement may therefore provide valuable information to anticipate the abundance of future fish stocks, for fisheries management and conservation efforts in general (Doherty & Fowler 1994, McLeod & Costello 2017).
The main factors known to influence the intensity of settlement, at a given time in a given location, are: (1) the reproductive periods of adults, often conditioned by temperature, lunar phase, and photoperiod (Robertson 1992, Dixon et al. 1999, D’Alessandro et al. 2007, Tsikliras et al. 2010); (2) hydrodynamics, at all scales (from 1000s km to < 10 m), which can favour retention through inshore-flowing currents, stable eddies, and low flow zones, or favour dispersal through offshore-flowing currents and impair settlement in some areas because of fast-paced currents (reviewed by Pineda et al. 2010); (3) survival of the pelagic stages, including predation pressure that may drastically reduce the larval pool (Planes & Lecaillon 2001, Lecchini et al. 2014); and (4) larval behaviour, as fish larvae can sense their environment and use several cues to select a settlement site and time (Victor 1986a, Dufour & Galzin 1993, Leis et al. 2011, Barth et al. 2015).
Marine Protected Areas (MPA) are established worldwide to protect either habitats, biodiversity or emblematic species (Fernandes et al. 2005). Protected habitats often support higher species richness and diversity (Edgar et al. 2014) and may, in turn, present attractive signal for new settlers. Whether larval supply differs between protected and unprotected sites is poorly known, however, with contrasting results (Valles et al. 2001; Grorud-Colvert & Sponaugle 2009).
Settlement-stage fish larvae of Perciformes species have particularly strong swimming abilities (Leis 2006, Domenici & Kapoor 2010, Faillettaz et al. 2017) and may avoid standard plankton nets (Choat et al. 1993, Carassou & Ponton 2009, Catalan et al. 2014). Since most larval supply to settlement habitats occurs at night (Dufour & Galzin 1993, Mwaluma et al. 2015) and larvae of the majority of species are positively phototactic, light-traps were developed to selectively sample the settlement-stage larvae of coastal species (Doherty 1987a, McLeod & Costello 2017), and provided consistent results across various locations and conditions, such as Australia (Fisher and Bellwood 2002; Doherty 1987), Florida (D’Alessandro et al. 2007, Grorud-Colvert & Sponaugle 2009),
Caribbean (Sponaugle & Cowen 1996), North-East Atlantic (Chícharo et al. 2009), and Mediterranean Sea (Félix-Hackradt et al. 2013).
In the Mediterranean Sea, reproduction is typically seasonal and usually occurs in spring-summer. During this period, the water column is mostly stratified, with low plankton abundance in the surface layer and high phytoplankton and zooplankton biomass around the Deep Chlorophyll Maximum (Sabatés et al. 2007). In offshore waters, the succession of assemblages of young fish larvae is characterised by high abundances and low species richness in late-spring followed by lower abundances along with higher species richness in summer (Álvarez et al. 2012). Later in life, recruitment intensity, evaluated by visual census of young settlers, was found to be correlated with the abundances of juveniles in some species (Garcia-Rubies and Macpherson 1995; Vigliola et al. 1998; Macpherson et al. 1997; Félix-Hackradt et al. 2013), but not in all (Di Franco et al. 2013). Less information is available regarding the crucial stage of settlement for Mediterranean fishes. A single study quantified larval supply to coastal habitats in the South of Spain, on a monthly basis for one year (Félix-Hackradt et al. 2013). Higher larval supply (80% of total catches) and diversity were measured during warmer months, from June to September, which is consistent with seasonal patterns of ichthyoplankton abundance described above (e.g. (Álvarez et al. 2012). However, because of the high variability in recruitment at all temporal and spatial scales, in all habitats where it was studied (Victor 1986; D’Alessandro et al. 2007; Doherty 1987; White & Caselle 2008; Félix-Hackradt et al. 2013), the description of the dynamics of larval supply in the northwestern Mediterranean Sea remains largely incomplete. The present study aims to fill this gap by monitoring and describing the seasonal and basin-scale patterns of larval supply at 13 sites distributed along the northwestern Mediterranean coast, over more than three years (2012-2015).
2. MATERIALS & METHODS 2.1. Study sites
A total of 13 sites were sampled, covering most of the French Mediterranean coast (Fig. 1). Five sites were located in the Ligurian Sea (3 in Corsica, 2 on the French Riviera), while eight were in the Gulf of Lion (5 on the eastern side of the Rhône, 3 on the western side; Fig. 1). The sites covered different ecosystems and levels of anthropisation (Table S1 in the Supplement): Bastia and Leucate were close to large coastal lagoons (respectively Biguglia and Leucate) and over sandy bottoms while all other sites were over rocky bottoms; Vendres, Carry, Les Embiez, Port-Cros, Saint-Florent, and Bonifacio were located within or close to (< 5 km) a Marine Protected
Area (MPA); Agde, Villefranche, La Ciotat, and Cassis were located in areas of limited urbanisation; Marseille and Carry were located within the bay of Marseille, a city of 2 M inhabitants, the most urbanised area along the coast.
The main hydrographical structure of the region is the Liguro-Provençal current, flowing along the 200 m isobath from a few to about 30 km from the shore (Fig. 1b) and between the surface and 150-200 m depth. It is 25 km wide on average and flows at 25-35 cm s-1 towards the south-west
(Béthoux & Prieur 1983, Stemmann et al. 2008). The current is present throughout the year and creates a marked hydrological front that may act as a barrier to offshore dispersal of coastal organisms, along with a near-shore, stochastic counter-current (Pedrotti and Fenaux, 1992), as do other Mediterranean fronts (Galarza et al., 2009).
Figure 1. (a) Location of the sampling region within the Mediterranean Sea, and (b) detailed position of the 13 sampling sites. Orange triangles indicate sites located within or close to MPAs. The two main topographic regions (Gulf of Lion and Ligurian Sea) are indicated, along with the average path of the Liguro-Provençal current (arrows).
2.2. Fish larvae collection
Settlement-stage fish larvae (hereafter referred to as larvae, for brevity) were collected with “Collect by Artificial Reef Eco-friendly” (CARE) light-traps (Lecaillon 2004). Today, light-traps have become a standard tool to quantify the larval supply of many taxa (Doherty 1987a, Thorrold 1990, McLeod & Costello 2017). Light-traps’ efficiency may be reduced by the intensity of ambient moonlight (Hernandez & Shaw 2003), water turbidity and strong currents (Lindquist & Shaw 2005, Chícharo et al. 2009). Predation of fish larvae may also take place inside the light-traps (Vilizzi et al. 2008). These biases, however, seem to be low enough for fish larvae to be caught at all lunar phases and to display clear, species-specific patterns (Hernandez & Shaw 2003).
The CARE light-traps have proven to be effective at capturing fish larvae in the Mediterranean Sea (Catalan et al. 2014; Félix-Hackradt et al. 2013) and elsewhere (Carassou et al. 2009). The traps are composed of a buoyant block with a 55 W LED light floating at the surface, above a 2 m-long conical net made of 2 mm PVC mesh with a funnel in the middle (Fig. S1 in the Supplement). Settling larvae are first attracted to the light and then descend in the net in search of a settlement substrate, in this case, the net; these traps are therefore quite selective (Lecaillon 2004). Still, they occasionally caught fish larvae in the pre-flexion or flexion stages, i.e., that are not ready to settle, as well as juveniles and young adults of strictly pelagic species (e.g., Belonidae, Carangidae, Centrolophidae, Clupeidae, Engraulidae, Myctophidae, and Scombridae). Their occurrences are reported in the full database for completeness (Table S2 in the Supplement) but were excluded from all analyses below to focus on settlement-stage larvae of demersal species only.
Sampling was performed as part of multiple projects with different objectives and the sampling effort was not equivalent at all sites. Many sites were mostly sampled around the new moon (e.g., Bastia, Saint-Florent, Port-Vendres), while others were homogeneously sampled throughout the year (e.g., Villefranche, Leucate). Sampling occurred between July 2012 and December 2015, yet not at all sites, spanning a period of over three years and almost four summers (Fig. S2 in the Supplement), i.e., the main spawning season in the Mediterranean Sea (Tsikliras et al. 2010). Overall, the total sampling effort amounted to 7,036 light-traps-nights (one light-trap-night stands for one light-trap set to fish for one night).
Apart from this heterogeneity in sampling schedule, sampling was strictly comparable among sites: the exact same model of light-trap was used everywhere (same dimensions, net, mesh, led light bulb, etc.); they were set at sea from small motor boats, one to two hours before sunset; in the
morning, light-traps were retrieved as soon as possible, usually within one hour after sunrise. After collection, fish larvae were stored in >30 L white buckets or coolers. In most locations, larvae were caught to be raised in aquaria and later released to reinforce adult populations. Larvae were visually identified and separated per species and night of capture, then raised for a few months. A second identification of the juvenile stages, based on Louisy (2015), allowed to correct any early misidentification. When possible, and after formal identification, juveniles were released alive. In other locations (Port-Vendres, Agde, Port-Cros, Villefranche, Bonifacio and Saint-Florent), larvae were euthanized following ethical standard procedures by cooling their water down (following Mittal & Whitear 1978, Collymore et al. 2014). Each specimen was identified under a stereomicroscope to the lowest taxonomic level, usually species, based on Lo Bianco (1931), Fahay (2007), and Crec’hriou et al. (2015).
2.3. Ancillary data
The list of species caught by CARE light-traps was compared with the list of potentially catchable teleost species along French Mediterranean coasts (Louisy 2015). The moon phase and theoretical illumination at midnight were computed for each sampling night using the date, longitude, and latitude of sampling (Meeus 1988).
2.4. Statistical analyses
2.4.1. Standardisation of catches
Raw abundances were standardized into Catch Per Unit of Effort (CPUE), with "effort" being both number of traps and time fished (e.g. in Doherty, 1987b; Félix-Hackradt et al., 2013b; Strydom, 2003); this CPUE is used in all analyses and always computed as the number of larvae/trap/night/site.
2.4.2. Exploration of taxonomic diversity
The standardisation in CPUE cannot compensate for the underestimation of taxonomic richness at sites with low sampling effort. To compare species richness among sites, species accumulation curves were therefore computed. For each site, they represent the cumulated number of species found for increasing numbers of nights sampled. They were computed from 1000 random permutations of the full dataset, to homogenise the effect of effort along the series (Gotelli & Colwell 2001). Species richness was then compared among sites and MPA proximity, i.e. within or < 5 km to a MPA versus > 5km from a MPA, for a fixed sampling effort (20, 50, and 150 nights)
and p-values for the comparisons among pairs of sites were computed based on the result of the 1000 permutations.
Diversity indices focusing on the relative abundance of species, such as Shannon’s entropy (H) and Pielou’s evenness (J) were computed and compared among sites, regions, and MPA proximity using non-parametric tests since the distribution of residuals was never normal. We also computed regional (beta) diversity using the Whittaker formulation, and tested the different factors (East vs West of the Rhône, Topography and MPA vs no-MPA) with an ANOVA on the dissimilarity matrices. Because most sites have only been sampled during summer months, data were restricted to catches between May to September to test for East vs. W and topographic differences and between June and August for protection-based analyses, when MPAs were sampled.
To explore assemblage composition among sites, years, or months, assemblage matrices were represented graphically using a correspondence analysis. Groups of species displaying similar settlement patterns were objectively delimited through hierarchical clustering, based on Chi-square distance matrices to focus on relative rather than absolute abundances and still be comparable with the correspondence analysis. Yet, even with the Chi-square distance, which is appropriate for abundances and accounts for rare species, results were dominated by the effect of the numerous rare species in the dataset. A subset of 19 species was therefore constituted for such assemblage analyses, with the 12 species with highest CPUE and 7 less abundant species but that were present in at least 7 of the 13 sites, hereafter referred as “meaningful species”. This subset represented 96% of the total catches and 26.4% of the total species richness and was considered representative of the dominant species in the assemblage.
To compare assemblage composition among sites, multivariate analyses of variance by permutations (PERMANOVAs) were performed. They were also based on Chi-square distance matrices and p-values were calculated based on 1000 random permutations (Anderson 2001). Two one-way PERMANOVAs were performed to compare sites located (i) in proximity vs. away from a MPA, (ii) to the east vs. west of the Rhone river and (iii) in the Ligurian sea vs. the Gulf of Lion. The first comparison enables to test for an effect of protection measures on larval supply, while the two latter reflect the most obvious geomorphological and hydrographical shifts in the region. Sites on the west of the Rhône are mostly on sandy bottoms, under the influence of the plume of sediment of this major river, while rocky shores and clearer waters dominate in the east. Sites in the Ligurian Sea are under strong influence of the Liguro-Provençal current, which can flow close
to the coast due to the absence of continental shelf, while sites in the Gulf of Lion are more remote from it.
2.4.3. Exploration of abundances
Fish recruitment, and subsequently settlement, has long been known to be highly variable among years (Hjort 1914), and clustered in time and space within a year (Doherty 1987b). It was also the case here and the data was dominated by null or low catches, with few events of high catches distributed along the series. These rare events may, however, be the most important for the replenishment of coastal populations (Hedgecock 1994). Classic statistical approaches considering only variance around the mean (i.e., parametric) or ranks around the median (i.e., non-parametric) are useless in this situation, because the central tendency only (i.e., the mean or median) is not relevant. Therefore, we chose to base our entire approach on quantile regression (Koenker 2005), with a focus on low catches (quantile 25%, q25), median catches (quantile 50%, q50), high catches (quantile 75%, q75), and extraordinary catches (quantile 90%, q90). Tests on the quantile 50% will provide results relatively similar to non-parametric tests on the median, but the consideration of several quantiles enables to extract additional information from the same data. For example, even if no difference is found in the median larval supply between two sites, significant differences in the quantile 25% would indicate that the two sites still receive a different baseline supply (i.e. events of low larval supply), while differences in the upper quantiles (75% and 90%) would indicate that one site receives more exceptional events of larval supply than the other.
The relationships between quantiles of CPUE and continuous variables (i.e. classic regressions) were tested, and 95% confidence intervals were calculated by bootstrapping with 1000 repetitions. The variance of CPUE quantiles among levels of a categorical variable (i.e. ANOVA) were tested by comparing the model with the explanatory variable included in a null model; significance was computed through an analysis of weighted absolute residuals (Chen et al. 2008), with 1000 repetitions.
Time series of the target quantiles were fitted by locally linear non-parametric regressions: 200 dates were regularly spread along the range of the data; for each date, a linear quantile regression model was fitted with normally-distributed weights centred on the date of interest and spanning a neighbourhood of 20 days; the fitted value was extracted at the point of interest and a 95% confidence interval was computed through bootstrapping with 1000 repetitions.
The influence of the moon phase was tested by computing the mean CPUE per lunar day (i.e. the number of days since the last new moon) for each species. This index of CPUE per lunar day was
scaled to the maximum CPUE among all species to remove differences in total abundance. The target quantiles of these scaled CPUE were linearly regressed against the absolute number of days to or since the new moon (e.g., data from five days before or after the new moon provide two data points for the fifth absolute lunar day), hence assuming a symmetric response of larval supply intensity around the new moon and homogenising differences in sampling effort among sites. To assess the variability in CPUE at multiple temporal scales, quantile-based autocorrelograms (also named “quantilograms”) were computed based on Linton & Whang (2007). Briefly, while classic autocorrelograms consider the pairwise correlations of anomalies to the mean for each temporal lag, quantilograms consider the pairwise correlations of the signs of the anomaly to the selected quantiles (here 25%, 50%, 75%, and 90%) at each temporal lag. They can be interpreted like classic autocorrelograms, e.g. if the correlation values for quantile 90% of CPUE are high until a lag of 5 days, it means that, when an extraordinary catch occurs, there is a high probability that another one will occur again within the next 5 days. We computed quantilograms at the three sites with the highest and most systematic sampling effort (Leucate, Villefranche and Bastia) for the following lags: every day from 1 to 7 days, every two days from 8 days to 1 month, and every five days from 1 month to 1.2 years.
The characteristic arrival date of each species at each site was computed as the mean of the numbers of days since January 1st, weighted by the CPUE of those days. For species settling in winter, with settlement peaks spanning over January 1st, dates were shifted by half a year, providing the mean of the number of days since July 1st for computation. This allowed to correctly fit settlement peaks or to centre the date in the middle of the settlement period for species with a broader settlement phenology, regardless of their settlement period. Then synchronicity among sites was tested with Wilcoxon tests on the characteristic day of arrival. Anomalies were computed by subtracting the average date of arrival, for each species; this way all species can be represented on the same plot, where 0 means “the usual date of arrival”. These statistics were computed for the meaningful species plus all other species common enough across sites to warrant a computation (27 species).
Sarpa salpa was not considered because it has two reproduction periods (Tsikliras et al. 2010) that
would bias the test.
All p-values of pairwise tests were corrected within the tests with the Holm’s statistical correction for multiple testing, and p-values of multiple tests based on the same data were corrected with the Bonferroni correction.
2.4.4. Implementation
All analyses were conducted in R (3.5.1) (R Core Team 2018) with packages tidyverse (Wickham 2017) for data manipulation and plotting, oce (Kelley & Richards 2019) for moon phase calculations,
pastecs (Grosjean & Ibanez 2018) for time series analyses, vegan (Oksanen et al. 2019) for species
composition comparisons, and quantreg (Koenker 2019) for quantile regression. All code and data are freely available, respectively under GNU General Public License v3 and Creative Commons Attribution-ShareAlike 4.0 International license, at https://github.com/jiho/medplanet.
3. RESULTS
3.1. General description of catches
A total of 27 800 settlement-stage fish larvae of demersal species were caught over the course of the study. When excluding zeros (42% of the sampling events), the usual CPUE were still very low, often around 1 larvae/trap/night/site. However, in terms of total number of fishes supplied to the coast, it was the rare, very high CPUE events that contributed the most. Overall, 1 073 “sampling events” (one event = one night fished at one site, regardless the number of light-traps) were recorded in the dataset) and over 50% of the 27 800 larvae were caught during only 23 of those fishing events (2% of the effort); 90% of the catches was reached for only 32% of the sampling effort. In particular, two nights in Corsica resulted in extremely high catches of Spicara smaris (CPUE > 800 larvae/trap/night/site), which dominated everything else.
Among the 51 families, 123 genera, and 218 species of demersal fishes living along the Mediterranean coast of France (Louisy 2015), 59% of families (n = 29) , 39% of genera (n = 48), and 33% of species (n = 72) were caught in CARE light-traps. The most abundant and frequent families among sites were Sparidae (58% of total CPUE), Pomacentridae (16%), Blenniidae (10%), Mullidae (6%), Mugilidae (4%), Atherinidae (2%), and Gadidae (1%), which all together, represent 97% of the total CPUE. The 12 dominant species retained for several analyses accounted for 93% of the total CPUE: S. smaris (44%), Chromis chromis (18%), Mullus surmuletus (7%), Diplodus annularis (5%), Parablennius pilicornis (4%), Pagellus bogaraveo (4%), Sarpa salpa (3%), Pagellus acarne (2%), Oblada
melanura (2%), Atherina hepsetus (2%), Gaidropsarus mediterraneus (2%), and Boops boops (1%).
3.2. Spatial patterns
3.2.1. Total larval supply among sites and regions
Overall, the average larval supply was 4.5 ± 30 larvae/trap/night, with particularly high mean CPUE in Saint-Florent and Bonifacio (mean ± SD CPUE of 17.6 ± 51.0 and 29.7 ± 152, respectively) due to several events of very intense settlement. The highest local taxonomic richness
was observed in Villefranche-sur-Mer (46 taxa), and the lowest in Carry (7 taxa).
The distribution of CPUE among sites (Fig. 2) highlights that five sites yielded high catches (Saint-Florent, Villefranche, Port-Cros, Les Embiez, La Ciotat) and six sites received consistently low larval supply (Bastia, Marseille, Carry, Agde, Port-Vendres, and Leucate). While Bonifacio and Cassis seemed to present above-average CPUE, they showed no statistical differences, probably because of a lower sampling effort at those sites. In detail, the 25% quantile of CPUE (q25, i.e. the CPUE when catches were low) was significantly higher in Saint-Florent than in Bastia, Marseille, and Carry (quantile-based ANOVA: qAOV, all p < 0.05). St-Florent and Villefranche had significantly higher q50 than Bastia, Marseille, and Carry (qAOV, all p < 0.05). For higher catch levels, q75 was significantly lower in Bastia compared to several other sites, while p90 was significantly higher in Villefranche than in Bastia, Marseille, Carry, Agde, Port-Vendres, and Leucate. Finally, Saint Florent, Bonifacio, Villefranche, Port-Cros, Les Embiez, La Ciotat, and Cassis, the group of sites with high supply, were never significantly different from each other at any level of catches (qAOV, all p > 0.05).
Figure 2. Distribution of CPUE per site. CPUE is displayed using standard boxplots (central bar: median, box: 25% to 75% quantiles, whiskers: 95% confidence interval for the median, dots: points outside this interval) and an empty square for the 90% quantile. The plot is truncated at CPUE 18.5 to focus on the most common events, which still encompass more than 90% of the data for nine of the thirteen sites.
Bonifacio (n=176) Bastia (n=1811) Saint Florent (n=215) Villefranche (n=569) Port−Cros (n=202) Les Embiez (n=472) La Ciotat (n=603) Cassis (n=163) Marseille (n=1007) Carry (n=192) Agde (n=247) Leucate (n=1482) Port Vendres (n=197) 0 5 10 15 CPUE
On a broader scale, this translated in the fact that high (q75) and extraordinary (q90) catches were significantly larger at sites located in the Ligurian Sea (q75 = 3 CPUE, q90 = 9.9 CPUE) compared to those located in the Gulf of Lion (q75 = 2 CPUE, q90 = 5.4 CPUE; qAOV both p < 0.01); and also larger for sites located to the east of the Rhone river (q75 = 3 CPUE, q90 = 9.2 CPUE) compared to the west side (q75 = 2 CPUE, q90 = 3.8 CPUE; qAOV both p < 0.001).
3.2.2. Taxonomic diversity among sites and regions
On the species accumulation curves (Fig. 3), Carry showed significantly lower species richness than many other sites (p < 0.05 for 6 sites), at an effort of 20 nights sampled (the largest effort level at which all stations could be compared). At the more meaningful effort levels of 50 and 150 nights, species richness was significantly lower in Bastia compared to Leucate and Villefranche. Besides these differences, other sites did not significantly differ in terms of species richness, when they were comparable.
Diversity indices were not different between sites located in the Ligurian Sea and in the Gulf of Lion (respectively H = 1.16 ± 0.6, J = 0.76 ± 0.2, and H = 1.12 ± 0.5, J = 0.82 ± 0.2; Wilcoxon, all p > 0.05; Table 1), nor between the West or East of the Rhône (respectively H = 1.22 ± 0.5, J
= 0.84 ± 0.1, and H = 1.11 ± 0.6, J = 0.77 ± 0.2; Wilcoxon, all p > 0.05). Similarly, few differences
in diversity indices were found among sites: Pielou’s evenness was significantly different for at least one site, when tested against all sites (Kruskal, Chi2 = 21, p = 0.05), but it was not possible to
identify which one, because the difference was too slight for the less powerful pairwise tests (pairwise Wilcoxon, all p > 0.05). No pattern of ß-diversity emerged at the regional scale (Whittaker formulation of ß-diversity and three ANOVA, each with p > 0.05).
Figure 3. Species
accumulation curves per site (lines) and standard deviation around them (shaded areas).
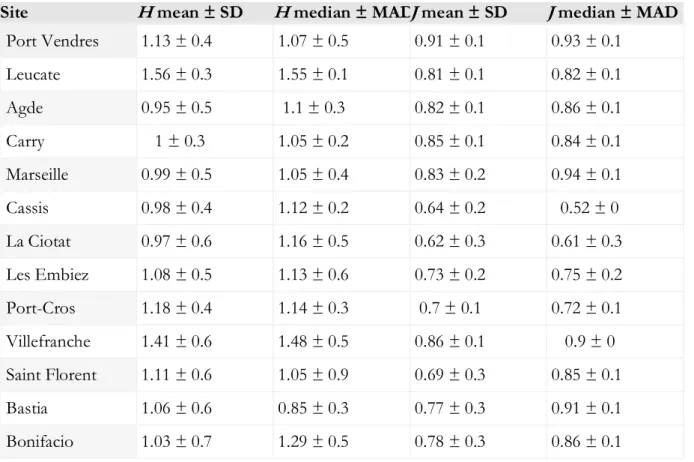
Table 1. Diversity indices (H: Shannon’s diversity, J: Piélou’s evenness) of the sampling sites, computed over the entire period. The mean ± SD and the median ± Median Absolute Deviation (MAD) are provided for each site.
Site H mean ± SD H median ± MAD J mean ± SD J median ± MAD
Port Vendres 1.13 ± 0.4 1.07 ± 0.5 0.91 ± 0.1 0.93 ± 0.1 Leucate 1.56 ± 0.3 1.55 ± 0.1 0.81 ± 0.1 0.82 ± 0.1 Agde 0.95 ± 0.5 1.1 ± 0.3 0.82 ± 0.1 0.86 ± 0.1 Carry 1 ± 0.3 1.05 ± 0.2 0.85 ± 0.1 0.84 ± 0.1 Marseille 0.99 ± 0.5 1.05 ± 0.4 0.83 ± 0.2 0.94 ± 0.1 Cassis 0.98 ± 0.4 1.12 ± 0.2 0.64 ± 0.2 0.52 ± 0 La Ciotat 0.97 ± 0.6 1.16 ± 0.5 0.62 ± 0.3 0.61 ± 0.3 Les Embiez 1.08 ± 0.5 1.13 ± 0.6 0.73 ± 0.2 0.75 ± 0.2 Port-Cros 1.18 ± 0.4 1.14 ± 0.3 0.7 ± 0.1 0.72 ± 0.1 Villefranche 1.41 ± 0.6 1.48 ± 0.5 0.86 ± 0.1 0.9 ± 0 Saint Florent 1.11 ± 0.6 1.05 ± 0.9 0.69 ± 0.3 0.85 ± 0.1 Bastia 1.06 ± 0.6 0.85 ± 0.3 0.77 ± 0.3 0.91 ± 0.1 Bonifacio 1.03 ± 0.7 1.29 ± 0.5 0.78 ± 0.3 0.86 ± 0.1 3.2.3. Species assemblages among sites and regions
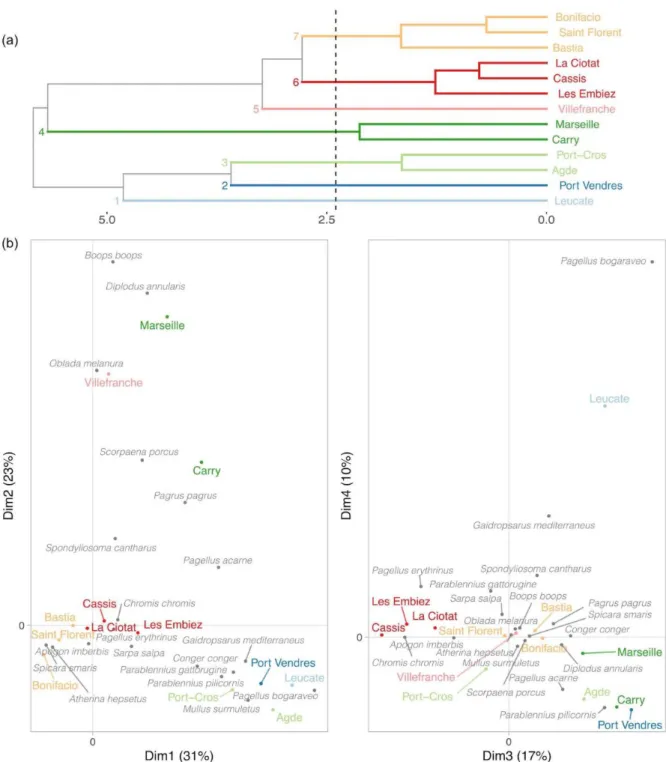
Sites were separated into seven groups according to their assemblage composition (Fig. 4a). Villefranche was characterised by the relative abundance of O. melanura, Leucate of P. bogaraveo, Marseille of D. annularis and B. boops and Carry of P. pagrus and Scorpaena porcus. While most clusters matched geographical patterns, Agde and Port-Cros were associated together (Fig. 4).
On a broader spatial scale, species assemblages were different between the East and West sides of the Rhône river (PERMANOVA, F = 3.8, R2 = 0.25, p = 0.001) but not between the Ligurian Sea
and the Gulf of Lion (F = 1.4, R2=0.09, p > 0.05). At species level, the median CPUE in the Gulf
of Lion and the Ligurian Sea were significantly different for a few species only, mostly in the lower and upper quantiles (quantile-ANOVA, p-values < 0.05 for q25: 8/12 species, median: 3/12 species, q75: 3/12 species, q90: 8/12 species).
Figure 4. Tree of the hierarchical clustering (a) and plots in the four first dimensions of the correspondence analysis (b) computed per site, on species assemblages considering the meaningful species and for summer months only. The proportion of variance explained is given for each dimension (%). Colors indicate sites displaying similar assemblages according to the hierarchical clustering.
Differences between each side of the Rhône were more consistent, with differences in the median catches of all most abundant species, yet only in five over 12 species for most extreme quantiles (Table 2). Overall, A. hepsetus, B. boops, C. chromis, O. melanura, and S. smaris were more abundant in
the Ligurian Sea while P. bogaraveo and P. pilicornis were more abundant in the Gulf of Lion.
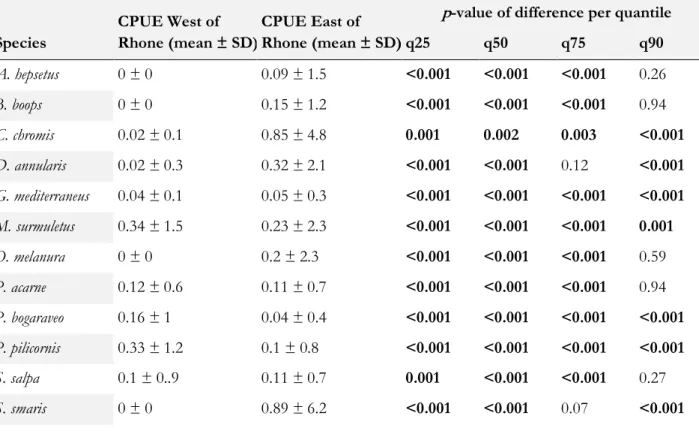
Table 2. CPUE of the dominant species between West and East of the Rhône river. Mean ± SD of CPUE are given for each species in each region, as well as the adjusted p-values of the quantile-PERMANOVA test for differences between regions for each target quantile.
Species
CPUE West of Rhone (mean ± SD)
CPUE East of Rhone (mean ± SD)
p-value of difference per quantile
q25 q50 q75 q90 A. hepsetus 0 ± 0 0.09 ± 1.5 <0.001 <0.001 <0.001 0.26 B. boops 0 ± 0 0.15 ± 1.2 <0.001 <0.001 <0.001 0.94 C. chromis 0.02 ± 0.1 0.85 ± 4.8 0.001 0.002 0.003 <0.001 D. annularis 0.02 ± 0.3 0.32 ± 2.1 <0.001 <0.001 0.12 <0.001 G. mediterraneus 0.04 ± 0.1 0.05 ± 0.3 <0.001 <0.001 <0.001 <0.001 M. surmuletus 0.34 ± 1.5 0.23 ± 2.3 <0.001 <0.001 <0.001 0.001 O. melanura 0 ± 0 0.2 ± 2.3 <0.001 <0.001 <0.001 0.59 P. acarne 0.12 ± 0.6 0.11 ± 0.7 <0.001 <0.001 <0.001 0.94 P. bogaraveo 0.16 ± 1 0.04 ± 0.4 <0.001 <0.001 <0.001 <0.001 P. pilicornis 0.33 ± 1.2 0.1 ± 0.8 <0.001 <0.001 <0.001 <0.001 S. salpa 0.1 ± 0..9 0.11 ± 0.7 0.001 <0.001 <0.001 0.27 S. smaris 0 ± 0 0.89 ± 6.2 <0.001 <0.001 0.07 <0.001
3.2.4. Synchronicity among sites
The date of arrival of the species at each site highlighted a geographical pattern (Fig. 5). On the eastern side, larvae arrived early at several sites (La Ciotat, Villefranche, and Bastia; Wilcoxon, all p < 0.05), except at Port-Cros were they arrived significantly late (Wilcoxon, W = 285, p < 0.05). On the western side, the only significant difference is in Port-Vendres, which is late (Wilcoxon, W = 120, p < 0.01). At larger scale, this translated into earlier arrivals east of the Rhône compared to west of the Rhône (mean lag east = -6.5 days vs mean lag west = +9.1 days; Wilcoxon, W = 1130,
p < 0.01). In contrast, once again, the timing of arrivals did not differ between the Ligurian Sea and
Figure 5. Anomalies in the timing of arrival at each site. Smoothed probability density curves of the anomalies in the arrival dates, computed for each species, year, and site. Stars in the panels’ titles indicate whether lags are significantly different from 0 (i.e. significant early or late arrival at this site; * for adjusted p < 0.05; ** for adjusted p < 0.01). Site “Carry” was removed from the plot since it provided limited information (only 5 species could be considered, which were caught over a single year).
3.2.5. Larval supply to MPAs
Total larval supply was significantly higher around MPAs than away from them for the intense events (q75 = 20.8 CPUE close to MPAs while q75 = 8.7 CPUE away from them, qAOV, F = 44.6, p < 0.05). The difference only approached significance for quantile 90% (q90 = 54.3 vs. 24.8 CPUE; qAOV, F = 70.2, p = 0.074). Low and median larval supply events were never significantly different (median, qAOV, F = 3.69, p = 0.37; q25, qAOV, F = 0.4, p = 0.61). No clear pattern was found for events of median or high intensity of the meaningful species, with some species present at higher abundances around MPAs (e.g., G. mediterraneus, S. smaris) and others in unprotected sites (e.g., S. salpa, P. bogaraveo). Taxonomic richness in larval supply was never significantly different close or away from MPAs, regardless of the sampling effort considered (species accumulation
curves with 1000 permutations for 20 and 50 nights sampled, all p > 0.05). Similarly, diversity indices were comparable (Piélou’s evenness: Wilcoxon, W = 846, p = 0.7; Shannon’s diversity, W = 750, p = 0.06; ß-diversity, ANOVA, F = 0.27, p = 0.61).
3.3. Temporal patterns
3.3.1. Larval supply among years
While summer 2013 was marked by the most extreme catch events of the time series (> 100 larvae/trap/night at a site), over the whole year, catches were higher in 2014 and 2015 for almost all catch levels (pairwise quantile-ANOVA, all p < 0.05; except q50 compared to 2015 and q75 to 2014, both p > 0.05). Contrastingly, CPUE were never significantly different between 2014 and 2015, at all levels (pairwise quantile-ANOVA, all p > 0.05). These differences should not be regarded as an interannual trend (and were not tested as such) because the 3.5-year time series was likely too short for such an interpretation.
3.3.2. Seasonality of larval supply
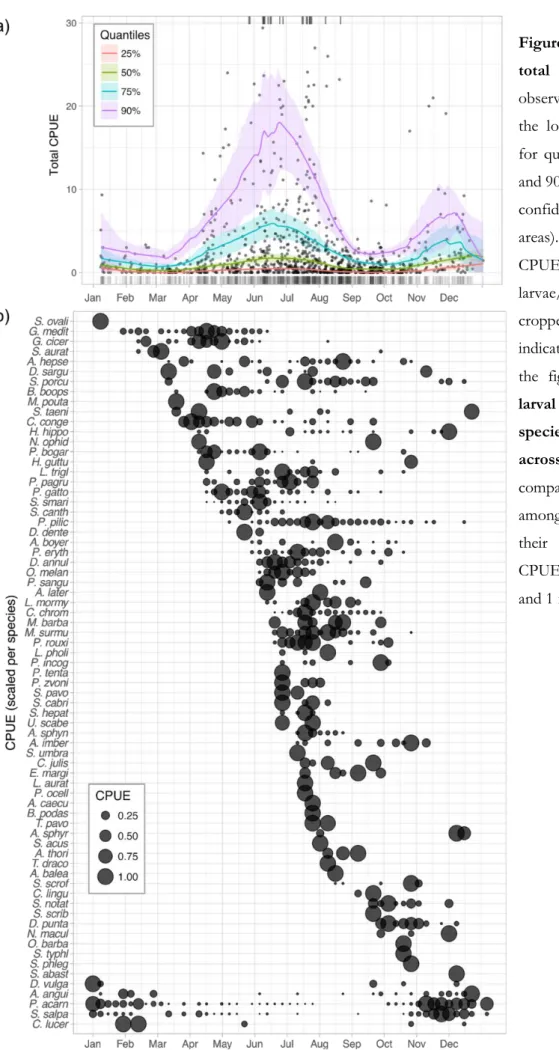
Unsurprisingly, catches were very seasonal (Fig. 6a and Fig. S3 in the Supplement). All particularly high catch events (CPUE > 30 larvae/trap/night/site) occurred between the end of May and mid-August. High and extraordinary catches (quantiles 75% and 90%) display the most marked seasonality but, overall, all quantiles follow the same seasonal pattern (Fig. 6a). The timing of arrival of the species was also very seasonal, with three main temporal assemblages (Fig. 6b and Fig. S5 in the Supplement): the first in late spring-early summer with low diversity and high abundances, the second in summer with high diversity and decreasing abundances, and the third in late autumn-early winter, with low diversity and low abundances. Some species consistently settled over just few weeks (e.g. Epinephelus marginatus, Dentex dentex), many over one or two months (e.g. Spondyliosoma
cantharus, Scorpanea notata), and some for up to four months (e.g. G. mediterraneus, P. pilicornis).
Abundances and diversity were low between January and April. Then abundances increased but diversity stayed low during early spring, from April to late May. In June, diversity and abundance started to increase, before both decreased in August. Abundances were low during the summer-autumn transition (i.e. mid-August to late-October), even though larval diversity remained much higher than during winter period (i.e. January-April). Finally, the November-December peak in CPUE was characterised by few species present in high abundance.
Figure 6. (a) Seasonality in total CPUE. Points are observed CPUEs; lines display the local quantile regressions for quantiles 25%, 50%, 75% and 90%, along with their 95% confidence interval (shaded areas). Catch events with
CPUE >30 fish
larvae/trap/night/site are cropped for plotting and indicated by ticks at the top of the figure. (b) Intensity of larval supply for each species, per week averaged across years. To allow comparison arrival times among species, irrespective of their relative abundances, CPUE was scaled between 0 and 1 for each species.
3.3.3. Influence of the moon
Catches were higher around the new moon, for all levels of catches considered (quantile regression,
p < 0.001 for all quantiles). Still, the influence of the moon was most marked for the highest
quantiles (75% and 90%), which display the steepest slopes (Fig. 7).
Figure 7. Quantile regressions of CPUE on moon phase. CPUE were normalized between 0 and 1 per species to use all species together. They were binned per day since/to the new moon to simplify the plot. Points were slightly jittered horizontally (width=0.5) to avoid overlap. The solid lines and shaded areas represent the quantile regressions and their 95% confidence interval for quantiles 25%, 50%, 75% and 90%. All regressions were significant (***, p < 0.001).
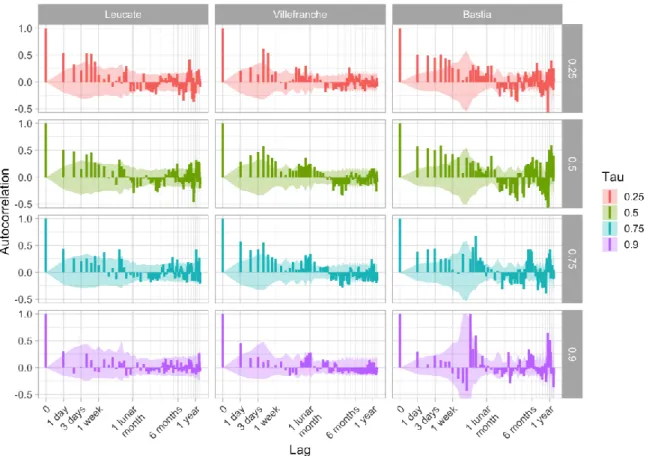
3.3.4. Temporal scales of variability in larval supply
Quantilograms were computed for the three sites where sampling effort was the highest and most homogeneously distributed (Bastia, Villefranche-sur-Mer, and Leucate; Fig. S2 in the Supplement). Larval supply is positively autocorrelated on the scale of a week for quantiles 25%, 50%, and 75% (Fig. 8). When catches are high, they are thus likely to stay high for a week; when they are low, they are likely to stay low for a week. Extraordinary catches (quantile 90%) are significantly autocorrelated at a lag of one day only, which is expected since these events typically do not last long. The influence of the moon, highlighted above, translates into frequent positive autocorrelation around one lunar month. Some seasonal patterns are apparent at larger time scales
but not as consistently as the ones described above.
Figure 8. Quantilograms (i.e. quantile-based correlograms) at the three most sampled sites for lags from 1 day to 1.2 year. Autocorrelation is significant when higher (or lower) than the 95% confidence interval (shaded area). The periodic patterns in the confidence interval are due to sampling: when sampling occurs mostly at regular intervals (Villefranche: 1 week, Bastia: 1 lunar month), some lags are rarely observed and uncertainty increases.
3.3.5. Species assemblages among years and seasons
The correspondence analysis of the fish larvae assemblage among years shows that 2013 was mostly characterised by the high relative abundance of a single species of Sparidae, S. smaris (Fig. S4 in the Supplement), whose abundance peaks were the highest of the series. The year 2014 was associated with a more diverse assemblage mostly comprised of sparids (e.g., B. boops, D. annularis, O. melanura), while 2015 presented higher relative abundances of C. chromis, G. mediterraneus, and Pagellus erythrinus. The same analysis performed per month highlighted three main periods and assemblages: (1) November to February, characterised by high relative abundance of P. acarne and S. salpa; (2) April to June, with a more diverse, less characteristic pool of species; (3) July to September, characterised by high relative abundances of C. chromis, M. surmuletus, P. pilicornis, A. hepsetus, P. erythrinus, and S.
4. DISCUSSION
4.1. Comparison with adult assemblages
In this study, five families constituted 94% of the larval fish assemblages: Sparidae, Pomacentridae, Blenniidae, Mullidae, and Mugilidae which constituted 94% of the catch. This is in general accordance with the assemblages of adults in coastal habitats of the north-western Mediterranean Sea (Guidetti 2000, 2004, García-Charton & Pérez-Ruzafa 2001). Still, there were a few exceptions. For example, the family Gadidae was quite abundant in the larval pool, while rarely observed as adults. Four species (Dicentrarchus labrax, Sparus aurata, Diplodus vulgaris, and Diplodus sargus) were seldom caught as larvae while adults are frequently observed in the region. These species are known to migrate to sandy lagoons during the pelagic phase (Abecasis et al. 2009, Mercier et al. 2012) and, here, only two sites were located close to lagoons, therefore reducing the chances of catching these lagoon-associated species. The fact that few sampled sites were located over sandy bottoms may also explain the limited catches of species associated with sandy substrates, like Soleidae, Bothidae, and Schophtalmidae, which are common as adults (Letourneur et al. 2001).
Light-traps are selective for phototactic larvae only and, within a few families such as Labridae and Scaridae, this may lead to a taxonomic bias and possibly lower sampling efficiency compared to other methods (Meekan et al. 2000). This may further explain the discrepancies between adults and larvae abundances. For example, the Labrus and the Symphodus genera of the Labridae family are abundant over hard substrates throughout the French Mediterranean coast (Guidetti 2000, 2004, García-Charton & Pérez-Ruzafa 2001, Guidetti et al. 2002) and the fact that only 16 specimens were caught in the light-traps over the 27 800 larvae collected is evidence of their selectivity. The global absence of labrids in light-traps may be further attributed to the low mobility of their larvae, which have a short pelagic larval duration and do not undertake ontogenic migrations (Raventos & Macpherson 2005). Unless light-traps are set close to spawning sites, larvae of labrids may therefore be less easily captured than other fish taxa.
4.2. Spatial patterns of larval supply
4.2.1. Larval supply in and away from MPAs
The establishment of MPAs generally increases fish diversity (Rodrigues et al. 2004). Here, intense events of larval supply were over twice stronger at sites around MPAs but taxonomic richness and diversity indices were comparable among protection levels. Both MPAs’ locations and habitat quality within MPAs may favour higher (Grorud-Colvert and Sponaugle 2009) or lower (Valles et al. 2001) larval supply compared to fished areas. Such differences have also been observed the NW
Mediterranean Sea (Lopez-Sanz et al. 2009), yet only at local scale. In this region, the positive influence of MPAs on the intensity of larval supply may therefore occur at both local and larger scale. It is unknown, however, whether the larvae settling close to any of these MPAs originate from the nearby MPA, while such information is critical to enforce and develop the current network of MPAs along the French Mediterranean coast, where connectivity patterns are largely overlooked (Faillettaz et al. 2018).
4.2.2. Larval supply among sites
The similarity in larval assemblages among sites can generally be explained by their geographic proximity (Fig. 4). The rates of larval supply (Fig. 2), the Shannon diversity, and species evenness indices (Table 1) are also likely to be more similar when sites are closer to each other. However, when considering ß-diversity only (i.e. regardless of the spatial patterns of abundance), the diversity appears relatively homogeneous at the regional scale. Larval dispersal may thus occur more frequently as patches at local scale, while at the scale of the study, mixing may be high enough for most species to occur throughout the region.
While most sites were associated based on their geographic proximity, Port-Cros and Agde were associated based on high relative abundances of Mullus surmuletus and parablenniids (Fig. 4b), which is surprising because the two sites are distant, geomorphologically different (rocks surrounded by sand in Agde vs. mostly rock in Cros), and Agde is an area open to fishing while the Port-Cros MPA was created in 1963 and is the oldest in France. Nevertheless, their relatedness may be explained by their potential function as refugia concentrating biodiversity, Port-Cros as a MPA and Agde as the rare rocky substrate within kilometres of sandy bottoms.
Carry and Marseille are located in the highly anthropized bay of Marseille, the second largest city of France, and show the lowest diversity, species evenness, and larval supply (Table 1; Fig. 3; both median CPUE < 0.35 larvae/trap/night/site; Fig. 2). However, this cannot be explained by a biased sampling strategy. Habitat loss and pollutants are known to reduce the quality of marine habitats (Azzurro et al. 2010, Coll et al. 2012), which may result in poor larval supply and diversity in this bay, even in protected areas like the MPA of Carry (Hackradt et al. 2014). Given that larvae of Mediterranean Perciformes possess remarkable behavioural abilities at the settlement stage (Faria et al. 2011, Faillettaz et al. 2015, 2017), this finding also lends support to the active selection of their supply areas, and not just of their settlement site (e.g. at the scale of meters; Carr 1991); if larval supply was driven by passive advection, they would be unaffected by the level of development
and habitat degradation.
4.2.3. Larval supply at basin scale
Larval fish assemblages and the timing of larval supply were both different between the East and West of the Rhône river, but not between the topographic regions defined as the Gulf of Lions and Ligurian Sea. Larval supply was higher, with more exceptional events (quantiles 75% and 90%), in the East compared to the West of the study region, while fisheries are considered more productive in the West (SIH Ifremer 2016). Further data are required to compare adults with larvae abundance from the fisheries, yet, sites located under the Rhône’s influence may experience higher variability due to the changing riverine inputs (Gatti et al. 2006) and may display higher seasonal and interannual variability (Thibaut et al. 2005) to which early larval stages of coastal species may be particularly sensitive. The Rhône may therefore induce a major shift in the longitudinal gradient of larval supply observed along the French Mediterranean coast.
4.3. Temporal patterns of larval supply
A strong seasonality was detected with two peaks of particularly high catches from mid-April to mid-August and from November to December (Fig. 6a). Species richness increases from March until July (48 species) and remains high until September (≥ 34 species per month from June to September); it decreases from October onwards and remains low throughout the winter (≤ 12 species per month). These seasonal patterns of larval supply are consistent as most larvae were caught within one to two months of their reported spawning period in the NW Mediterranean or Adriatic Sea (Tsikliras et al. 2010). Such patterns had already been observed, albeit over shorter periods, in previous studies conducted in the region on settlement stage fish larvae (Félix-Hackradt et al. 2013) and on younger ichthyoplankton (Álvarez et al. 2012). Omitting pelagic species, as it was done in the current study, the peak of larval supply occurred in the same months, from May to July. These seasonal patterns in larval supply is thus consistent throughout the western Mediterranean Sea.
It has long been suggested that fish larvae are strongly predated upon by visual predators during settlement and that settlement around the new moon, when light levels are lowest, has been selected because it increases survival (Johannes 1978, Leis & Carson-Ewart 1998, Planes & Lecaillon 2001, Doherty et al. 2004). The influence of the moon phase on larval supply is well described (Doherty 1987b, Milicich 1994, Sponaugle & Cowen 1996, Wilson 2001, Mwaluma et al. 2015) but had never been assessed explicitly in the Mediterranean. Félix-Hackradt et al. (2013) sampled around the 1st
and 3rd quarter moons only, and still detected a slight a preference towards lower illumination levels. With extensive sampling throughout the lunar month, our results confirm that larval supply is higher around the new moon (Fig. 7). This relationship was significant for all quantiles, which was rare in the rest of our analyses, and was the strongest for the higher quantiles (75% and 90%), indicating that massive supply events are much more likely to occur around the new moon than during other lunar phases. While tides and lunar phase interact with larval supply in tropical environments (D’Alessandro et al. 2007), tides are negligible in the NW Mediterranean Sea. Unlike elsewhere, fish larvae may rely on signals other than tidal cues to trigger their transition from the pelagic environment to coastal habitats. A one-week, high-frequency sampling experiment in one of the sites (Villefranche-sur-Mer) showed that fish larvae settled primarily during the moonless hours of darkest night (Faillettaz 2015), further supporting that active selection in the timing of settlement may also occur in temperate fish larvae.
Light-trap efficiency may be reduced during moonlit nights (Hernandez & Shaw 2003). However, this influence of the moon on settlement patterns has been confirmed by other sampling methods (Dufour & Galzin 1993). Catalan et al. (2014) compared the CARE light traps in the NW Mediterranean Sea, and found them efficient; but all tests were conducted around the new moon. Even if unlikely, a direct influence of external light on the catching efficiency cannot be ruled out. Quantilograms enabled us to explore the variability of catches at multiple temporal scales, from which three main patterns have emerged. Over the longer time scale, the positive correlations at 6-month and one-year lags, and the negative correlations at 3-6-month lag (Fig. 8), are caused by the two seasonal peaks of settlement, in summer and winter (Fig. 6). At finer scale, the influence of the moon is visible at one lunar month. Yet, the strongest and most systematic positive correlations occurred within the first 7 days, while correlation vanished in the following two weeks; for high quantiles, the positive correlations are significant over even shorter periods, indicating that high settlement events are very transient. With the 5% richest events yielding >50% of the total catch, larval supply in the NW Mediterranean Sea is dominated by pulses of high settlement occurring over a couple of days, around the new moon, in spring and to a lesser extent winter. In tropical environments, the replenishment of coral fish populations is also driven by local pulses of settlement (Doherty 1987). The causes of such events are not known and likely result from the spawning patterns, hydrodynamic processes and the active control of their arrival time by larvae through swimming (Victor 1984), since several of these species have this potential (Faillettaz et al., 2015, 2017). While we cannot distinguish the causes of the spatio-temporal variability in larval
supply, the sweepstakes reproductive success hypothesis, which states that the replenishment of marine populations and their genes flow are driven by extreme events (Hedgecock 1994, Christie et al. 2010, Riquet et al. 2017), may apply to demersal fish populations in the western Mediterranean Sea. This hypothesis could be tested by comparing the genetic structure of our largest cohorts to the genetic pool of a reference population in the northwestern Mediterranean Sea.
4.4. Emblematic species
Maintaining this type of sampling over long-term studies can also be used to monitor relative changes in the settlement of some endangered or managed species. For example, 23 dusky grouper larvae, Epinephelus marginatus, were caught: in 2013 in the MPA of Port-Cros (n = 10), in 2014 in Villefranche (n = 2) and the MPA of Les Embiez (n = 2), and in 2015 in La Ciotat (n = 1) and Cassis (n = 9; Table S2 in the Supplement). Dusky groupers are emblematic, large top-predators which were highly targeted by spearfishers in the French Mediterranean until a moratorium was established in 1993 (Prato et al. 2013). No successful reproduction was observed in the region until 1990 (Chauvet & Francour 1990) and the recurrent presence of larvae of this rare species in the settlement pool, both inside and outside MPAs (Faillettaz et al. 2018) likely results from the recovery of adult populations observed along the French coast (Ganteaume & Francour 2007). European eels (Anguilla anguilla) and gilthead seabreams (S. aurata) migrate towards lagoons to settle (Mercier et al. 2012). The sampling site in Leucate, which is located near the entrance of the large “Étang de Leucate” lagoon, was the only one where those species were regularly collected (44 glass eels and 15 S. aurata larvae; Table S2 in the Supplement). Both species suffer intense fishing pressure due to their high commercial value and are the focus of numerous studies (e.g., Koumoundouros et al. 2009, Faria et al. 2011, Díaz-Gil et al. 2017, Naisbett-Jones et al. 2017, Cresci et al. 2017). The site in Leucate therefore appears as a good candidate to study the early life stages of these species in the region.
5. CONCLUSION
This study describes the spatio-temporal patterns of larval supply of 72 demersal fish species to 13 sites distributed throughout the French Mediterranean coast, over more than three years. Thanks to a novel quantile-based analysis, it highlights higher supply to the regions located east of the Rhône river, which is surprising because fisheries yield is lower there, and around MPAs. No large-scale patterns in species diversity indices emerge but the composition of the larval pool is strongly linked to geographical locations and their geomorphological characteristics. While the connectivity
within the Ligurian Sea is high (Faillettaz et al. 2018), further studies focusing on the connectivity both within and among the Gulf of Lion and the Ligurian Sea, using the patterns of larval supply described here, would enable to conclude on the potential role of source or sink of these sites and regions. Temporally, settlement is extremely sporadic with frequent null to low catches and few short events of very high supply, often around the new moon and in the spring; these events are likely to have sweepstakes consequences for future populations. The timing of settlement seems controlled by climatic events at the scale of the basin, with clear synchronicity among sites. Incidentally, it also shows that quantile-based analysis is an efficient tool to detect patterns in such episodic data, where large events can have disproportionate importance, and when time series are too short to focus on the mean larval supply only, to detect spatio-temporal patterns.
These results can serve to guide further studies: fishing effort should focus around the new moon if the goal is to catch more larvae (for population replenishment purposes, for example, e.g., Bell et al. 1999), but monitoring studies should cover various locations and moon phases to correctly represent the full diversity of Mediterranean coastal fishes. The monitoring larval fish settlement could provide a relevant, relatively cheap, and actionable (for fisheries) indicator of ecosystem state as demanded by the Marine Strategy Framework Directive to european countries (MSFD 2008/56/EC). Because of the episodicity of larval supply and the long term fluctuations that have been known to occur in fisheries for over a century (Hjort 1914), only continued monitoring will allow us to detect and understand temporal fluctuations in marine fish populations (Giron-Nava et al. 2017). Although still too short to address interannual differences in larval supply (only 3 years sampled), monitoring at such high intensity had to be stopped at most sites, due to lack of long-term funding on this spatio-temporal scale. Fortunately, it continued for four more years in the bay of Villefranche-sur-Mer and still goes on around Marseille.
Acknowledgments
The authors are grateful to everyone who participated in the sampling, in particular the professional ship captains. Samples were collected under permits delivered by the Direction interrégionale de la mer Méditerranée: n°36 to the Observatoire Océanologique de Villefranche-sur-Mer (permanent) and n°347 in 2012, n°31, 433, 880 and 881 in 2013, n°457 in 2014 to CEFREM and Stella Mare labs. This project was supported by Life+ (project SUBLIMO), GIREL, CasCioMar and the Partner University Fund (PUF) as well as a doctoral fellowship provided by the French Ministry for Education and Research (n°247/2012).
References
Abecasis D, Bentes L, Erzini K (2009) Home range, residency and movements of Diplodus sargus and Diplodus vulgaris in a coastal lagoon: Connectivity between nursery and adult habitats. Estuarine, Coastal and Shelf Science 85:525–529
Almany GR, Webster MS (2006) The predation gauntlet: early post-settlement mortality in reef fishes. Coral Reefs 25:19–22
Álvarez I, Catalán IA, Jordi A, Palmer M, Sabatés A, Basterretxea G (2012) Drivers of larval fish assemblage shift during the spring-summer transition in the coastal Mediterranean. Estuarine, Coastal and Shelf Science 97:127–135
Anderson MJ (2001) Permutation tests for univariate or multivariate analysis of variance and regression. Can J Fish Aquat Sci 58:626–639
Azzurro E, Matiddi M, Fanelli E, Guidetti P, La Mesa G, Scarpato A, Axiak V (2010) Sewage pollution impact on Mediterranean rocky-reef fish assemblages. Mar Environ Res 69:390–397 Barth P, Berenshtein I, Besson M, Roux N, Parmentier E, Lecchini D (2015) From the ocean to
a reef habitat : how do the larvae of coral reef fishes find their way home ? A state of art on the latest advances. Vie et Milieu 65:91–100
Bell J, Doherty P, Hair C (1999) The capture and culture of postlarval coral reef fish: potential for new artisanal fisheries. SPC Live Reef Fish Information Bulletin:59–59
Béthoux JP, Prieur L (1983) Hydrologie et circulation en Méditerranée nord-occidentale. Pétroles et Techniques 299:25–34
Carassou L, Mellin C, Ponton D (2009) Assessing the diversity and abundances of larvae and juveniles of coral reef fish: a synthesis of six sampling techniques. Biodivers Conserv 18:355– 371
Carassou L, Ponton D (2009) Relative importance of water column vs zooplankton variables in the determination of late-stage larval fish assemblage structure in coastal waters of a coral reef lagoon. Sci Mar 73:73–84
Carr MH (1991) Habitat selection and recruitment of an assemblage of temperate zone reef fishes. Journal of Experimental Marine Biology and Ecology 146:113–137
Catalan IA, Dunand A, Álvarez I, Alos J, Colinas N, Nash RDM (2014) An evaluation of sampling methodology for assessing settlement of temperate fish in seagrass meadows. Medit Mar Sci 15:338–349
Chauvet C, Francour P (1990) Les mérous Epinephelus guaza du Parc National de Port-Cros (France) : Aspects socio-démographiques. Bulletin de la Société Zoologique de France 114:5– 13
Chen K, Ying Z, Zhang H, Zhao L (2008) Analysis of least absolute deviation. Biometrika 95:107–122
Chícharo L, Faria A, Morais P, Amaral A, Mendes C, Chícharo MA (2009) How to sample larval fish for taxonomical and ecophysiological studies in shallower temperate coastal ecosystems? Cahiers de Biologie Marine 50:311–318
Choat HJH, Doherty PPJ, Kerrigan BB, Leis JJM (1993) A comparison of towed nets, purse seine and light-aggregation devices for sampling of larvae and pelagic stages of coral reef fishes. Fishery Bulletin-pages: 91: 195-209
Christie MR, Johnson DW, Stallings CD, Hixon MA (2010) Self-recruitment and sweepstakes reproduction amid extensive gene flow in a coral-reef fish. Mol Ecol 19:1042–1057
Collymore C, Tolwani A, Lieggi C, Rasmussen S (2014) Efficacy and safety of 5 anesthetics in adult zebrafish (Danio rerio). J Am Assoc Lab Anim Sci 53:198–203
Coll M, Piroddi C, Albouy C, Ben Rais Lasram F, Cheung WWL, Christensen V, Karpouzi VS, Guilhaumon F, Mouillot D, Paleczny M, Palomares ML, Steenbeek J, Trujillo P, Watson R, Pauly D (2012) The Mediterranean Sea under siege: spatial overlap between marine
biodiversity, cumulative threats and marine reserves. Global Ecology and Biogeography 21:465–480
Crec’hriou R, Lenfant P, Agostini S, Bastien R, Bracconi J, Durieux ED, Garsi L-H, Ternengo S, Briot L, Lozano L, Others (2015) Atlas des Post-Larves de poissons de Méditerranée
Occidentale (R Crec’hriou and P Lenfant, Eds.). Programme Life+ Sublimo
Cresci A, Paris CB, Durif CMF, Shema S, Bjelland RM, Skiftesvik AB, Browman HI (2017) Glass eels (Anguilla anguilla) have a magnetic compass linked to the tidal cycle. Sci Adv 3:e1602007 DAlessandro E, Sponaugle S, Lee T (2007) Patterns and processes of larval fish supply to the
coral reefs of the upper Florida Keys. Mar Ecol Prog Ser 331:85–100
Díaz-Gil C, Cotgrove L, Smee SL, Simón-Otegui D, Hinz H, Grau A, Palmer M, Catalán IA (2017) Anthropogenic chemical cues can alter the swimming behaviour of juvenile stages of a temperate fish. Mar Environ Res 125:34–41
283:1528–1530
Di Franco A, Di Lorenzo M, Guidetti P (2013) Spatial patterns of density at multiple life stages in protected and fished conditions: An example from a Mediterranean coastal fish. Journal of Sea Research 76:73–81
Doherty PJ (1987a) Light -traps: selective but useful devices for quantifying the distributions and abundances of larval fishes. Bulletin of Marine Science 41:423–431
Doherty PJ (1987b) The replenishment of populations of coral reef fishes, recruitment surveys, and the problems of variability manifest on multiple scales. Bulletin of Marine Science 41:411– 422
Doherty PJ (1987c) The replenishment of populations of coral reef fishes, recruitment surveys, and the problems of variability manifest on multiple scales. Bulletin of Marine Science 41:411– 422
Doherty PJ, Dufour V, Galzin R, Hixon MA, Meekan MG, Planes S (2004) High mortality during settlement is a population bottleneck for a tropical surgeonfish. Ecology 85:2422–2428
Doherty P, Fowler T (1994) An empirical test of recruitment limitation in a coral reef fish. Science 263:935–939
Domenici P, Kapoor B (Eds) (2010) Fish Locomotion. Science Publishers
Dufour V, Galzin RR (1993) Colonization patterns of reef fish larvae to the lagoon at Moorea Island, French Polynesia. Marine Ecology Progress Series 102:143–152
Edgar GJ, Stuart-Smith RD, Willis TJ, Kininmonth S, Baker SC, Banks S, Barrett NS, Becerro MA, Bernard ATF, Berkhout J, Buxton CD, Campbell SJ, Cooper AT, Davey M, Edgar SC, Försterra G, Galván DE, Irigoyen AJ, Kushner DJ, Moura R, Thomson RJ (2014) Global conservation outcomes depend on marine protected areas with five key features. Nature 506:216–220
Fahay MP (2007) Early stages of fishes in the Western North Atlantic Ocean. Northwest Atlantic Fisheries Organization
Faillettaz R, Blandin A, Paris CB, Koubbi P, Irisson J-O (2015) Sun-Compass Orientation in Mediterranean Fish Larvae. PLoS ONE 10:e0135213
Faillettaz R, Durand E, Paris CB, Koubbi P, Irisson J-O (2017) Swimming speeds of Mediterranean settlement-stage fish larvae nuance Hjort’s aberrant drift hypothesis. Limnology and Oceanography
Faillettaz R, Gilletta L, Petit F, Francour P, Irisson J-O (2018) First records of dusky grouper
Epinephelus marginatus settlement-stage larvae in the Ligurian Sea. Journal of Oceanography,
Research and Data 10:1–6
Faillettaz R, Paris CB, Irisson J-O (2018) Larval Fish Swimming Behavior Alters Dispersal Patterns From Marine Protected Areas in the North-Western Mediterranean Sea. Front Mar Sci 5
Faria AM, Chícharo MA, Gonçalves EJ (2011) Effects of starvation on swimming performance and body condition of pre-settlement Sparus aurata larvae. Aquat Biol 12:281–289
Félix-Hackradt FC, Hackradt CW, Treviño-Otón J, Pérez-Ruzafa A, García-Charton JA (2013) Temporal patterns of settlement, recruitment and post-settlement losses in a rocky reef fish assemblage in the South-Western Mediterranean Sea. Mar Biol 160:2337–2352
Félix-Hackradt FC, Hackradt CW, Treviño-Otón J, Segovia-Viadero M, Pérez-Ruzafa A, García-Charton JA (2013) Environmental determinants on fish post-larval distribution in coastal areas of south-western Mediterranean Sea. Estuarine, Coastal and Shelf Science 129:59–72
Fernandes L, Day JON, Lewis A, Slegers S, Kerrigan B, Breen DAN, Cameron D, Jago B, Hall J, Lowe D, Innes J, Tanzer J, Chadwick V, Thompson L, Gorman K, Simmons M, Barnett B, Sampson K, De’Ath G, Mapstone B, Stapleton K (2005) Establishing Representative No-Take Areas in the Great Barrier Reef: Large-Scale Implementation of Theory on Marine Protected Areas. Conserv Biol 19:1733–1744
Fisher R, Bellwood DR (2002) A light trap design for stratum-specific sampling of reef fish larvae. 269:27–37
Franco A, Franzoi P, Malavasi S, Riccato F, Torricelli P (2006) Fish assemblages in different shallow water habitats of the venice lagoon. Hydrobiologia 555:159–174
Ganteaume A, Francour P (2007) Evolution of the Dusky Grouper population (Epinephelus
marginatus) between 1997 and 2005 in a non-protected area (Gulf of La Ciotat, France, NW
Mediterranean)
García-Charton JA, Pérez-Ruzafa A (2001) Spatial pattern and the habitat structure of a Mediterranean rocky reef fish local assemblage. Mar Biol 138:917–934
Garcia-Rubies A, Macpherson E (1995) Substrate use and temporal pattern of recruitment in juvenile fishes of the Mediterranean littoral. Marine Biology 124:35–42