HAL Id: hal-00317662
https://hal.archives-ouvertes.fr/hal-00317662
Submitted on 23 Sep 2004
HAL is a multi-disciplinary open access
archive for the deposit and dissemination of
sci-entific research documents, whether they are
pub-lished or not. The documents may come from
teaching and research institutions in France or
abroad, or from public or private research centers.
L’archive ouverte pluridisciplinaire HAL, est
destinée au dépôt et à la diffusion de documents
scientifiques de niveau recherche, publiés ou non,
émanant des établissements d’enseignement et de
recherche français ou étrangers, des laboratoires
publics ou privés.
Measurement of rotational temperature at Kolhapur,
India
G. K. Mukherjee, N. Parihar
To cite this version:
G. K. Mukherjee, N. Parihar. Measurement of rotational temperature at Kolhapur, India. Annales
Geophysicae, European Geosciences Union, 2004, 22 (9), pp.3315-3321. �hal-00317662�
SRef-ID: 1432-0576/ag/2004-22-3315 © European Geosciences Union 2004
Annales
Geophysicae
Measurement of rotational temperature at Kolhapur, India
G. K. Mukherjee and N. PariharIndian Institute of Geomagnetism, New-Panvel (W), Navi Mumbai 410 218, India
Received: 3 October 2003 – Revised: 14 May 2004 – Accepted: 25 May 2004 – Published: 23 September 2004 Part of Special Issue “Equatorial and low latitude aeronomy”
Abstract. Measurements of the hydroxyl rotational
tem-perature for the (8,3) Meinel band have been reported from the observations of the ratio of the relative intensities of P1(2) and P1(4) lines of the OH(8,3) band at Kolhapur
(16.8◦N, 74.2◦E, dip lat. 10.6◦N) in India during the pe-riod 1 November 2002–29 April 2003 using tilting-filter pho-tometers. Mean values of rotational temperature have been computed for 60 nights. The monthly mean value of tem-perature lies in the range 194(±11)–208(±18) K. The mean rotational temperature obtained from all the measurements was found to be 202±15 K. The results agree with other low-latitude measurements of rotational temperature using photo-metric airglow techniques. Quasi-periodic fluctuations with a period of about one to two hours have been prominent on many nights. Furthermore, the results show the general agreement between observations and model (MSIS-86) pre-dictions.
Key words. Atmospheric composition and structure (middle
atmosphere – composition and chemistry; pressure, density and temperature) – History of geophysics (atmospheric sci-ences)
1 Introduction
In order to understand the upper atmospheric variability it is essential to measure accurately the temperature and density profiles in the mesospheric region.
The rotational-vibrational bands (550 nm–4.4 µm) of hy-droxyl in the night airglow have been discovered by Meinel (1950). A large number of observations of the OH intensity and rotational temperature have been made us-ing ground based photometers, scannus-ing spectrophotometers, rockets and satellites (Sivjee et al., 1972; Meriwether, 1974; Takahashi et al., 1974, 1984, 1999; Takahashi and Batista, 1981; Abreu and Yee, 1989). Using different vibrational bands, these observations made attempts to find diurnal and
Correspondence to: G. K. Mukherjee
seasonal variations in OH intensity and rotational tempera-ture at low-, mid- and high-latitude regions. However, the work done in the low-latitude region is extremely rare.
OH emissions follow peculiar profiles according to their source constituents. The rotational temperature of this molecular emission is the excitation temperature which is derived from the distribution of population in the rotational levels of the upper vibrational state (v). For the excited OH∗ molecule, radiative lifetime falls between extremes of 3 ms for v=9 vibrational state to 63 ms for v=1 state. On the contrary, the collision frequencies within the mesosphere gives inter collision time 0.1 ms sufficient for thermalization of the emitting OH molecules. It is thus assumed that the vibrationally excited OH molecules are in thermal equilib-rium and hence the rotational temperature determined spec-troscopically may be taken to be the neutral temperature of the emitting region.
The Meinel band hydroxyl emits radiation so that the ex-cited hydroxyl radicals (OH∗) immediately transfer to the lower stable energy level. OH∗is considered to be produced by the following reactions:
O3+H → OH∗(v ≤ 9) + O2 (R1)
HO2+O → OH∗(v ≤ 6) + O2 (R2)
O∗2+H → O + OH∗ (R3) OH∗(v) → OH∗∗(v0) +hν(550 nm−4.4 µm), (R4) where ∗and∗∗ indicate that the molecule is in the state of
excitation and v and v0 indicate the order of states of the
molecule. The peak altitude of the OH emission layer was observed to be ∼86 km with a layer width of ∼11 km (Kub-ota et al., 1999).
The rotational temperature is believed to provide a reason-able estimate of the temperature in the 80–100 km altitude range. The airglow technique is a simple inexpensive method of measurement of rotational temperature. Long-term tem-perature observations are particularly useful in the detection of climate changes of terrestrial (green house effects) or ex-traterrestrial (solar activity) origin. Using a self-consistent
3316 G. K. Mukherjee and N. Parihar: Measurement of rotational temperature at Kolhapur, India
model of the global mean structure of the mesosphere, ther-mosphere and ionosphere, Roble and Dickinson (1989) have reported that variations in lower atmospheric concentrations of CO2and CH4were found to have a profound influence on
the global mean thermal and compositional structure of the mesosphere and thermosphere.
The observations of nightglow intensity variations of the OH(8,3) band emission were carried at Kolhapur (16.8◦N,
74.2◦E) in the zenith on clear, moonless nights during the
period November 2002–April 2003. The primary objective was to determine the diurnal and seasonal variation of the rotational temperature and validate it with other low-latitude measurements.
The OH(8-3) band was commonly used for hydroxyl tem-perature measurements in past years for high- and low- lat-itude regions (Agashe et al., 1977; Takahashi et al., 1974, 1999; Takahashi and Batista, 1981; Myrabo, 1984; Sivjee and Hamwey, 1987). The hydroxyl airglow OH(8-3) band measurements have also been made in Antarctica (Stubbs et al., 1983; Williams, 1996). In order to understand this spec-tral region, with the possibility of recovering more accurate information on rotational temperatures at low latitude region, this study was undertaken.
Abreu and Yee (1989) have presented results from a study of diurnal and seasonal variations in the nighttime OH(8,3) emission at low latitudes using data from the AE-E satellite. Diurnal variations of OH emission intensity have been stud-ied by many observers (Wiens and Weill, 1973; Takahashi et al., 1977; Abreu and Yee, 1989). Generally, most of them have found out the nocturnal variation of OH intensity maxi-mizes early in the night and decreases towards dawn. The de-crease in OH intensity from sunset to sunrise was explained by photochemical models as being due to decreasing con-centrations of odd hydrogen and odd oxygen as a result of the absence of photolysis of O2and H2O (Abreu and Yee,
1989). There is a great variability in the diurnal behaviour in low- and mid-latitudes. There are four different types of nocturnal variations of temperature as observed by Agashe et al. (1989) at a low-latitude station, Pune (18◦N, 73◦E)
in India. The monthly mean temperature of the mesopause region over Pune was found to be 195±10 K. Also, the rota-tional temperature was found to be higher in winter than in summer.
Airborne and ground-based observations of (7,2) and (8-3) bands of OH have been made using a one-meter scan-ning spectrophotometer by Sivjee et al. (1972). The rota-tional temperature derived from the P1and P2branches of
the OH(8,3) spectrum were varying between 150 to 200 K. Watanabe and Nakamura (1981) reported the rocket mea-surements of O2 atmospheric band and OH Meinel Bands
in the airglow at 31◦N latitude to study the composition of the airglow emitting layer. The OH(6,2) band was monitored at Davis in Antarctica (Greet et al., 1998) during 1990 using a Czerny-Turner spectrometer. An average temperature of 221±2 K was obtained from a selected data set of 104 spec-tra.
2 Instrumentation and theory
The measurements were made using two tilting-filter pho-tometers. The basic objective of the design of the pho-tometers was to sufficiently separate the signal due to air-glow from the background emission. In this mechanism both signal and background emissions were allowed to pass through the filter in normal and tilted modes. In the lat-ter case, passband of the fillat-ter is shifted to the lower wave-length side so that only the background light is transmitted. The difference between the two measurements would give rise to a signal at a given instant (Mukherjee and Dyson, 1992). The different values for the wavelength of the individ-ual lines of the hydroxyl (8,3) band appear in the literature (Stubbs et al., 1988). The central wavelengths (731.64 nm and 736.95 nm) of the filters were chosen to measure the intensities of the P1(2), P1(4) lines of this band (Stubbs et
al., 1983). The ratio between these two lines was used to obtain the rotational temperature assuming thermal equilib-rium. The tilting-filter photometer measures the column in-tensities of two selected components against the background produced by narrow continuum and scattered light. The passband of the filters (manufactured by Andover Corpora-tion, U.S.) used were 0.25 nm. Filters have peak transmis-sion ∼65% and aperture diameter 5 cm. An EMI 9658B photo multiplier tube cooled to −30◦C was used as the de-tector. An application of a tilting-filter photometer for the ground-based measurements of the atmospheric temperature has been described earlier by Meriwether (1975). Schaffer and Fastie (1972) also used a similar method for temperature measurement using a tilting-filter photometer in a rocket.
Theoretically, the intensities of the lines are related to the rotational temperature (Mies, 1974; Stubbs et al., 1983; Takahashi et al., 1999) in the following way:
I(J00,v00←J0,v0) = NA(J 00,v00←J0,v0)2(2J0+1) exp(−F(J0)∗hc/kT) Q0 v(T) ,(1) where J0, J00are rotational quantum numbers (single primed quantum numbers refer to the upper state, double primed ones to the lower); v0, v00 are vibrational quantum num-bers; N is the population of the upper vibrational state; A (J00,v00←J0,v0) is the Einstein coefficient for the indicated
transition; F(J0) is the relative value of the energy of the
rotational level with J=J0 of the upper vibrational state; k is the Boltzmann’s constant; T is the rotational tempera-ture; and Qv0(T) is the partition function of the upper
vibra-tional state. The values of Einstein coefficients are taken from Mies (1974) and those of F(J0) from Kendall and Clark (1979).
Using Eq. (1) the rotational temperature T can be deter-mined by comparing the intensities of two or more OH lines (Mies, 1974; French et al., 2000):
T=[hc/k∗(F(J2)−F(J1))]/ln[I1A2(2J2+1)}/{I2A1(2J1+1)}] (2)
where F(J1)and F(J2)are the energy levels of the initial
Fig. 1a. The relative intensity of the P1(2) and P1(4) lines is shown as well as the rotational temperature calculated from the ratio of the intensity of two lines for the night of 1–2 April 2003 at Kolhapur.
lines from different upper states; J1and J2are the upper state,
total quantum numbers ; and h, c and k are Planck’s constant, the speed of light and Boltzman’s constant, respectively.
The intensity ratio between P1(2) and P1(4) lines of
the OH(8,3) band were used to obtain rotational tem-perature using the transition probabilities as given by Mies (1974)(Stubbs et al., 1983).
T=207.06/ ln(2.642 R), (3) where R is the ratio of the intensities of P1(2) and P1(4) lines
of the OH(8,3) band.
3 Results and discussion
An initial selection of data for detailed analysis was ob-tained by rejecting data contaminated by clouds. The intensi-ties were not calibrated due to non-availability of a standard source of light, but efforts are on to calibrate them against a secondary source. Future results would be published after converting them in terms of Rayleighs. The data sets were further scrutinized when good data were recorded for more than four hours in a given night. It was thought that the val-ues of emissions of P1(2) and P1(4) lines and the rotational
temperature computed can then be meaningful. The relative intensities of the P1(2) and P1(4) lines were varying between
4 and 14 units (intensity is measured in arbitrary units).
Fig. 1b. Same as Fig. 1a but for 28–29 November 2002.
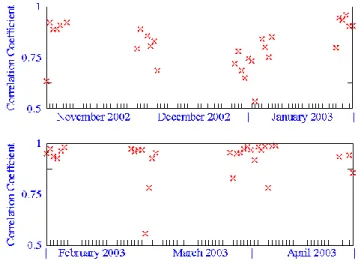
Fig. 2. The values of correlation coefficients between P1(2) and P1(4) lines of OH(8,3) band airglow are plotted for different nights during the period of observation.
3.1 Seasonal and diurnal variation
The airglow intensity and rotational temperature measure-ments were carried out at Kolhapur from 1 November 2002 to 29 April 2003 on clear moonless nights. Figure 1a shows an example of the typical variation of relative intensities of the P1(2) and P1(4) lines and the rotational temperature
com-puted from the ratio of these two lines for the night of 1– 2 April 2003. Typically, about 110 observations of tem-perature were recorded during the night. The temtem-peratures vary between 196 to 231 K. Figure 1b shows the variation
3318 G. K. Mukherjee and N. Parihar: Measurement of rotational temperature at Kolhapur, India
Fig. 3. Mean nightly rotational temperature for the period 1
Novem-ber 2002 to 29 April 2003. The numNovem-ber of temperature measure-ments from which each mean is derived is also plotted in the figure.
Fig. 4. Mean nocturnal variation of P1(2) and P1(4) intensity of OH(8,3) band for different months at Kolhapur during 2002–2003.
of intensities of P1(2) and P1(4) lines and the temperature
on the night of 28–29 November 2002. Typically temper-ature data shows periodicities of about one hour. The cor-relation coefficients between the relative intensities of the P1(2) and P1(4) lines are shown in Fig. 2. For most of the
nights the correlations (0.54 to 0.98) between P1(2) and P1(4)
lines are very good. All temperature and band intensity
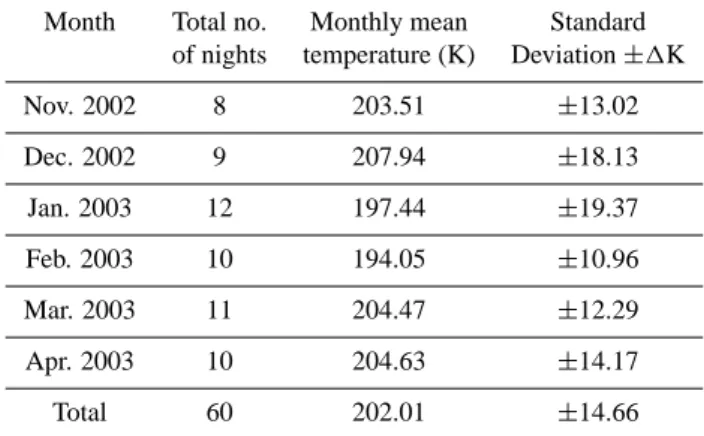
val-Table 1. Nights of observation and their monthly mean temperature.
Month Total no. Monthly mean Standard of nights temperature (K) Deviation ±1K Nov. 2002 8 203.51 ±13.02 Dec. 2002 9 207.94 ±18.13 Jan. 2003 12 197.44 ±19.37 Feb. 2003 10 194.05 ±10.96 Mar. 2003 11 204.47 ±12.29 Apr. 2003 10 204.63 ±14.17 Total 60 202.01 ±14.66
Table 2. The observed mean temperature at low-latitude stations
using photometric ground-based measurements.
Year of Latitude Temperature Reference Measurements K 1972–1973 23◦S 179 Takahashi et al. (1977) 1974–1975 24◦N 180–200 Majmudar (1977) 1980 18◦N 170–270 Tepley et al. (1981) 1977–1982 23◦S 185–200 Takahashi et al. (1984) 1985 23◦S 190 Takahashi et al. (1986) 1985–1986 18◦N 188–205 Agashe et al. (1989) 2002–2003 16.8◦N 202±15 Present Study (2002–2003)
ues were computed using Mies (1974) transition probabilities for comparison of our results with other low latitude mea-surements (Takahashi et al., 1999). The absolute values of derived rotational temperatures are dependent on transition probabilities A1and A2, as given in Eq. (2). We also
calcu-lated temperatures using coefficients tabucalcu-lated by Turnbull and Lowe (1989) and Langhoff et al. (1986). But the differ-ences were small. The variation of mean nightly rotational temperature over 6 months is shown in Fig. 3. The range of variation of temperature for a particular month is small. The number of points used to compute the rotational temperature at a particular night is also shown in the figure. To examine whether any diurnal trend exists in the data, hourly mean val-ues of rotational temperature are computed as a function of local time (IST) for different months.
Table 1 summarizes the nights of observation whose data have been included in this paper. The monthly mean tem-perature in different months is shown in Table 1. It has been found that the mean temperature of the mesopause at Kolha-pur from all the measurements was around 202±15 K. The result compares well with the other low-latitude measure-ments of rotational temperature as given in Table 2. In Fig. 4,
Fig. 5. Monthly mean rotational temperature observed at Kolhapur
during November 2002 to April 2003.
Fig. 6. Frequency of occurrence of mesopause temperature
mea-surements at Kolhapur in 10 K interval over the period 2 November 2002–29 April 2003.
we show the nocturnal monthly average variation of the in-tensity of the P1(2) and P1(4) lines of OH(8,3) Meinel Band
for each month at Kolhapur. In general, a steady decrease in intensity during the night has been observed in most of the months. It is more during the early night and decreases to-wards dawn, as shown in the figure. This seems to be in good agreement with earlier reports. This has been explained due to decreasing concentrations of hydrogen and odd oxygen as a result of the absence of photolysis of O2and H2O (Abreu
and Yee, 1989; Mulligan et al., 1995).
The monthly mean temperature in different months is shown in Fig. 5 by a bar graph. It is to be noted that there is a decrease in temperature during January and February com-pared to other months. The average monthly temperature remains almost constant during March and April months, slightly lower in November. We found the temperature to be maximum around 208 K during the December month and minimum about 194 K during February 2003.
The data are also analysed into temperature intervals of 10 K to examine the distribution of the rotational tempera-ture. Figure 6 shows the results of the distribution for the pe-riods 1 November 2002 to 29 April 2003. It is seen that 27% of temperatures lie in the range 195–205 K. Of all the tem-perature points considered (the total number of points=5480) about 20% and 20.7% of the points lie in the temperature
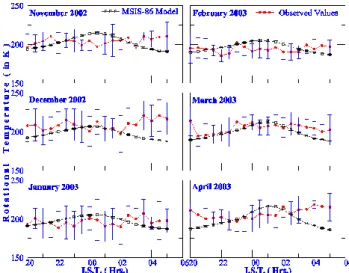
Fig. 7. Half-hourly means of the measured rotational temperature
over the period 2 November 2002 to 29 April 2003. The vertical arrows show the standard deviation (± sigma) in the observed val-ues. Temperature parameters computed from MSIS (1986) model are also depicted in the figure for the corresponding period.
range 185–195◦K and 205–215◦K. Thus, more than 67% of the points lay in the temperature range 185–215◦K range.
Hence, it can be interpreted that the temperature near the mesopause over Kolhapur generally varies in the range 185– 215◦K.
3.2 Comparisons with model
The measured rotational temperature were compared with the temperature derived from the MSIS-86 model. The Mass Spectrometer Incoherent Scatter (MSIS) model describes the neutral temperature and the densities in the upper atmo-sphere. This model is based on the extensive data compi-lation and analysis work of A. E. Hedin and his colleagues (Hedin, 1987). Data sources include measurements from several rockets, satellites and incoherent scatter radars. This model expects as input – year, day of year, universal time, altitude, geodetic latitude and longitude, local apparent so-lar time, soso-lar F10.7 flux (for previous day and three-month average), and a magnetic AP index (daily or AP history for
last 59 h). For these conditions the following output parame-ters are calculated: number density of He, O, N2, O2, Ar, H
and N, the total mass density; neutral temperature and exo-spheric temperature. The results of this analysis are shown in Fig.7. The mean rotational temperature parameters were computed at every half an hour for each month starting at 20:00 h in the evening to 05:00 h in the morning. The verti-cal arrows show the error bars which are the standard devi-ation of the observed values of rotdevi-ational temperature. The model values generally show their peaks around local mid-night on every month. The observed values of rotational temperature are found to be more compared to their model estimates from 02:00 to 05:00 h during most of the months. In general, the agreement between the model estimates and
3320 G. K. Mukherjee and N. Parihar: Measurement of rotational temperature at Kolhapur, India
the observed mesopause temperature are good within the er-ror bar in the first half of the nights. Jonsson et al. (2002) presented a comparison between the Canadian Middle At-mosphere Model (CMAM) and 9 years of HALOE tempera-ture measurements for the middle atmosphere. The analysis showed an overall agreement throughout the entire middle at-mosphere with discrepancies 10 K and less on various areas for both equinox and solstice conditions.
4 Conclusions
In comparison with other methods for observation of this geophysical quantity (rotational temperature), the optical technique is inexpensive and readily applicable for observa-tion over a long period of time. The data were presented for 60 clear nights. The salient features of the observation are summarized below:
1. The correlation between P1(2) and P1(4) line intensities
on large number of nights is very good.
2. The rotational temperature data obtained from the ratio of P1(2) and P1(4) lines are in good agreement during
most parts of the night with the results obtained from the MSIS-86 model.
3. The P1(2) and P1(4) line intensities of OH(8,3) band
during November 2002–April 2003 at Kolhapur, a low-latitude station, showed a steady decrease from evening to dawn hours. It is more during the early night and it decreases towards dawn. This seems to be in good agreement with earlier reports. This has been explained due to decreasing concentrations of hydrogen and odd oxygen as a result of absence of photolysis of O2 and
H2O (Abreu and Yee, 1989) at night.
4. Results of OH temperature measurements match well with earlier low latitude measurements of OH rotational temperature. There is a great variability in the diurnal behavior in low and mid latitudes. There are four dif-ferent types of nocturnal variations of temperature as observed by Agashe et al. (1989) at a low-latitude sta-tion, Pune (18◦N, 73◦E) in India. The monthly mean temperature of the mesopause region over Pune was found to be 195±10 K. The temperature was found to be higher in winter than in summer. From the analysis of results, it has been found that monthly mean temper-ature of near the mesopause region over Kolhapur was 202±15 K. Changes in temperature during a night could be attributed to changes in layer altitude on some oc-casions while on other ococ-casions the changes show the influence of gravity waves.
5. All temperature and band intensity values were com-puted using Mies (1974) transition probabilities in order to compare with other low-latitude measurements. We also calculated temperatures using coefficients tabulated by Turnbull and Lowe (1989), Langhoff et al. (1986). But the differences were less than 5–10 K.
6. There are reports showing the seasonal (monthly) vari-ation of rotvari-ational temperature maximizing during win-ter and minimizing during summer. This has been ex-plained in terms of transport of atomic oxygen from summer hemisphere to the winter hemisphere. How-ever, Takahashi et al. (1984) reported a summer maxima and a winter minima at 23◦S latitude. We found our temperature measurement to be maximum during De-cember and minimum during February 2003. Thus, it is clear that the ground-based OH airglow technique can be used as a remote sensing tool to study the mesopause dynamics.
Acknowledgements. The airglow measurements are carried out
un-der the scientific collaboration between IIG, Navi Mumbai and Shivaji University, Kolhapur. The tilting-filter photometers were provided by P. L. Dyson, La Trobe Univerity, Melbourne, Australia under Indo-Australia agreement on Science and Technology. The funds for research on studies of the upper atmosphere in IIG are provided by Department of Science and Technology (DST), Govt. of India, New Delhi. Technical support received from P. T. Patil in Airglow work is gratefully acknowledged.
Topical Editor U.-P. Hoppe thanks two referees for their help in evaluating this paper.
References
Abreu, V. J. and Yee, J. H.: Diurnal and seasonal variation of the night time OH(8,3) emission at low latitudes, J. Geophys. Res., 94, 11 949–11 957, 1989.
Agashe, V. V. and Gurao, J. B.: Intensity Variation of OH Meinel Bands in the nightglow, Ind. J. Radio and Space Phys., 6, 322– 324, 1977.
Agashe, V. V., Pawar, V. R., Aher, G. R., Nighut, D. N., and Je-hangir, A.: Study of mesopause temperature and its behavior from OH nightglow, Ind. J. Radio and Space Phys., 18, 309–314, 1989.
French , W. J. R., Burns, G. B., Finlayson, K., Greet, P. A., Lowe, R. P., and Williams, P. F. B.: Hydroxyl(6-2) airglow emission inten-sity ratios for rotational temperature determination, Ann. Geo-phys., 18, 1293–1303, 2000.
Greet, P. A., French, W. J. R., Burns, G. B., Williams, P. F. W., Lowe, R. P., and Finlyson, K.: OH(6-2) Spectra and rotational temperature measurements at Davis, Antarctica, Ann. Geophys., 16, 77–89, 1998.
Hedin, A. E.: MSIS-86 Thermospheric Model, J. Geophys. Res., 92, 4649–4662, 1987.
Hobbs, B. G., Reid, I. M., and Greet, P. A.: Mesospheric Rotational Temperatures from the OH(6-2) emissions above Adelaide, Aus-tralia, J. Atmos. Terr. Phys., 58, 12, 1337–1341, 1996.
Jonsson, A., de Grandepre, J., and McConnell, J. C.: A comparison of mesospheric temperature from Canadian Middle Atmosphere Model and haloe observations: Zonal mean and signature of the solar diurnal tide, Geophys. Res. Lett., 29 (9), 10 1029–10 1033, 2002.
Kendall, D. J. W. and Clark, T. A.: The pure rotational atmospheric lines of hydroxyl, J. Quant Spectrosc. Radiat Transfer, 21, 511– 518, 1979.
Kubota, M., Ishi, M., Shiokawa, K., Ejiri, M. K., and Ogawa, T.: Height measurements of nightglow structures observed by all-sky imagers, Adv. Space Res., 24, 593–596, 1999.
Langhoff, S. R., Werner, H. J., and Rosmus, P.: Theoretical transi-tion probabilities for the OH Meinel system, J. Mol. Spectr., 118, 507–529, 1986.
Majmudar, N. H.: Study of the upper atmosphere by OH and other airglow emissions, Ph.D. Thesis, M. S. University of Baroda, Baroda, 1977.
Meinel, A. B.: OH emission bands in the spectrum of night sky, Astrophys. J., 111, 555–564, 1950.
Meriwether, J. W.: High latitude airglow observations of correlated short term fluctuations in the hydroxyl Meinel 8-3 band intensity and rotational temperature, Planet. Space Sci., 23, 1211–1221, 1975.
Meriwether, J. W., Hays, P. B., McWalters, K. W., and Nagy, A. F.: Interferometric measurements of the 7319 A doublet emission of OH, Planet. Space Sci., 22, 636–644, 1974.
Mies, F. H.: Calculated vibrational probabilities of OH(X2II), J. Molec. Spectros., 53, 150–180, 1974.
Mukherjee, G. K. and Dyson, P. L.: A filter tilting photometer for nightglow measurements of 630.0 nm emission line, Ind. J. Radio Space Phys., 21, 212–217, 1992.
Myrabo, H. K.: Temperature variation at mesopause levels during winter solstice at 78◦N, Planet. Space Sci., 32, 249–255, 1984. Mulligan, F. I., Horgan, D. F., Galligan, J. G., and Griffin, E. M.:
Mesopause temperature and intensity band brightness calculated from airglow OH emissions recorded at Maynooth (53.2◦N, 6.4◦W), J. Atmos. Terr. Phys., 57 (13), 1623–1637, 1995. Roble, R. G. and Dickinson, R. E.: How will changes in carbon
dioxide and methane modify the mean structure of mesosphere and thermosphere, Geophys. Res. Lett., 16, 1441–1444, 1989. Schaffer, R. C. and Fastie, W. G.: Tilting photometer measurements
in dayglow rocket photometry, Appl. Opt., 11, 2289–2295, 1972. Stubbs, L. C., Boyd, J. S., and Bond, F. R.: Measurement of the OH rotational temperature at Mawson, East Antarctica, Planet. Space Sci., 31 (8), 923–932, 1983.
Sivjee, G. G. and Hamwey, R. M.: Temperature and chemistry of the polar mesopause OH, J. Geophys. Res., 92, 4663–4672, 1987.
Sivjee, G. G., Dick, K. A., and Feldman, P. D.: Temporal variation in night-time Hydroxyl rotational temperatue, Planet. Space Sci., 20, 261–269, 1972.
Takahashi, H. and Batista, P. P.: Simultaneous measurements of OH(9,4), (8,3), (7,2), (6,2) and (5,1) bands in the airglow, J. Geo-phys. Res., 86, 5632–5642, 1981.
Takahashi, H., Clemsha, B. R., and Sahai, Y.: Nightglow OH(8,3) band intensities and rotational temperature at 23◦S, Planet. Space Sci., 22, 1323–1329, 1974.
Takahashi, H., Sahai, Y., Clemsha, B. R., Batista, P. P., and Teixeira, N. R.: New hydroxyl transition probabilities and their impor-tance in airglow studies, Planet. Space Sci., 25, 541–548, 1977. Takahashi, H., Sahai, Y., and Batista, P. P.: Tidal and Solar cycle
effects on the OI 5577 A NaD and OH(8,3) airglow emission observed at 23◦S, Planet. Space Sci., 32, 897–902, 1984. Takahashi, H., Sahai, Y., and Batista, P. P.: Airglow O2(1P)
Atmo-spheric band at 8645 A and the rotational temperature observed at 23◦S, Planet. Space Sci., 34, 301–306, 1986.
Takahashi, H., Batista, P. P., Buriti, R. A., Gobbi, D., Nakamura, T., Tsuda, T., and Fukao, S.: Response of the airglow OH emission temperature and mesopause wind to the atmospheric wave prop-agation over Shigaraki, Japan, Earth Planets Space, 51, 863–875, 1999.
Tepley, C. A., Burnside, R. G., and Meriwether Jr., J. W.: Hor-izontal thermal structure of the mesosphere from observations of OH(8,3) band emissions, Planet. Space Sci.,29, 1241–1249, 1981.
Turnbull, D. N. and Lowe, R. P.: New hydroxyl transitional prob-abilities and their importance in airglow studies, Planet. Space Sci., 37, 723–738, 1989.
Watanabe, T. and Nakamura, M.: Rocket measurements of O2and OH Meinel Bands in the Airglow, J. Geophys. Res., 86, A7, 5768–5774, 1981.
Wiens, R. H.: Diurnal variation of the (8,3)/(5,0) intensity ratio of nightglow OH at Adi Ugri, Planet. Space Sci., 22, 1059–1067, 1974.
Wiens, R. H. and Weill, G.: Diurnal, annual and solar cycle vari-ations of hydroxyl and sodium night glow intensities in the Europe-Africa sector, Planet. Space Sci., 21, 1011–1027, 1973. Williams, P. F. B.: OH rotational temperatures at Davis, Antarctica,