HAL Id: tel-02003539
https://tel.archives-ouvertes.fr/tel-02003539
Submitted on 1 Feb 2019HAL is a multi-disciplinary open access archive for the deposit and dissemination of sci-entific research documents, whether they are pub-lished or not. The documents may come from teaching and research institutions in France or abroad, or from public or private research centers.
L’archive ouverte pluridisciplinaire HAL, est destinée au dépôt et à la diffusion de documents scientifiques de niveau recherche, publiés ou non, émanant des établissements d’enseignement et de recherche français ou étrangers, des laboratoires publics ou privés.
%&
! '
(
)* ! ) + '
!
% !,
- .-
/
-/ 0
1
2
3
0
-')!),+
! 4
5 )&%11
4
5 0 - %! ! ! " # 5 6 - 78! $ % & ' (7
9 4
: ; !< ) *# + 5 )&% 1 =)Acknowledgments
I thank my supervisor Dr Nicolas GROSSO making me discover the physics about the center of our galaxy and especially about Sgr A* which is an exciting area. I also thank him for his help during these three years.
I acknowledge the Université de Strasbourg for my IdEx PhD grant.
I was a member of the European Doctoral College of the University of Strasbourg during the preparation of my PhD, from 2013 to 2016. I had benefited from specific financial supports offered by the College and, along with my main stream research, I had followed a special course on topics of general European interests presented by international experts. I thank the European Doctoral College (CDE) for their different supports.
The research leading to the results of this Ph.D. thesis has received funding from the European Union Seventh Framework Program (FP7/2007-2013) under grant agreement n°312789. This work has also been financially supported by the Programme National Hautes Energies (PNHE).
During this Ph.D. thesis, I used the observations made by XMM-Newton. The XMM-Newton project is an ESA Science Mission with instruments and contributions directly funded by ESA Member States and the USA (NASA). This Ph.D. thesis is also based on observations made with the NASA/ESA Hubble Space Telescope (HST) obtained at the Space Telescope Science Institute (STScI) which is operated by the Association of Universities for Research in Astronomy, Inc., under NASA contract NAS 5-26555. These HST observations are associated with programs 13403 and 13316. This Ph.D. thesis is based on observations made with ESO Telescopes at the Paranal Observatory under ESO programs 092.B-0920(A), 091.B-0183(H), 093.B-0932(A), 093.B-0092(A), 093.B-0092(E), 093.B-0092(G), and 093.B-0220(B). This Ph.D. thesis is also based on obser-vations made with the Karl G. Jansky Very Large Array (VLA) of the National Radio Astronomy Observatory is a facility of the National Science Foundation, operated under a cooperative agreement by Associated Uni-versities, Inc.. This Ph.D. thesis is also based on observations made with the Combined Array for Research in Millimeter-wave Astronomy (CARMA). Support for CARMA construction was derived from the states of California, Illinois, and Maryland, the James S. McDonnell Foundation, the Gordon and Betty Moore Foun-dation, the Kenneth T. and Eileen L. Norris FounFoun-dation, the University of Chicago, the Associates of the California Institute of Technology, and the National Science Foundation. Ongoing CARMA development and operations are supported by the National Science Foundation under a cooperative agreement, and by the CARMA partner universities. This work also made use of public data from the Swift data archive, and data supplied by the UK Swift Science Data Center at the University of Leicester. Swift is supported at Penn State University by NASA Contract NAS 5-00136. This research has made use of the XRT Data Analysis Software (XRTDAS) developed under the responsibility of the ASI Science Data Center (ASDC), Italy. This Ph.D. thesis is also used data obtained from the Chandra Data Archive.
Finally, a big thank to Françoise Raucq from University of Liège (BELGIUM) and to Gaëtan Gourgue and Muriel Jadoul for their inducement.
Table of content
List of Tables v
List of Figures vii
Table of scientific constants and unit conversions ix
Table of acronyms x
Preface xiii
1 Overview of the Galactic Center and Sgr A* 1
1.1 On the way towards the Galactic Center . . . 1
1.1.1 The structure of the Milky Way . . . 1
1.1.2 The central parsecs of the Milky Way . . . 1
1.1.3 The Sgr A complex . . . 4
1.2 The Galactic Center supermassive black hole Sgr A* . . . 4
1.2.1 The physical characteristics of Sgr A* . . . 4
1.2.2 The quiescent state of Sgr A* . . . 5
1.2.3 The Sgr A* multiwavelength activity . . . 7
1.3 Summary of the current knowledge on the emission from Sgr A* . . . 11
1.4 The Dusty S-cluster Object/G2 . . . 11
1.5 The SGR J1745-29 magnetar . . . 13
1.6 The context of my Ph.D. thesis . . . 16
2 Observational facilities 17 2.1 X-ray facilities . . . 17 2.1.1 XMM-Newton . . . 17 2.1.2 Chandra . . . 19 2.1.3 Swift . . . 19 2.2 Infrared facilities . . . 20 2.2.1 VLT . . . 20 2.2.2 HST . . . 21 2.3 Radio/sub-millimeter facilities . . . 21 2.3.1 CARMA . . . 21 2.3.2 VLA . . . 22
3 Analysis tools for the X-ray study 23 3.1 The event list and data filtering for an XMM-Newton observation. . . 23
3.2 The X-ray light curve creation . . . 24
3.3 Simulation of Poisson flux for the synthetic light curves . . . 26
3.4 The Bayesian blocks method for the flare detection . . . 27
3.4.1 The Bayesian blocks method . . . 27
3.4.2 Calibration of the prior number of blocks . . . 29
3.4.3 The two-steps Bayesian blocks algorithm . . . 30
3.4.4 Flare detection efficiency . . . 31
of 2011 March 30. . . 44
5 Multiwavelength study of the flaring activity of Sgr A* in 2014 February–April 47 5.1 Monitoring the DSO/G2 on its orbit toward the Galactic Center Black Hole . . . 48
5.2 The multiwavelength flaring activity from Sgr A* . . . 51
5.2.1 Observations and data analysis . . . 51
5.2.2 Constraints on the physical characteristics of the flaring region . . . 57
5.2.3 The observed X-ray flaring rate . . . 60
6 Study of the X-ray flaring rate of Sgr A* during 1999–2015 63 6.1 Observations and data reduction . . . 64
6.1.1 XMM-Newton observations . . . 64
6.1.2 Chandra observations . . . 64
6.1.3 Swift observations . . . 65
6.2 Systematic flare detection . . . 67
6.3 The X-ray flare fluxes . . . 68
6.4 The intrinsic flare distribution. . . 69
6.4.1 The observed flare distribution . . . 69
6.4.2 The X-ray flare detection efficiency . . . 69
6.4.3 Correction of the observed flare distribution . . . 71
6.5 Study of the unbiased X-ray flaring rate . . . 71
7 General conclusion and perspectives 77 Bibliography 87 Résumé en français 89 Appendix 97 A The radiative processes evolving near Sgr A* . . . 99
A.1 The synchrotron radiation . . . 99
A.2 The inverse Compton (IC) . . . 101
A.3 The synchrotron self-Compton (SSC) . . . 102
B The adiabatically expanding plasmon model . . . 103
C Observation log and X-ray flares of Sgr A* in 1999–2015 . . . 107
D Original publications . . . 111
Study of the X-ray activity of Sgr A* during the 2011 XMM-Newton campaign . . . 113
Study of the X-ray activity of Sgr A* during the 2011 XMM-Newton campaign (Corrigendum)129 Multiwavelength study of the flaring activity of Sgr A* in 2014 February–April . . . 131
Monitoring the Dusty S-cluster Object (DSO/G2) on its Orbit toward the Galactic Center Black Hole . . . 157
List of Tables
1 Table of scientific constants and unit conversions . . . ix
2 Table of acronyms. . . x
1.1 Orbital elements of the DSO/G2 . . . 12
1.2 Rotational periods and spin-downs of the Galactic Center magnetar. . . 13
4.1 XMM-Newton observation log for the 2011 campaign. . . 39
4.2 Characteristics of the X-ray flares observed by XMM-Newton/EPIC in 2011 . . . 40
5.1 The DSO/G2 observations log with VLT/SINFONI . . . 49
5.2 Characteristics of the X-ray flares observed by XMM-Newton/EPIC in 2014 Feb.–Apr. . . 52
5.3 Spectral properties of the X-ray flares observed by XMM-Newton/EPIC in 2014 Feb.–Apr. . . 55
6.1 Average flare detection efficiency for Chandra, XMM-Newton and Swift . . . 71
C.1 Observation log of the XMM-Newton observations and the detected X-ray flares in 1999–2015 108 C.2 Observation log of the Chandra observations and the detected X-ray flares in 1999–2015 . . . 109
C.2 Continued . . . 110
List of Figures
1.1 The Milky Way . . . 1
1.2 The Galactic Center in radio, NIR and X-rays . . . 2
1.3 The Sgr A complex . . . 3
1.4 The S-cluster . . . 4
1.5 The SED of Sgr A* . . . 6
1.6 The X-ray quiescent emission from Sgr A* . . . 7
1.7 Example of X-ray light curves from Sgr A* . . . 8
1.8 Example of NIR light curves from Sgr A* . . . 9
1.9 Possible radiative processes for the IR/X-ray flaring emission from Sgr A* . . . 9
1.10 The G2’s images in L-band from 2003 to 2012. . . 12
1.11 The Chandra images of the Galactic Center magnetar . . . 14
1.12 The pulse profile of the Galactic Center magnetar . . . 15
1.13 Evolution of the flux of the Galactic Center magnetar in X-rays and radio . . . 15
2.1 The atmospheric transmission on Earth. . . 17
2.2 The X-ray focusing mirrors . . . 18
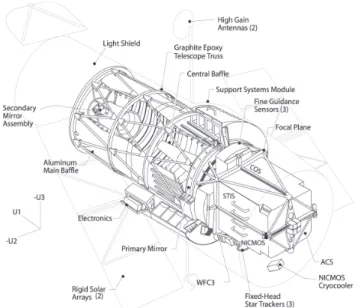
2.3 The XMM-Newton telescope . . . 18
2.4 The Chandra telescope . . . 19
2.5 The Swift telescope . . . 19
2.6 VLT . . . 20
2.7 The HST telescope . . . 21
2.8 CARMA. . . 21
2.9 VLA . . . 22
3.1 The event pattern definition . . . 24
3.2 The Chandra images of the Galactic Center . . . 25
3.3 The flare light curve simulation . . . 28
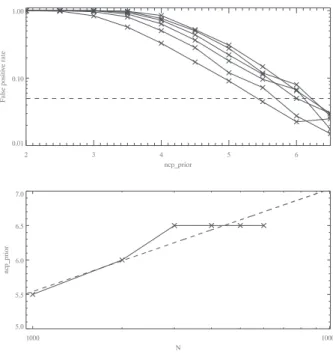
3.4 Calibration of the prior number of blocks . . . 30
3.5 The background subtraction in the Bayesian block method . . . 31
3.6 The detection efficiency of the Bayesian blocks algorithm . . . 32
3.7 Comparison of the detection efficiency with the Bayesian blocks algorithm for the non-flaring level corresponding to those of the 2011 and Feb. 2014 observations . . . 33
3.8 The comparison of the detection efficiency of the flares observed by Chandra and XMM-Newton with the Bayesian blocks algorithm . . . 34
3.9 The density estimator for the light curve smoothing . . . 35
3.10 The smoothed light curve . . . 35
3.11 Effective area and probability distribution of XMM-Newton EPIC/pn. . . 36
4.1 The XMM-Newton/EPIC (pn+MOS1+MOS2) light curves of Sgr A* in the 2–10 keV energy range obtained in 2011 Mar.–Apr. . . 40
4.2 The light curves of the flare of 2011 March 30 and April 3 . . . 41
4.3 Illustration of the light bending effect. . . 43
4.4 Simulation of a hotspot orbiting a supermassive black hole . . . 43
4.5 Modeling of the 2011 March 30 flare pn light curve with a rotating hotspot. . . 43
4.6 Determination of the radial distance of the flaring region for the 2011 March 30 flare . . . 45
5.12 Physical parameters of the 2014 flares observed simultaneously in X-rays and NIR for the
three emission models. . . 61
6.1 Total correction factor of the Swift count rate . . . 65
6.2 Flare detection efficiency of the Bayesian blocks algorithm in the Swift observations . . . 66
6.3 Evolution of the X-ray flaring rate from 1999 to 2015 . . . 68
6.4 Flux–duration distribution of the X-ray flares from Sgr A* . . . 70
6.5 Temporal distribution of the flare fluxes and fluences . . . 72
6.6 Temporal distribution of the flare fluxes and fluences corrected from the sensitivity bias . . . . 72
6.7 X-ray flaring rate from 1999 to 2015 computed by the Bayesian blocks algorithm in a given mean unabsorbed flux range . . . 75
6.8 X-ray flaring rate from 1999 to 2015 computed by the Bayesian blocks algorithm in a given mean unabsorbed fluence range. . . 75
7.1 Comparison between the effective area of Athena/X-IFU and Chandra . . . 79
7.2 Simulated Athena/X-IFU image of the Galactic Center . . . 80
7.3 Detection efficiency of the Bayesian blocks algorithm for Athena/X-IFU . . . 81
Table 1: Table of scientific constants and unit conversions.
Constants cgs units SI units References
Light velocity (c) 2.99792458 1010cm s−1 108m s−1 a
Electron charge (e) 1.6022 c 10−20statC 10−19C c
Electron mass (me) 9.1094 10−28g 10−31kg c
Proton mass (mp) 1.6726 10−24g 10−27kg c
Boltzmann constant (kB) 1.3807 10−16erg K−1 10−23J K−1 c
Planck constant (h) 6.6261 10−27erg s 10−34J s c
Gravitational constant (G) 6.6726 10−8dyne cm2g−2 10−11m3s−2kg−1 c
Thomson cross section (σT) 6.6525 10−25cm2 10−29m2 c
Fine structure constant (α) 7.2972 10−3 10−3 c
Solar mass (M⊙) 1.9884 1033g 1030kg a
Solar radius (R⊙) 6.957 1010cm 108m b
Solar bolometric luminosity (L⊙) 3.828 1033erg s−1 1026J s−1 b
Notes: (a)http://asa.usno.navy.mil/static/files/2014/Astronomical_Constants_2014.pdf; (b)Mamajek et al.(2015); (c) Huba (2013).
Astronomical distances fromCox(2000) 1 parsec (pc) 3.08567758 1018cm 1 astronomical unit (au) 1.495979 1013cm 1 light-year (ly) 9.460530 1017cm 1 parsec (pc) 2.062648 105au 1 parsec (pc) 3.2616334 ly
CDF Cumulative Distribution Function CXO Chandra X-Ray Observatory DSO Dusty S-cluster Object EHT Event Horizon Telescope
EPIC European Photon Imaging Camera (XMM-Newton) FWHM Full Width at Half Maximum
GBT Green Bank Telescope
GRMHD General Relativity Magneto-Hydro Dynamic GTI Good Time Intervals
HST Hubble Space Telescope IC Inverse Compton
IR Infrared
ISCO Innermost Stable Circular Orbit MCMC Markov Chain Monte Carlo MJD Modified Julian Date
MOS Metal Oxide Semi-conductor (XMM-Newton)
NICMOS Near Infrared Camera and Multi-Object Spectrometer (HST) NIR Near Infrared
NuSTAR Nuclear Spectroscopic Telescope Array ODF Observation Data File
PSF Point-Spread Function QPO Quasi Periodic-Oscillation
RGS Reflection Grating Spectrometer (XMM-Newton) RIAF Radiatively Inefficient Accretion Flow
SAS Science Analysis Software SGR Soft Gamma Repeater Sgr Sagittarius
SINFONI Spectrograph for INtegral Field Observations in the Near-Infrared (VLT) SMA Sub-millimeter Array
SMT Sub-millimeter Telescope SSC Synchrotron Self-Compton UT Universal Time
VLA Very Large Array
VLBA Very Long Baseline Array VLBI Very Long Base Interferometer VLT Very Large Telescope
WFC3 Wide Field Camera 3 (HST) XMM X-ray Multi-Mirror
« The question that I started off with was, I thought, very simple. It was just: “Is there a massive black hole at the center of our Milky Way?”. But one of the things I love about science is that you always end up with new questions.» Andrea M. Ghez in Discover Magazine, May 2009, “The Frontiers of Astronomy”.
Preface
The main messenger of information for astrophysicists is the photon. The properties of this photon (such as its wavelength and its polarization) are different according to the mechanisms of its formation and the medium it goes through. The study of the characteristics of the collected photon thus allows researchers to deduce the properties of the source and the underlying radiative processes.
The high-energy astrophysics studies mainly photons in X-rays and γ-rays, i.e., photons having energies greater than 100 eV, corresponding to wavelengths smaller than 10−8m. The high-energy observations, avail-able through rockets and satellites since the 1950s, have experienced exceptional growth since 1999 thanks to the increasing number of X-ray facilities such as Chandra, XMM-Newton, Swift, Suzaku and NuSTAR. Future space missions such as Athena promise a much greater number of collected photons with a better angular and spectral resolution. This will allow us to study more precisely the physical properties of the observed objects to increase the accuracy of the theoretical models.
In parallel, the software and computer development have allowed researchers to perform systematic studies of large datasets. It also allows the study and comparison of complex models with observations to better understand the properties of the emitting source.
The study of the black holes allows researchers to test the physical laws in presence of strong gravitational field that can not be reproduced in laboratory. This is also the way to test general relativity and quantum mechanics in such environment. At the Galactic Center, Sgr A* (say Sagittarius A star) is the closest super-massive black hole (SMBH) with a distance of only 8 kpc. It is thus a unique laboratory in which physical processes also relevant for nuclei of other galaxies can be studied with the higher angular resolution. However, the gas and dust on the line of sight to the Galactic Center make impossible its observation in the visible or ultraviolet making it only accessible in radio, infrared and in energies higher than about 2 keV.
Thanks to the current generation of space and ground telescopes, we are now able to detect sudden increases of flux (called flares) from Sgr A*. The flare characteristics improve our understanding of the physical processes in the vicinity of the SMBH.
My Ph.D. thesis entitled “Multiwavelength study of the flaring activity of the supermassive black hole Sgr A* at the center of the Milky Way” focuses on the study of the activity from Sgr A* mainly in X-rays and on comparisons with other wavelengths. The Chapter1 is an overview of the current knowledge about the Galactic Center SMBH Sgr A* and the recently discovered Dusty Stellar Object (DSO) G2 object orbiting Sgr A* with a small pericenter distance. The possible increase of the Sgr A* activity due to the gravitational interaction with the DSO/G2 defines the context of my Ph.D. thesis. In this first Chapter, I also introduce the Galactic Center magnetar SGR J1745-29 which entered in burst phase in 2013 April at only 2′′.5 from Sgr A*. In Chapter2, I introduce the observational facilities I used for my studies. I then explain the different analysis methods I used and developed in Chapter3. The results obtained for the 2011 campaign for the observations of Sgr A* in X-rays with XMM-Newton are reported in Chapter4. The study of the multiwavelength activ-ity from Sgr A* in Feb.-Apr. 2014, i.e., close to the DSO/G2 pericenter passage are reported in Chapter 5. In Chapter6, I present the study of the X-ray flaring rate from Sgr A* observed with Chandra, XMM-Newton and Swift from 1999 to 2015. I finally present the conclusion and perspectives of this work in Chapter 7. Complementary informations about the radiative processes and the expanding plasmon model are given in AppendixesAandB. The observation log and the characteristics of the X-ray flares detected from 1999 to 2015 are given in Appendix C. The accepted papers reporting the results presented in this Ph.D. thesis are given in AppendixD.
Chapter 1
Overview of the Galactic Center and Sgr A*
In Sect.1.1, I first set the scene with a brief description of the Milky Way before zooming towards the Galactic Center to meet Sgr A* and its closest environment. The physical characteristics, quiescent emission and flaring activity of Sgr A* are described in Sect.1.2. A summary of these properties is given in Sect.1.3. In Sect.1.4, I describe the discovery and current knowledges about the DSO/G2. In Sect. 1.5, I introduce the Galactic Center magnetar SGR J1745-29 before setting the context of my Ph.D. thesis in Sect.1.6.1.1 On the way towards the Galactic Center
1.1.1 The structure of the Milky Way
Our solar system belongs to a bared spiral galaxy (SBc) named the Milky Way which is composed by a 15 kpc radius disk and by a central spherical bulge whose radius is 3 kpc (left panel of Fig.1.1;Hüttemeister 2003). In the disk, there are four major spiral arms which contain the majority of gas and dust of the galaxy. The arms are composed by about 70% of hydrogen (H i, H ii and H2), about 30% of helium and some metals formed during supernovae explosions. Our solar system is in one of these spiral arms called the Small Orion Arm at about 8 kpc from the center of the Milky Way. The bulge is composed by an old stellar population aged of (5 − 10) × 109years and gas with a total mass of 1010M
⊙.
In addition to the galactic plane components, there are the Fermi bubbles which are perpendicular to the galaxy (in violet in the right panel of Fig.1.1). These gigantic structures, reaching 50° of latitude, emit in γ-rays with a luminosity of 4 × 1037erg s−1needing an exciting energy of 1054to 1055erg (Wardle &
Yusef-Zadeh 2014). The Fermi bubbles could be explained by a past AGN (Active Galactic Nucleus) bright phase of Sgr A* (Su et al. 2010;Zubovas et al. 2011;Guo & Mathews 2012).
1.1.2 The central parsecs of the Milky Way
In the 1920’s, Harlow Shapley and Jan Oort deduced that the center of our galaxy is located in the direction of the Sagittarius (Sgr) constellation and that the Sun is not located at the center of the Milky Way (Shapley & Curtis 1921;Oort 1930). Their discovery was done with the study of the movement of stars close to the Sun and of the position of 93 globular clusters. In 1930, thanks to a systematic study of globular clusters, Robert
Figure 1.1: Left panel: Schematic view of the Milky Way (Hüttemeister 2003). Right panel: the Fermi bubbles (Credit: NASA’s Goddard Space Flight Center).
Figure 1.2: The image of the Galactic Center in radio, infrared and X-rays in galactic coordinates. The three images are shown at the same scale and aligned for an easier comparison. Top panel: Radio (333 MHz) image (Kassim et al. 1999) rotated and scaled to correspond to the IR and X-ray images. Middle panel: Spitzer image in infrared (blue = 3.6 µm, green = 8 µm and red = 24 µm). Bottom panel: Chandra X-ray survey between 1 and 8 keV (red = 1 − 3 keV, green = 3 − 5 keV and blue = 5 − 8 keV;Wang et al. 2002).
Figure 1.3: Schematic view of the Sgr A complex as seen from the Earth (Herrnstein & Ho 2005). Sgr A East fills the black ellipse. The large black band (a backwards “C” shape) is the CircumNuclear Disk. The light gray bands represent Sgr A West. The black dot is the S-cluster and the SMBH Sgr A*.
Trumpler concluded that the Galactic Center is not observable in visible light because of the dust absorption by the disk (Trumpler 1930).
Indeed, the presence of gas and dust on the light path implies that we do not receive all photons emitted by a source. This effect is called the extinction and is a combination of absorption and scattering. The ratio between the number of received and emitted photons is computed as 10−Aλ/2.5with A
λ the extinction at the photon wavelength λ. For the observations of the Galactic Center in radio and sub-millimeter, the galaxy is nearly transparent to all photons. For the infrared (IR) H-band (λ = 1.637 µm),Fritz et al.(2011) found AH=4.21 ± 0.10 mag which implies that we only receive one photon on 10AH/2.5 ∼ 100. In optic (at 550 nm), AV ∼ 30 mag (Rieke et al. 1989). This implies that only one photon on 1012 reaches us making impossible to observe the Galactic Center in visible light or UV. Since in IR and optic smallest wavelengths suffer more extinction, the source seems to emit more photons in longest wavelength. This phenomenon is called the interstellar reddening. In energies higher than about 2 keV, the galaxy becomes again nearly transparent to photons: more than 90% of emitted photons are received on Earth.
The center of our galaxy was observed, for the first time, in radio wavelengths at the end of the 1920s. An engineer of Bell Telephone, Karl Jansky, studied the source of noise for the phone communications with an antenna working at 20.5 MHz. He found a constant source of noise in the direction of the Sagittarius constellation (Jansky 1933). This was the first non-optic observation of the Universe. In 1959, Frank Drake observed for the first time the structure of the Galactic Center in radio with the Green Bank Telescope (Drake 1959).
A radio survey was made byKassim et al.(1999) on a 4◦× 5◦ region with the VLA (see top panel of Fig.1.2). Four main complexes can be seen in these wavelengths:
• Giant molecular clouds (Sgr B1, Sgr B2, Sgr C and Sgr D) forming the Central Molecular Zone; • At the center, the 15 pc radio complex Sgr A which hosts the SMBH Sgr A*;
• Some non-thermal filaments produced by the synchrotron radiation of relativistic electrons around the magnetic field perpendicular to the galactic plane (Yusef-Zadeh et al. 1984);
• Some supernovae remnants (SNR) which have a non-thermal shell in expansion.
An infrared and X-ray image of the Galactic Center are shown in the middle and bottom panel of Fig. 1.2. The Sgr A complex is one of the most luminous object in each wavelength. In X-rays and IR, we can see two clusters of young and massive stars (the Quintuplet and Arches clusters) which create H ii regions at less than 35 pc in projection from the Galactic Center. In X-rays, we can also see the center of the SNRs which are not observable in IR. The giant molecular clouds Sgr B1 and Sgr B2 are mostly seen in radio wavelengths.
The S2 orbit (blue: NTT/VLT, red: Keck) from 1992 to 2009 (Gillessen et al. 2009a).
In the IR image, we observe stellar clusters, H ii regions and dark clouds in silhouette against bright IR emission region.
1.1.3 The Sgr A complex
The Sgr A complex hosts the SMBH Sgr A* (black point in Fig. 1.3). Its structure thus influences and is influenced by Sgr A*
At 9.1 pc in projection, there is a SNR candidate named G359.92-0.09 (dotted circle in Fig.1.3), confined by the dynamical pressure (Coil & Ho 2000).
Sgr A East (black ellipse in Fig.1.3) is a SNR with different components: a shell dominated by synchrotron radiation which surrounds a hot plasma with X-ray thermal emission (Ekers et al. 1983). The hot ejecta in X-rays allows us to date the explosion to 104years ago (Aharonian et al. 2006).
The 104M
⊙tore of neutral gas named the “CircumNuclear Disk” (backwards “C” shape in Fig.1.3) is the most luminous part of Sgr A East. It is probably fed by some molecular clouds at 10 pc in projection from Sgr A* (Eckart & Genzel 1999).
Sgr A West (light gray bands in Fig.1.3) is composed by hot gas emitting in X-rays (Ekers et al. 1983;
Sidoli & Mereghetti 1999). It hosts luminous stars which form the S-cluster (see left panel of Fig.1.4). These stars have velocity that can reach 105km s−1and orbital period that can be as small as 10 years (Schödel et al.
2002;Gillessen et al. 2009a;Meyer et al. 2012).
A compact radio object was found in Sgr A West byBalick & Brown(1974) thanks to an interferometer from National Radio Astronomy Observatory (NRAO). This unresolved source was named “Sagittarius A*” byBrown(1982), the star reflecting the unresolved nature of the source, and is located at the shared focus of the Keplerian orbits of the stars from the S-cluster.
1.2 The Galactic Center supermassive black hole Sgr A*
1.2.1 The physical characteristics of Sgr A*
The mass of Sgr A* was first estimated to 2.6 ± 0.2 × 10⁶M
⊙ using the proper motion of 90 stars of the S-cluster from 1995 to 1997 (Ghez et al. 1998).Schödel et al.(2002) observed, for the first time, the pericenter passage of the 15 M⊙B0 type star S2 (also known as S0-2;Ghez et al. 1998) of the S-cluster at 124 au from Sgr A* on 2002. The orbit of this star is characterized by an eccentricity of 0.87 and an orbital period of only 15.2 years (see right panel of Fig. 1.4). Using the astrometric measurements of S2 from 1992 to 2002 (one third of the orbit), the authors constrained the mass of Sgr A* to M = (3.7 ± 1.5) × 106M
⊙. Then, the astrometric and spectroscopic measurements of S2 from 1995 to 2007 allowedGhez et al.(2008) to constrain the mass of Sgr A* to M = (4.1 ± 0.6) × 106M
⊙ at 8.0 ± 0.6 kpc. Gillessen et al. (2009a) measured the orbits of 28 stars including S2 during 16 years leading to an improvement of the Sgr A* mass of M = (4.31 ± 0.06|stat± 0.036|dist) × 106M⊙at 8.33 ± 0.35 kpc. The discovery of a new faint star S0-102 having an orbital period shorter than S2 (11.5 ± 0.3 years) allowedMeyer et al.(2012) to constrain the mass
and the distance of Sgr A* to (4.1 ± 0.4) × 106M
⊙at 7.7 ± 0.4 kpc using only the orbit of the S0-102 star. This large mass thus proofs that Sgr A* is a SMBH so as the majority of massive galaxies have, at their center, a supermassive black hole whose the mass is comprised between approximately 105M
⊙and 1010M⊙(Maoz
2008).
The size of a black hole is defined by its Schwarzschild radius. This is the size of the event horizon where all matter and photons are gravitationally attracted by the black hole without possibility of escaping. The Schwarzschild radius is computed as
Rs= 2 G M c2 ≈ 0.02 M 106M ⊙au ≈ 3.0 M 106M ⊙ 1011cm (1.1)
with M the black hole mass and M⊙the solar mass (Schwarzschild 1916). The gravitational radius is defined as rg =0.5 Rs. The Schwarzschild radius of Sgr A* is Rs=1.2 × 1012cm.
The most accurate radio position of Sgr A* was obtained with the Very Long Base Array (VLBA): RA(J2000) = 17h45m40s.036 ± 1.42 mas, Dec(J2000) = −29◦00′28′′.17 ± 2.65 mas (Petrov et al. 2011). In near infrared (NIR), the position of Sgr A* is also known with a precision of 2 mas (Gillessen et al. 2009b). The best constraint on the distance of Sgr A* from the Earth was given by the measure of trigonometric parallaxes and proper motions of 80 masers associated with high-mass stellar formation regions with the VLBA: D = 8.34 ± 0.16 kpc = 27.20 ± 0.50 kly (Reid et al. 2014).
Sgr A* has a proper motion of 20 km s−1in the galactic plane and 1 km s−1in the perpendicular direction (Reid et al. 1999;Reid & Brunthaler 2004). This is more than hundred times slower than the medium around it which proofs that it is located at the dynamical center of the Milky Way.
By abuse of language, I speak about the emission of Sgr A* instead of the emission from the matter accreted onto Sgr A*. This emission is currently described by a quiescent state (Sect.1.2.2) with a bolometric luminosity, Lbol≈ 1036erg s−1≈ 300L⊙(Yuan et al. 2003) with episodic flaring activities (Sect.1.2.3).
1.2.2 The quiescent state of Sgr A*
Considering a spherical accretion of matter, the accretion stops when the radiative force exerted by the photons on a matter element of mass m (Frad = L σTm/4 π mpc r2with r the distance to the attractive object center, mpthe proton mass and σT the Thomson cross section for an electron) exceeds the gravitational force under-gone by this stellar matter (FG = −G M m/r2). This theoretical limit on the luminosity for a black hole is defined as the Eddington luminosity:
LEdd = 4πG M mpc σT ∼ 3.4 × 10 11 M 106M ⊙ L⊙. (1.2)
For Sgr A* whose mass is about 4 × 10⁶M
⊙, LEdd = 1.4 × 10¹²L⊙. Its bolometric luminosity is thus about 4.5 × 10⁻⁹LEddwhich implies that Sgr A* is an extremely low-luminosity black hole.
The mass-accretion rate is linked to the bolometric luminosity by ˙M = Lbol/η c2 with η the accretion efficiency (e.g.,Czerny et al. 2013). The mass-accretion rate corresponding to the Eddington luminosity for η =0.1 is ˙ MEdd =2.2 × 10⁻² M 106M ⊙ M⊙yr−1. (1.3)
For Sgr A*, the Eddington accretion rate is 8.8 × 10⁻²M
⊙yr−1. The study of X-ray quiescent emission from Sgr A* determined a mass-accretion rate ˙Mof 10−6M⊙yr−1(e.g.,Baganoff et al. 2003) at the Bondi radius1. By measuring a rotation measure of −5.6 × 10⁵rad m−2 at the sub-millimeter bump of the spectral energy distribution of Sgr A*,Marrone et al.(2007) showed that the mass accretion rate is lower than 2×10⁻⁷M
⊙yr−1 at about 10−4times the Bondi radius if the magnetic field is near the equipartition. The current mass accretion rate of Sgr A* is thus several thousands of time smaller than ˙MEdd.
1The Bondi radius computed as R
B= GMBH/csis the distance where the matter begins to be accreted (Bondi & Hoyle 1944;Bondi
1952;Shvartsman 1971). For Sgr A*, the sound velocity at infinity is cs=550 km s−1for a plasma temperature kBT =1.3 keV (i.e.,
T =15.1 MK), an adiabatic index γ = 5/3 and a mean atomic weight of the gas µ = 0.7 leading to RB=0.072 pc = 1′′.8 = 2.2×1017cm
Figure 1.5: Mean SED of Sgr A* from VLA, the Atacama Large Millimeter Array (ALMA) and the Sub-millimeter Array (SMA) observations between 2012 to 2014 as shown inBower et al.(2015).
To explain the low luminosity of Sgr A*, hot accretion flow models (for a review seeYuan & Narayan 2014and references therein) such as the Advection-Dominated Accretion Flow (ADAF;Ichimaru 1977;Rees et al. 1982;Narayan & Yi 1994;Narayan et al. 1995,1998) have been developed. The ADAF model invokes the decoupling between ions and electrons to explain the low luminosity with a mass-accretion rate ˙Mwhich is supposed to be constant over the distance. Indeed, ions are hot and advect their energy behind the event horizon before it can be radiated, while electrons are cooler than ions but radiate to produce the observed low luminosity. This model predicts a geometrically thick accretion flow which is characterized by a vertical scale similar to the horizontal scale (contrarily to the geometrically thin disk where the vertical scale is small compared to the disk radius). Yuan & Narayan(2014, and reference therein) parametrized the physical char-acteristics (density, magnetic field, sound speed,...) of the hot accretion flow as a function of the black hole characteristics using a self-similar and axisymmetric solution. To explain the low mass-accretion rate, they also introduced the parametrization of ˙Mwith the distance with ˙M = M0(r/r0)sleading to the possibility of the presence of outflows such as winds (carrying most of mass) or jets (carrying most of energy) which eject the majority of matter captured in the Bondi radius before it reaches the black hole. The presence of such kind of mass loss is supported by the deep X-ray observations with Chandra (Wang et al. 2013) and explains the low mass accretion rate of Sgr A*.
The proximity (100 times closer that the center of M31;Schödel et al. 2002) and the large angular diameter (53 µas which is about twice larger than that of NGC 4486 in M87; Johannsen et al. 2012) of Sgr A* make it the best target to investigate such kind of models which can be applied to a majority of SMBH since these objects spend most of their lifetime in a low-luminosity state.
The quiescent luminosity of Sgr A* (Sν) may be measured at different frequencies (ν) to build the spectral energy distribution (SED; see Fig.1.5).
In the centimeter/millimeter range (typically from 1 to 100 GHz), the spectral index α (defined by Sν∝ να) varies between 0.17 and 0.5 (Falcke et al. 1998;Bower et al. 2015) indicating that the emission is produced by an optically thick synchrotron radiation (see AppendixA.1for further details). The quiescent emission flux in this frequency range is not constant but varies slowly with time (Zhao et al. 2001). In the sub-millimeter range (from 217 to 355 GHz), the spectral index is consistent with zero which represents a flat spectrum (Marrone et al. 2006;Bower et al. 2015). The source thus becomes optically thin in this part of the SED named the sub-millimeter bump. The intrinsic size of the quiescent emission at a certain radio/sub-millimeter wavelength can be computed thanks to the relation given inDoeleman et al.(2008) which measured a 3σ range of 37(230 GHz/ν)1.44µas = 4.6(230 GHz/ν)1.441012cm. They pointed out a structure for this size which was confirmed by the observations with the Event Horizon Telescope at 230 GHz (Fish et al. 2016). These authors were able to discriminate between the two position angles of −52◦ and +128◦east found byBroderick et al. (2011). The radio/sub-millimeter quiescent thus seems to be elongated with a position angle of +128◦east.
After the sub-millimeter bump, the spectral index in IR between the L, H, K, and M-bands (i.e., between 1.63 µm and 4.67 µm) is about −0.6 (Hornstein et al. 2007;Witzel et al. 2014b). This emission is produced by
Figure 1.6: The X-ray quiescent emission from Sgr A* as seen by Chandra (Wang et al. 2013). The north is at the top and the east is on the left. Left panel: The dashed circle is the Bondi radius. The contours are at 1.3, 2.2, 3.7, 6.3, and 11×10−4count s−1arcsec−2. Left panel: A zoom on the quiescent emission of Sgr A* which is decomposed into extended (colored image) and point-like (contours of 0.3, 0.6, 1.2, 2.4, and 5 counts pixel−1) components. The dashed line is the orientation of the Galactic plane. The dashed ellipse represents the elongation of the primary massive stellar disk.
an optically thin synchrotron radiation.
The X-ray quiescent emission resolved for the first time with the ACIS-I camera on-board Chandra has a 2–10 keV unabsorbed luminosity of about 2 × 1033erg s−1 (Baganoff et al. 2003). The study of the quies-cent emission was then improved byWang et al.(2013) by using the ACIS-S camera and the High Energy Transmission Grating (HETG) on-board Chandra, i.e., with an on-axis spectral resolution of the zero order of the HETG which is twice better than the previous ACIS-I study. The Chandra angular resolution allowed them to study the quiescent emission of Sgr A* without contamination by the nearby sources (see left panel of Fig.1.6). The authors confirmed that the spectrum of the quiescent emission has several emission lines: the Fe xxv Kα line at 6.7 keV but also the Fe xxv Kβ line at 7.8 keV, Ar xvii and Ar xviii Kα lines at 3.1 and 3.3 keV, S xv Kα line at 2.4 keV and Ca xix Kα line at 3.9 keV. They also observed a weak H-like Fe line at 6.97 keV which suggests the presence of an outflow which eject more than 99% of the accretion mass supporting the hot accretion flow model. Moreover, they found that the overall continuum spectrum is well reproduced by this model with a 2–10 keV unabsorbed luminosity of 3.4+0.9
−0.5× 10
33erg s−1. The spatial distri-bution of the X-ray quiescent emission has an elongated shape in the east-west direction with a size of about 1′′− 1′′.5 plus a point-like contribution which represents 20% of the total quiescent emission (see right panel of Fig.1.6) and which is an unresolved flaring emission in the X-ray light curve.
1.2.3 The Sgr A* multiwavelength activity
A majority of the flux coming from Sgr A* is created in the hot accretion flow with a radiatively inefficient accretion mechanism. However, several times a day, in addition to this quiescent emission, the SMBH emits a much larger number of photons from radio to X-rays during a limited period of time. These events are named “flares”. Flares are important to understand the mechanism of transport and ejection of matter near Sgr A*.
The X-ray activity
Flares were first observed on 2000 Oct. 26 in X-rays with Chandra (Baganoff et al. 2001). During this obser-vation, a bright flare was detected with a 2–10 keV peak unabsorbed luminosity of Lunabs
2−10 keV = (1.0 ± 0.1) × 1035erg s−1. On 2002 Oct. 3, a more luminous flare was detected with Lunabs
2−10 keV =3.6+0.3−0.4× 10
35erg s−1with XMM-Newton (Porquet et al. 2003). On 2012 Feb. 9, an even more bright flare was observed with Chandra (Lunabs
2−10 keV =4.8+1.9−1.1× 10
35erg s−1;Nowak et al. 2012).
The 2012 Chandra X-ray Visionary Program (XVP) campaign of 3 Ms exposure reported byNeilsen et al.
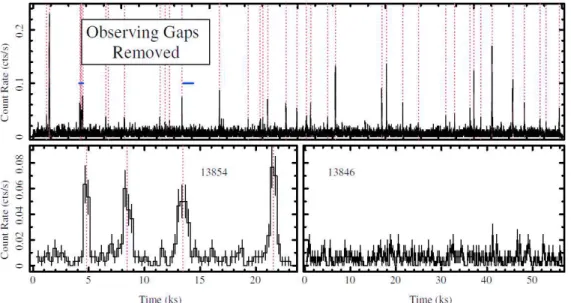
(2013) allowed the authors to detect 39 eruptions (see Fig.1.7) and to increase the flares statistics. The flaring events brighter than 1034erg s−1happen 1.1+0.2
Figure 1.7: Example of X-ray light curves from Sgr A* as seen with Chandra in 2012 (Neilsen et al. 2013). The vertical dotted red lines depicts the position of the X-ray flares. The horizontal blue lines are the time range for the bottom zoomed panels.
luminosity lower than 10 times the quiescent emission) whereas bright flares (above 1035erg s−1) occur every 11.5 days, i.e., 0.087 times a day. The luminosity and fluence (or energy) distribution follow a powerlaw as dN/dL∝ L−1.9±0.4and dN/dF ∝ F−1.5±0.2, respectively. The X-ray flares last from some minutes to 3 hours.
Neilsen et al. (2013, 2015) found that 10–15% of the X-ray quiescent emission is a flaring activity undetected with Chandra.Neilsen et al.(2013) also demonstrated that the X-ray quiescent emission described in Section1.2.2can not be considered as only variable emission. The total X-ray emission from Sgr A* is thus composed by a detected and undetected flaring emission superimposed to the quiescent emission.
No significant quasi-periodic variability are observed in the flare light curves but some sharp drops can be detected (Porquet et al. 2003). The shortest temporal variation during an eruption was observed byPorquet et al.(2003) on 2002 Oct. 3 with a duration of 200 s. Using a supermassive black hole mass of 3 × 10⁶M
⊙ (leading to a Schwarzschild radius of Rs = 8.9 × 10⁹m), they determined the size of the emitting source to about 7 Rsfor a maximum velocity equals to the light speed. From the revised Sgr A* mass of 4 × 10⁶M⊙, the Schwarzschild radius increases to Rs=1.2 × 10¹⁰m leading to a maximum source size of 5 Rs.
The spectrum of the X-ray flares is well reproduced by an absorbed power-law with a best constrained hydrogen column density and spectral index of 16.1+1.9
−2.2× 10
22cm−2and 2.3+0.3
−0.3, respectively (Porquet et al.
2003;Nowak et al. 2012). The NIR activity
On 2003 May 9,Genzel et al.(2003) discovered the first NIR flare from Sgr A* at 1.7 µm with NACO installed on the Very Large Telescope (VLT). Since then, infrared flares have been observed several times a day (Genzel et al. 2003;Witzel et al. 2012) with a typical duration of 40 min (Ghez et al. 2004). Quasi-periodic variabilities of several minutes are observed in the light curve of the NIR flares (Genzel et al. 2003). Substructures with a timescale of 15-25 min can be also seen in their light curves (Genzel et al. 2003;Meyer et al. 2006;Trippe et al. 2007). These timescales correspond to the period of an orbit close to the last stable orbit for a Kerr black hole, i.e., a black hole described by its mass and a non-zero spin.
The NIR flare emission comes from the synchrotron radiation (Eisenhauer et al. 2005;Eckart et al. 2006a; see AppendixA.1for further details) and provides a huge range of flux amplitudes. An example of NIR light curves as observed by VLT/NACO is shown in Fig.1.8.
Contrarily to X-rays, the NIR emission is considered as an overall variable emission and not a quies-cent emission plus some flaring events (Meyer et al. 2014). Figure 3 ofWitzel et al.(2012) shows that the distribution of the flux density observed by VLT/NACO has a maximum at 3.57 mJy. Below this amplitude, the distribution decreases because of the detection limit of VLT/NACO. Above 3.57 mJy, the distribution is highly asymmetric with a rapid decay of the frequency density followed by a long tail until 32 mJy.
Figure 1.8: Example of NIR light curves from Sgr A* as seen with VLT/NACO (Witzel et al. 2012).
Figure 1.9: Sketch of possible radiative processes for the IR/X-ray flaring emission from Sgr A*. an accretion flow model can reproduce the time variability and spectra of IR and millimeter flares whereas jet-dominated models produce less variability compared to observations.
The infrared eruptions show a dramatic change of polarization degree and angle during the flare: the polarization degree can increase from 10% to 40% at the flare peak and increases during the decay phase (Eckart et al. 2006b;Meyer et al. 2006;Trippe et al. 2007). Shahzamanian et al.(2015) found that, above 2 mJy, there is an intrinsic polarization degree of 20%±10% and a preferred polarization angle of 13°±15° which may be linked to the orientation of the accretion disk or jet of Sgr A*.
The simultaneous NIR/X-ray activity
On 2003 June 19, for the first time, a flare was observed simultaneously in X-rays and NIR (Eckart et al. 2004). The brightest NIR/X-ray flare was then observed on 2007 Apr. 4 (Porquet et al. 2008;Dodds-Eden et al. 2009). We now know that each X-ray flare has an infrared counterpart but the contrary is not true (Eckart et al. 2006a, 2008;Hornstein et al. 2007; Yusef-Zadeh et al. 2006a; Dodds-Eden et al. 2009). The delay between the maximum of the NIR and X-ray flare is lower than some minutes (Yusef-Zadeh et al. 2012).
From these simultaneous observations, three possible radiative processes involved during X-ray events are proposed (see AppendixAfor details):
• Synchrotron radiation (upper left part of Fig.1.9) emitted by relativistic electrons which gyrate around magnetic field lines. The relativistic properties of the electrons cause the emission to be collimated. • Inverse Compton process (IC). Two different IC mechanisms can happen: in the first IC mechanism,
the sub-millimeter photons from the hot accretion flow are upscattered by the non-thermal electrons producing the NIR synchrotron emission (bottom left part of Fig.1.9). Since the hot accretion flow is optically thick to sub-millimeter photons, only photons produced near the surface of the flow are available to be upscattered. The second IC mechanism is the upscattering of infrared photons produced by accelerated electrons by the thermal electrons of the hot accretion flow (bottom right part of Fig.1.9). Since the hot accretion flow is optically thin to the infrared photons, all these thermal electrons are
• A shock produced by the interaction between orbiting stars and the hot accretion flow (Nayakshin &
Sunyaev 2003;Nayakshin et al. 2004). This model allowed these authors to simulate the infrared flares but their frequencies and substructures remain difficult to explain with this model. Furthermore, the hot accretion flow has to remain dense enough at large distance from Sgr A* but it is difficult to create such kind of flow with the hot accretion flow model.
• A hotspot model (Broderick & Loeb 2005;Eckart et al. 2006b;Meyer et al. 2006;Trippe et al. 2007;
Hamaus et al. 2009). This model has been developed to explain the variability of the light curve during the flare event. By passing behind the black hole the observed luminosity of the source increases thanks to the gravitational lensing. Then, as the source is moving towards the observer, a second increase of the observed luminosity happens due to the Doppler boosting effect. These eruptions are generally composed by two close peaks whose the first one has a higher amplitude and a shorter duration than those of the second one. A third observed luminosity variation with an even lower amplitude can also be created when the source is located between the observer and the black hole. In this configuration, the observer also receives photons from the non visible part of the hotspot.
• A Rossby instability producing magnetized plasma bubbles in the hot accretion flow (Tagger & Melia
2006;Liu et al. 2006). These instability waves propagate inside and outside their corotational radius, where they have the same velocity than the surrounding medium. The direction of the wave depends of the sign of its specific vorticity. If the ring where the plasma bubbles are produced becomes instable, a Rossby vorticity is created and evolves non-linearly. The instability increases during several rotations and the bubble is accreted towards the center.
• An additional heating of electrons near the black hole due to processes such as accretion instability or magnetic reconnection (Baganoff et al. 2001;Markoff et al. 2001;Yuan et al. 2003,2009).
• An increase of accretion rate when some fresh material reaches the close environment of the black hole (Yuan et al. 2003;Czerny et al. 2013).
• Tidal disruption of asteroids (ˇCadež et al. 2006,2008;Kosti´c et al. 2009;Zubovas et al. 2012). This explanation was proposed since the luminosity released during a NIR flare corresponds to a mass of about 1017kg for an efficiency for converting matter to energy of 10% (Genzel et al. 2003). If an asteroid larger than 10 km is disrupted by the tidal forces in the hot accretion flow of Sgr A*, the shocks and instabilities created by the fragments may produce X-rays with the required luminosity (Zubovas et al. 2012).
The radio/sub-millimeter activity
The radio/sub-millimeter flares from Sgr A* observed since 2003 (Zhao 2003) seems to be delayed by some tens of minutes to some hours after the infrared/X-ray flares (Marrone et al. 2008;Yusef-Zadeh et al. 2008,
2009). This behavior can be explained by an expanding plasmon with adiabatic cooling model (Van der Laan 1966;Yusef-Zadeh et al. 2006b). In this model, the IR activity comes from the synchrotron emission of a plasmon which is initially optically thin to IR and X-ray wavelengths and optically thick to the radio and sub-millimeter wavelengths leading to an occultation of a part of the hot accretion flow. As the source adiabatically
expands, the density of electrons diminishes and the source becomes optically thin to the radio and sub-millimeter wavelengths leading to an increase of observed synchrotron flux from the source and from the part of hot accretion flow that was occulted. The formula governing this model are presented in AppendixB. Other interpretations are also proposed: Brinkerink et al.(2015) supported the collimated outflow model based on the measured time lag between the sub-millimeter and radio light curves and an intrinsic size of Sgr A* at a wavelength λ of (0.52 ± 0.03) mas × (λ/cm)1.3±0.1. On 2012 May 17,Rauch et al.(2016) detected a 7-mm flare which was delayed by 4.5 ± 0.5 h after a NIR flare with the VLBA. They localized this millimeter flare at 1.5 mas southeast of Sgr A* which provides evidence for an adiabatically expanding jet with a speed of 0.4 ± 0.3 c.
1.3 Summary of the current knowledge on the emission from Sgr A*
For the quiescent emission, some constraints may be put on the hot accretion flow thanks to the spectral energy distribution (SED) of Sgr A* in radio/sub-millimeter, infrared and X-rays and the polarization measures observed in radio/sub-millimeter. But the parameters of the ADAF model reported in Yuan & Narayan (2014, and references therein) such as the viscosity, the mass accretion rate and the magnetic field strength are still unconstrained. Nevertheless, it is very important to understand and constrain this low-luminosity model since it could be extended to a large variety of non-active galaxies which represent the dominant extragalactic population in the local Universe. Moreover the ADAF model can be applied from stellar black hole X-ray binaries to low-luminosity AGNs.
For the flaring activity from Sgr A*, we know that the NIR flares are produced by synchrotron radiation but the radiative processes and the electrons acceleration mechanisms for the creation of the X-ray activity are still debated. In addition, we still have some difficulties to explain the range of amplitude and duration of the NIR and X-ray flares and the absence of detected X-ray activity simultaneous to some NIR flares. Moreover, the time delay between the radio/sub-millimeter activity and the NIR/X-ray flares may be explained by the expanding plasmon model but the deduced model parameters are flare-dependent. There is thus no common model parameters which explains all the radio/sub-millimeter activity yet. We thus need a higher number of simultaneous multi-wavelength observations to compare the emission models to the observations and to constrain the physical characteristics of the close environment of Sgr A* such as the magnetic field, the density, the electrons energy density,...
1.4 The Dusty S-cluster Object/G2
The current luminosity of the quiescent and flares characteristics from Sgr A* may change thanks to a recently-discovered object orbiting Sgr A* with a close pericenter. The orbital elements of the DSO/G2 computed in the studies presented hereafter are reported in Table1.1.
Observations of the Galactic Center between 2004 and 2011 with VLT/NACO and SINFONI have revealed the presence of an object named G2 on an eccentric Keplerian orbit towards Sgr A* (Gillessen et al. 2012). The hydrogen Brγ and Brδ and the He i lines were redshifted during all these observations showing that the object has not yet passed its pericenter in 2011. The first orbit estimate based on the study of the spectroscopic lines predicted a pericenter passage on mid-2013. This first study determined the nature of the G2 object as to be a dusty and ionized cloud of gas. This result was supported by two findings: the spec-troscopic lines follow the proper motion seen in the L′-band and the Brγ line measured in regions extracted along the predicted orbit is elongated along the orbit in a velocity-position diagram (with total luminosity of (1.66 ± 0.25) × 10−3L
⊙). Thanks to the M-band observations, the authors determined that this cloud would have a gas and dust temperatures of about 104and 450 K, respectively. The deduced mass and electron density of the G2 are 3 times the Earth mass and 2.6×105cm−3, respectively. During the pericenter passage, the cloud would be disrupted and create a bow shock with the hot accretion flow which would be visible from radio to X-rays. The disruption of the cloud by the tidal forces of Sgr A* and the Rayleigh-Taylor and Kelvin-Helmholtz instabilities was also proposed byMorris(2012).
The formation scenario of G2 was first investigated byBurkert et al.(2012). They used the hot accretion flow model ofYuan et al.(2003) and the physical constrains given by the Chandra observations to reproduce the conditions prevailing at the Galactic Center. They deduced two possible formation scenarios according to
Figure 1.10: The G2’s images in L-band from 2003 to 2012 (Gillessen et al. 2013a). The arrow points toward the G2’s position. The yellow star is the position of Sgr A*.
the nature of this object: a diffuse gas cloud or a compact source. In the diffuse gas cloud model, the object was formed in 1995 thanks to the compression of the slow and cold wind of the luminous blue variable stars by the rapid and hot wind of the O and WR stars in the stellar disk surrounding Sgr A*. The cold core cools rapidly creating drops of condensed gas in the hotter medium. In this model, the G2 would be disrupted during its pericenter passage near Sgr A*. In the compact object model, the G2 is composed by a central source which is obscured by surrounding matter. The central object has to have a temperature lower than 104.6K and to emit most of their luminosity in UV to remain invisible. This compact object would be formed in the stellar disk but its orbit may had become highly eccentric after multiple gravitational interaction with other stars. This scenario would prevent from the disruption of the G2 at the pericenter passage.
Eckart et al.(2013) studied the compact source model and tested the nature of G2 as a star surrounded by a gas and dust disk or shell. The authors thus named G2 as a Dusty S-cluster Object (DSO) to refer to the true nature of the object. They used L′-, H- and Ks-bands observations from VLT/NACO between 2002 and 2012 to predict that, during the pericenter passage, only small part of matter would pass through the Lagrange point between the DSO/G2 and Sgr A*.
Additional observations in March−July 2012 with VLT/NACO lead to updated orbital parameters of the G2 (Gillessen et al. 2013a). The snapshots showing the evolution of the G2 object towards Sgr A* in L-band are given in Fig.1.10. They showed that the luminosity in Brγ is constant from 2004. The evolution of the line width of the Brγ line still favored the gas cloud nature of G2. Some years after the pericenter passage, the spiral-in fragmented matter from the G2 would increase the accretion rate of Sgr A* with a possible reactivation the black hole in an AGN phase. This effect should be visible at all energy bands. The flares characteristics would also be different than those observed today: they would be longer, brighter and would happen more often. Furthermore, hot accretion flow around Sgr A* would become optically thin.
Phifer et al.(2013) used the W. M. Keck I and II data from 2006 to 2012 to update the orbital parameters using the Brγ emission line and the L′-band observations. They did not detect emission from the K′-band up to 20 mag. They pointed out a bias between the orbital parameters measured with the Brγ and in the L′-band since the G2 object is unresolved from the ambient gas in the L′-band. They also deduced that the luminosity in Brγ and in the L′-band were constant within uncertainties from 2006 to 2012.
Gillessen et al. (2013b) updated the orbital parameters of G2 using the Brγ and the L′-band of addi-tional observations taken on 2013 April with VLT/NACO and SINFONI. They extracted the velocity-position diagram along the predicted orbit of G2. The elongation of G2 in the resulting velocity-position diagram still favored the interpretation of an ionized gas cloud. They also detected a blueshifted counterpart implying that a part of the cloud had passed the pericenter between the last 2012 observations and 2013 April.
Table 1.2: Rotational periods and spin-downs of the Galactic Center magnetar taken from the literature.
References Period Period derivative Period second derivative Epocha
(s) (s s−1) (s−1) (MJD)
Mori et al.(2013a) 3.7635417 ± 80 . . . 56408.0417
Mori et al.(2013b) 3.76354455 ± 7.1 × 10⁻⁷ 6.5 × 10⁻¹²± 1.4 × 10⁻¹² . . . . 56409.2657
Gotthelf et al.(2013) 3.7635603 ± 68 . . . 56415.4186
Kaspi et al.(2014) 3.763547895 ± 2.9 × 10⁻⁸ 6.12 × 10⁻¹²± 1.2 × 10⁻¹³ 1.15 × 10⁻¹⁸± 1.5 × 10⁻¹⁹ 56415.42
Rea et al.(2013) 3.7635537 ± 2 × 10⁻⁷ 6.61 × 10⁻¹²± 4 × 10⁻¹⁴ . . . . 56424.55
Kaspi et al.(2014) 3.76363824 ± 1.3 × 10⁻⁷ 1.385 × 10⁻¹¹± 1.5 × 10⁻¹³ 3.9 × 10⁻¹⁹± 6 × 10⁻²⁰ 56513
Coti Zelati et al.(2015) 3.76363799 ± 7 × 10⁻⁸ 1.360 × 10⁻¹¹± 6 × 10⁻¹⁴ 3.7 × 10⁻¹⁹± 2 × 10⁻²⁰ 56513
Coti Zelati et al.(2015) 3.7639772 ± 1.2 × 10⁻⁶ 3.27 × 10⁻¹¹± 7 × 10⁻¹³ . . . . 56710
Mossoux et al.(2016)b 3.76398106+2.0×10⁻⁷
−2.1×10⁻⁷ 3.7684 × 10⁻¹¹+9.9×10
−14
−1.6×10⁻¹³ . . . 56716 Notes:(a)Reference epoch for the computed parameters. MJD=TJD+40000 days=JD-2400000.5 days;(b)The errors are the 90% confidence interval (see left panel of Fig.5.6).
simulations. They found that the Brγ luminosity is well reproduced by mass loss rate of the source of 8.8 × 10⁻⁸M
⊙yr−1and a wind velocity of 50 km s−1. This corresponds to the stellar wind of a T Tauri star, i.e., a young (pre-main sequence) low-mass star. This object would have been formed 106years ago inside the stellar disk and entered in an elliptical orbit after the encounter with a star or a massive black hole.
New observations obtained in 2014 March−August with the W. M. Keck Observatory showed that the L′-band emission remained constant and spatially unresolved from 2004 to 2014 with a deredened flux of 2.1 mJy which ruled out a core-less model (Witzel et al. 2014a). They deduced that the emission of G2 comes from the heating of the surrounding dust by the compact source which would be a main-sequence star (or close to the main-sequence).
Pfuhl et al.(2015) used the observations made from 2013 Aug. to 2014 July with VLT/SINFONI to deduce the new orbital parameters of the G2. They had the first observation of when the object has totally passed the pericenter passage. They computed a radial velocity change from 2700±150 on 2013.7 to −3300±150 km s−1 on 2014.3.
The best constraints on the DSO/G2 characteristics were finally provided by the study of the VLT/SIN-FONI observations obtained in 2014 Feb.–Sept. that I cosigned (Valencia-S. et al. 2015). The results of this study will be reported in Sect.5.1.
1.5 The SGR J1745-29 magnetar
During the regular monitoring of the Galactic Center with Swift, a large increase of the X-ray luminosity was detected during the 1 ks exposure of the 2013 April 24 observation in the 10′′-radius extraction region centered on Sgr A*. This luminosity was first associated to the largest flare observed from Sgr A* (Degenaar et al. 2013). Dwelly & Ponti (2013) triggered pre-approved Swift/XRT observations on 2013 April 25 at 14:38 and 15:58 UT. In these observations, an ongoing large X-ray activity was observed in the 22′′-radius extraction region centered on Sgr A*. On 2013 April 25 at 19:15 UT, Swift/BAT triggered on a short (32 ms) hard X-ray (15–50 keV) burst suggesting that the large X-ray flux is produced by a new Soft Gamma Repeater (SGR) unresolved from Sgr A* (Kennea et al. 2013a). The subsequent Swift/XRT observations allowed the authors to determine the position of the SGR to RA(J2000)=17h45m40s.19 Dec(J2000)=−29◦00′28′′.4 with a 2′′.8 error. This SGR was named SGR J1745-29 byGehrels et al.(2013).
On 2013 April 26, Mori et al. (2013a) observed the Galactic Center between 3 and 10 keV with the Nuclear Spectroscopic Telescope Array (NuSTAR). They found that the spectrum of the eruption is different than those measured for the X-ray flares from Sgr A*: this is a blackbody spectrum with a temperature of kTBB=0.85 keV plus a power-law spectrum with a photon index of Γ = 3.2. They measured an unabsorbed luminosity of 1.8 × 1035erg s−1for a distance of 8 kpc. They searched for a periodic signal during the eruption and found a rotational period of P = 3.7635417(80) s (Table 1.2) on 2013 April 26 01:00 UT leading to a pulse profile composed by three resolved peaks.
Gotthelf et al.(2013) measured the rotational period and spin-down ( ˙P) of the SGR thanks to an observa-tion made by Swift/XRT on 2013 May 3 (Table1.2). The spin-down measurement implies a magnetic field at the equator of B = 3.2 × 10¹⁹√P ˙P = 3 × 10¹⁴G. Due to this high magnetic field, SGR J1745-29 is thus
2013). Left panel: Chandra image taken with the HRC-I from 2005 to 2008 (25 ks). Right panel: Chandra image taken with the HRC-S on 2013 April 24 (10 ks). The magnetar is located at 2′′.4 southeast of Sgr A*.
considered as a magnetar.
Kennea et al.(2013b) determined the spectral parameters of the magnetar for the Swift/XRT observation obtained on 2013 April 25 at 20:51 UT: NH=13.7+1.3−1.2× 1022cm−2, kTBB=1.06 ±0.06 keV and Γ = 3.5±0.3.
Rea et al. (2013) observed the magnetar in X-rays with Chandra/HRC on 2013 April 29 to July 2 and in radio with the Green Bank Telescope (GBT) and the Parkes Telescope from 2013 April 27 to May 4. The source completes the sample of 27 magnetars already observed whose only four display a radio emission. The rotational period and spin-down in X-rays are reported in Table 1.2. These measurements lead to a magnetic field of 1.6 × 10¹⁴G. They showed that the X-ray flux varies as F(t) = F
0e−(t−t0)/τwith t0fixed the time when the first burst was detected, F0=(1.72 ± 3) × 10−11erg s−1cm−2and τ = 144 ± 8 d. This is one of the smallest decay time ever measured for a magnetar. Figure1.11shows that SGR J1745-29 is at about 2′′.4 southeast of Sgr A*. The magnetar can thus only be resolved from Sgr A* with Chandra.
The best constrain on the magnetar position was given by the Australia Telescope Compact Array (ATCA) observations on 2013 May 1 and 31: RA(J2000)= 17h45m40′′.164 ± 0′′.022, Dec(J2000)= −29◦00′29′′.818 ± 0′′.090 (Shannon & Johnston 2013).
The rotational measure of the magnetar may constrain the magnetic field near Sgr A* since the temporal variability of a magnetar depends on the external magnetic field.Eatough et al.(2013) computed the rotational measure (RM) of (−6.696±0.005)×104rad m−2. This is only one tenth of the RM measured at several dozens of parsec from Sgr A*. The lower limit on the magnetic field at 2′′.4 in projection from Sgr A* is 50 µG. Assuming that the magnetic field increases towards Sgr A* as r−1, the inferred magnetic field near Sgr A* is about some hundred Gauss.
Kaspi et al. (2014) used the NuSTAR observations from 2013 April 26 to August 24 to determine the change in the rotational period. Their observations were fitted using two different rotational period and spin-down before and after MJD 56450 (2013 June 7). Their results are reported in Table1.2. The best-fit parameter of the black body model is kT = 0.94 ± 0.02 keV. They also analyzed the Swift/XRT observations from 2013 April 25 to Sept. 15 to derive the evolution of the X-ray flux. They found that the flux has decreased by a factor 2 during 80 d.
The radiative and temporal properties of magnetars vary in much shorter timescale than those of pulsars. The Chandra and XMM-Newton observations from 2013 April to 2014 September used byCoti Zelati et al.
(2015) showed that the blackbody temperature between 1 and 10 keV decreases linearly with time as kT (t) = kT0+ a twith kT0=0.85 ± 1 keV and a = (−1.77 ± 0.04) × 10−4s−1. They found that the decay of X-ray flux is characterized by two exponential decay times: τ = 37 ±2 d until 100 d after 2013 April 25 and τ = 253±5 d for observations more than 100 d after 2013 April 25. They also found a change in the X-ray pulse profiles which are represented in Fig.1.12. The updated rotational period and spin-down is given in Table1.2.
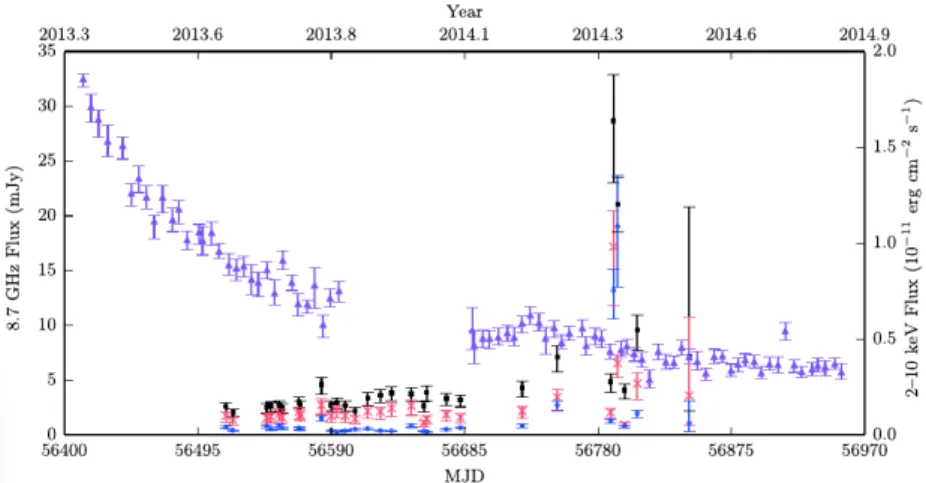
Thanks to 18 months of Swift/XRT observations,Lynch et al.(2015) measured the exponential decay of the magnetar X-ray luminosity (see purple points in Fig.1.13) as F(t) = (1.00 ± 0.06) e−(t−t0)/(55±7 d)+(0.98 ±
0.07) e−(t−t0)/(500±41 d)with t0is the time of the peak outburst. Therefore, the X-ray flux of the magnetar was
high until at least 2014 Sept. leading to a contamination of the flux observed from Sgr A* with the X-ray facilities which are not able to resolve these two close sources (e.g., XMM-Newton or Swift).
Figure 1.12: Pulse profile of SGR J1745-29 measured by Chandra between 0.3 and 10 keV at different epoch (Coti Zelati et al. 2015). The epoch increases from left to right and top to bottom.
Figure 1.13: Evolution of the Galactic Center magnetar flux in X-rays (magenta; right y-axis) and radio (Lynch et al. 2015). The total radio light curve (black; left y-axis) is decomposed in the circular (blue) and linear (red) polarization.
I used and developed some analysis tools for the study of the X-ray observations that I describe in Chapter3. These analysis tools were first validated using the 2011 XMM-Newton observations of Sgr A* (XMM-Newton AO-8; PI: D. Porquet) presented in Chapter4. This campaign was designed to perform the first simultaneous observational campaign in X-rays with XMM-Newton and at 1.3 mm with the Event Hori-zon Telescope (EHT) order to determine the localization of X-ray flares.
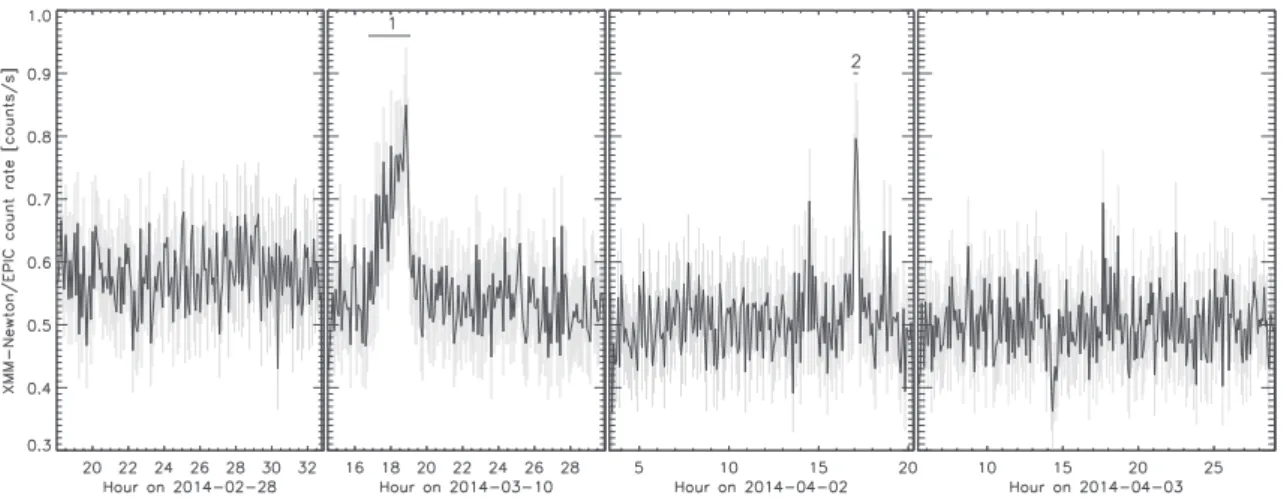
An XMM-Newton large program was submitted in 2012 to obtain multiwavelength observations in order to study evolution of the flaring activity from Sgr A* close to the pericenter passage of DSO/G2 (XMM-Newton AO-12; PI: N. Grosso). Simultaneous XMM-Newton and HST observations were obtained between February and April 2014. Coordinated and simultaneous observations in NIR with the VLT were also granted in this XMM-Newton large program. Additional coordinated and simultaneous obser-vations were also obtained in NIR with VLT and HST and in radio/sub-millimeter with VLA and CARMA. Such simultaneous multi-wavelength observations of Sgr A* during this putative accretion event, may allow us to progress in the understanding of the extremely low-luminosity accretion process onto a SMBH, where black holes are supposed to spend most of their lifetime. The results of this 2014 Feb.–Apr. campaign are presented in Chapter5.
The overall X-ray flares from Sgr A* observed with XMM-Newton, Chandra and Swift during the 1999– 2015 period were systematically detected in Chapter6using the tools developed here in order to determine the significance of any change in the X-ray flaring rate.
Finally, the conclusion of this Ph.D. thesis is presented in Chapter7. I also assess the perspective on the sensitivity for the X-ray flare detection of the ESA next generation mission Athena/X-IFU observations using the tools developed here.
Chapter 2
Observational facilities
In this chapter I provide some overviews of the observational facilities from X-rays to infrared and radio/sub-millimeter used during my Ph.D. thesis.
As explained before, the Galactic Center is not observable in UV and optical because of the extinction. Moreover, the Earth atmosphere also absorbs photons. Only radio, sub-millimeter, optical/UV and small infrared bands can be observed from ground (see Fig.2.1). We thus have to use space telescopes to study the Galactic Center in X-rays.
To perform radio/sub-millimeter and infrared observations, the telescopes must be placed at high altitude. The altitude is important for two points: firstly, the transmission increases with the altitude; secondly, the atmospheric turbulences are smaller at high altitude. Several ground-based telescopes also have adaptive optics working primarily in IR to correct the wave front.
Figure 2.1: Atmospheric transmission on Earth. Credit: NASA/IPAC.
2.1 X-ray facilities
X-ray telescopes need a dedicated focusing system because of the great penetrating power of X-ray pho-tons. Grazing incidence mirrors were thus designed to focus X-ray photons on the camera. A schematic view of the Wolter type I configuration for the X-ray photons focusing is shown in Fig. 2.2. The first part (on the left of this figure; first reflection) is composed by parabolic concentric mirrors whereas the last part (on the right of this figure; second reflection) contains hyperbolic concentric mirrors.
2.1.1 XMM-Newton
This is the telescope I used the most during my Ph.D. thesis. It is a satellite from ESA launched on 1999 Dec. 10 (Jansen et al. 2001;ESA: XMM-Newton SOC 2013). Its orbit is highly eccentric (e = 0.72) with a pericenter distance inside the radiation belts which imposes a stop of any observation during this passage.