First International Conference on Bio-based Building Materials June 22nd - 24th 2015 Clermont-Ferrand, France
EXPERIMENTAL STUDY OF THE HYGROTHERMAL BEHAVIOUR OF HEMP
SHIVES-BASED PRECAST BLOCKS AT MATERIAL AND WALL SCALES
T. L. Vu1, S. Spagnol2, C. Magniont1*
1
Université de Toulouse, Laboratoire Matériaux et Durabilité des Constructions, 135 avenue de Rangueil, 31077 Toulouse Cedex 4, France
2
Université de Toulouse, Laboratoire Physique de l'Homme Appliquée à Son Environnement, 118 route de Narbonne, 31062 Toulouse Cedex 9, France
*Corresponding author; e-mail: camille.magniont@insa-toulouse.fr
Abstract
This work aims to characterize the hygrothermal behavior of precast blocks made of hemp shiv aggregates and of a pozzolanic binder. The first part of the paper consists in the determination of basic hygrothermal properties of hemp concrete at material scale: thermal conductivity, thermal effusivity, vapor sorption isotherm, and water vapor permeabilitywere assessed. The second part aims to develop a new tool allowing hygrothermal solicitation of a whole wall made of hemp concrete blocks sealed with a pozzolanic mortar. We used two climatic chambers to study the response of the wall under constant and sinusoidal variations of temperature and relative humidity of the ambient air. This work revealed the good insulation capacity of the studied precast blocks and their ability to regulate the relative humidity of indoor air. It allowed the development of a new experimental tool for the study of hygrothermal behavior of hemp concrete masonry wall under constant and sinusoidal solicitations.
Keywords:
Hemp concrete; Hygrothermal behavior; Material and wall scales
1 INTRODUCTION
In the sectors of building construction and renovation, the reduction of environmental impacts and the improvement of user’s comfort constitute major concerns. Bio-based building materials may be a good response to this challenge due to their environmental benefits: they are made from renewable raw materials (mainly local byproducts of agricultural activities) and are carbon neutral. Moreover, previous studies highlighted their performances in terms of hygrothermal transfers ([Samri 2008], [Oumeziane 2013]). These properties could constitute a lever for the increase of energy performance and comfort in buildings.
This study was part of the Neocampus cross-disciplinary project initiated and financially supported by Toulouse III University. This project involves 8 laboratories and aims to combine their skills to improve every day comfort of the university community and reduce the buildings operating costs and their ecological footprint.
This work aims to characterize the hygrothermal behavior of precast blocks made of hemp shiv aggregates and of a pozzolanic binder. The first part of the paper consists in the determination of basic
hygrothermal properties of hemp concrete at material scale: thermal conductivity, thermal effusivity, vapor sorption isotherm and water vapor permeability were assessed. The second part aims to develop a new tool allowing hygrothermal solicitation of a whole wall made of hemp concrete blocks sealed with a pozzolanic mortar.
2 HYGROTHERMAL BEHAVIOR AT
MATERIAL SCALE 2.1 Material and sampling
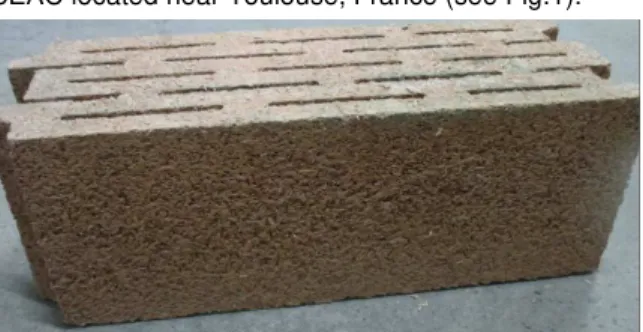
This study is based on hemp shives based precast blocks which are industrially produced by the company SEAC located near Toulouse, France (see Fig.1).
The sizes of the precast blocks are 20cm x 20cm x 50cm (height x thickness x length).
The binder used is an original binder based on a mix of lime and metakaolin, a pozzolanic addition obtained by flash calcination of kaolinite at 700°C.
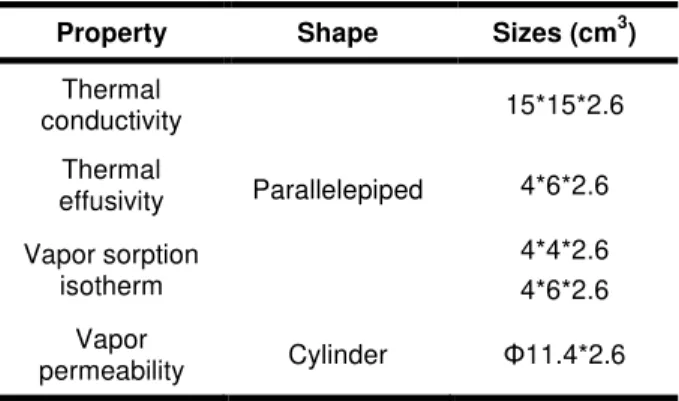
70 samples of different dimensions were extracted from the blocks by circular sawing or coring. Tab. 1 synthesized the shape and sizes of specimens for each measurement.
Tab.1: Shape and sizes of the samples extracted from the precast blocks for hygrothermal measurements.
Property Shape Sizes (cm3)
Thermal conductivity Parallelepiped 15*15*2.6 Thermal effusivity 4*6*2.6 Vapor sorption isotherm 4*4*2.6 4*6*2.6 Vapor permeability Cylinder Φ11.4*2.6 Dry density was determined for all the 70 samples dried in oven at 50°C until the change in mass of the sample was less than 0.1% between two weightings 24 hours apart. Weightings were performed on a ±0.01g accurate balance. Each size was obtained by averaging 4 successive measurements with a 0.01mm accurate caliper.
This experimental campaign revealed an average dry density of 453kg/m3 with a coefficient of variation (COV) of 11.4%. The distribution of density measurements for all the samples is represented on Fig. 2. Density measurements range from 338 to 568 kg/m3 but more than 88% of the samples present a dry density between 375 to 525 kg/m3. 0 5 10 15 20 25 30 325-375 375-425 425-475 475-525 525-575 N u m b e r o f sa m p le s
Classes of dry density (kg/m3)
Fig. 2: Distribution of dry density for all the specimens.
2.2 Methods
Thermal conductivity
Tests were performed using the guarded hot plate method with a λ-Meter EP 500. Measurements were made at 25°C with a difference of temperature of 10K between the two plates. Steady state was assumed to be reached when the change in conductivity was less than 1% in 60 minutes.
Plane-parallel samples with 15x15cm² sections and 2.6cm thickness were tested.
Specimens were dried prior to testing in oven at 50°C until the change in mass of the sample was less than 0.1% between two weightings 24 hours apart.
The results presented are mean values of measurements taken on at least 3 different samples.
Thermal effusivity
The Desprotherm device (FAHRENHEIT-Thermicar, France) was used to measure thermal effusivity. It is based on the method of asymmetric hot plates: the material to be characterized is placed between two plates of an insulating material having known characteristics. The method requires a sample with parallel faces, which must have the same dimensions (60 x 40 mm ²) as the resistive circuit (heating resistor). The measurement of effusivity is made at the front of the sample with the assumption that the material is semi-infinite. This requires sufficient thickness to ensure that the heat flow does not pass through the sample during the test (about 10 minutes).
The results presented are mean values of measurements taken on at least 3 different samples.
Water vapor sorption
Adsorption measurements were achieved according to the French standard NF EN ISO 12571 [ISO 12571]. Both a climatic chamber and salt solutions were used to maintain a constant level of relative humidity for 5 different values (8%, 23%, 50%, 75%, and 93%). The temperature was maintained at 23°C during all the experiment.
Each sample was periodically weighed until the difference between two consecutive measurements, 24h apart, was less than about 0.1%. The final value corresponds to the average moisture content of all the samples. The standard deviation increased with relative humidity to reach as much as 0.83% for ψ=93%. 5 to 8 samples were tested for each relative humidity.
Water vapor permeability
The vapor diffusion measurement was carried out according to the French standard NF EN ISO 12572 [ISO 12572].
Wet cups (93%) had been realized by sealing cylindrical hemp concrete samples with a mix of paraffin (40%) and beeswax (60%) on PVC cups containing saturated salt solutions of KNO3. Three samples were tested.
The whole systems were placed in a climatic chamber kept at 23°C and 50%RH. The samples mass was monitored through diary weightings. The moisture flux through the specimen gv (kg/m2.s) was then determined.
Two parameters can be calculated (see (2)): the water vapor permeability (π) and the water vapor resistance factor (µ).
d
p
d
p
g
v a v v.
.
.
µ
π
π
∆
=
∆
=
(2)where ∆pv (Pa) is the difference in vapor pressure at the opposite sides of the sample, πa is the water vapor permeability of stagnant air and d (m) is the thickness of the sample.
2.3 Thermal properties
Thermal conductivity
The measurements of thermal conductivity achieved on 3 different samples (at least 2 tests for each sample) are plotted on Fig. 3 together with experimental results from the literature ([Collet 2004], [Evrard 2008], [Oumeziane 2013], [Dinh 2014], [Walker
2014]). The average thermal conductivity of precast hemp concrete was 0.099W/m.K with a COV of 4.3%. The previous results were in good accordance with the empirical relation (3) established in [Cerezo 2005] and plotted on Fig.3.
0194
.
0
0002
.
0
×
+
=
ρ
λ
(3)Nevertheless we can note that, for the same dry density, the thermal conductivity of precast blocks studied is lower than the one of hemp concretes presented in the literature. Even if thermal conductivity is strongly influenced by density, other parameters can significantly modify the thermal conductivity of hemp concrete. According to Collet [Collet 2014b], the hemp to binder ratio, the properties of hemp shiv (fibred or not), the method of fabrication (molded, vibrocompacted or precast) and the nature of the binder can induce variations in the dry thermal conductivity of the composite. This last point is opposed to the findings of Walker [Walker 2014] that concluded that binder type did not influence significantly the thermal properties of hemp concrete.
0 0,02 0,04 0,06 0,08 0,1 0,12 0,14 0,16 0,18 0,2 100 200 300 400 500 600 700 800 λ (W /m .K ) ρ (kg/m3)
Data from literature Cerezo's model Present study
y = 0,0002x + 0,0194
Fig. 3: Comparison of thermal conductivity of hemp concrete measured in this study and data from the
literature
Another study [Stefanidou 2010] demonstrated that the incorporation of pozzolanic addition in pure lime lead to a decrease of thermal conductivity whereas it was the inverse when white cement was added. This could explain the good thermal property of the precast hemp concrete studied, as its binder is mainly designed with metakaolin which is a pozzolanic addition.
Thermal effusivity
The thermal effusivity of precast hemp concrete at dry state and for samples in equilibrium with air at 0, 8, 50, 75 and 93%RH is represented on Fig. 4.
0 50 100 150 200 250 300 0% 20% 40% 60% 80% 100% b ( J/ m 2.K .s 1 /2) Relative humidity (%)
Fig. 4: Thermal effusivity of precast hemp concrete versus relative humidity of indoor air.
We can note a significant experimental dispersion on these measurements especially for the points at 50 and 93%RH. These results do not show a significant
influence of water content on thermal effusivity (it ranges from 201 to 240 J/m2.K.s1/2 for relative humidity between dry state and 93%RH).
This statement is in accordance with the results of Evrard [Evrard 2008] who obtained an almost constant effusivity until the highest relative humidity (RH>93%). Dry thermal capacity of precast hemp concrete can be calculated from the measurements of dry effusivity (b0), dry density (ρ0) and dry conductivity (λ0) (4).
0 0 2 0 0
λ
ρ ⋅
=
b
C
(4)Relation (4) gives a calculated value of thermal capacity of 912J/kg.K. This value is in accordance with the result found by Collet [Collet 2004] of 1000J/kg.K. Another study [Evrard 2008] exposed a higher value of 1560J/kg.K.
2.4 Hygric properties
Water vapor sorption isotherm
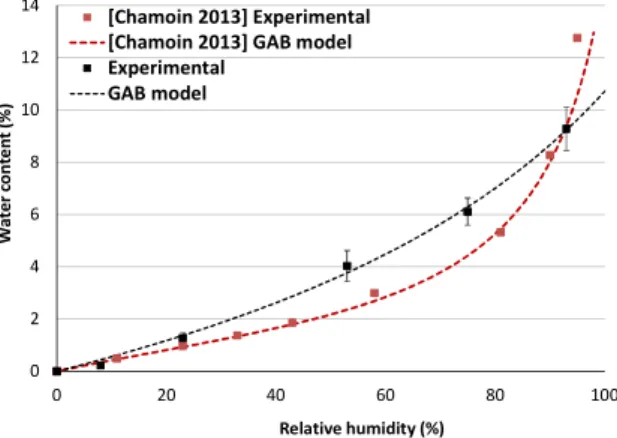
Sorption measurements were realized and reported on Fig. 5. The GAB model, widely used in literature, was fitted on the experimental data and plotted on Fig.5. The adsorption isotherm is compared with results from literature [Chamoin 2013]. For relative humidity below 90%, precast hemp concrete presents water content slightly higher than sprayed hemp concrete studied by Chamoin.
The highest relative humidity tested during our study was 93%RH. Higher humidity should be tested to complete the isotherm with the area of capillary condensation. The fitting parameters will be strongly influenced, and the model presented would not be able to describe correctly the isotherm for relative humidity above 93%RH. 0 2 4 6 8 10 12 14 0 20 40 60 80 100 W a te r co n te n t (% ) Relative humidity (%) [Chamoin 2013] Experimental [Chamoin 2013] GAB model Experimental
GAB model
Fig. 5: Experimental measurements and GAB regression curve for water vapor sorption of hemp
concrete at 23°C. Water vapor permeability
Water vapor permeability of precast hemp concrete was measured with the wet cup method. The results are reported in Tab 2. with those of [Chamoin 2013].
Tab. 2: Water vapor diffusion characteristics of precast hemp concrete (average value (standard deviation)).
Source Method (kg/mρ 3) π x 10 -11
(kg/s.m.Pa) µ This study Wet cup 425.0 (15.4) (0.66) 6.68 (0.30) 3.02
[Chamoin
The results of permeability confirm the highly permeable behavior of hemp concrete. Few results were found in the literature applying the wet up method. Chamoin [Chamoin 2013] assessed with this method the water vapor permeability of precast hemp concrete and found similar results (see Tab. 2). 3 HYGROTHERMAL BEHAVIOR AT WALL
SCALE
After characterizing hygrothermally the hemp concrete used to make the precast blocks, the second step is to understand the behavior of a whole wall made of these blocks when it is subjected to different solicitations in temperature and in relative humidity in order to approach their real behavior on site. Studies on walls made of bio-based materials involve apparatus based on climatic chambers.
The studied wall can serve as a separation between a climatic chamber and an indoor local [Samri 2008] or it can also be a separation between two climatic chambers [Colinart 2013] [Dubois 2014] [Lelievre 2014]. A recent study deals with the hygrothermal behavior of a timber-frame hemp concrete wall using an experimental device made of two air-conditioned rooms [Oumeziane 2013][Collet 2014].
Different types of materials are used in these studies but all of them conclude that the use of hemp-based materials improve the hydric regulation of indoor room. In this section, hemp-shives precast blocks are studied as a part of a whole wall. It is necessary to understand how these blocks behave when they are subjected to different solicitations in temperature and in relative humidity in order to approach their real behavior in buildings.
3.1 Experimental set up
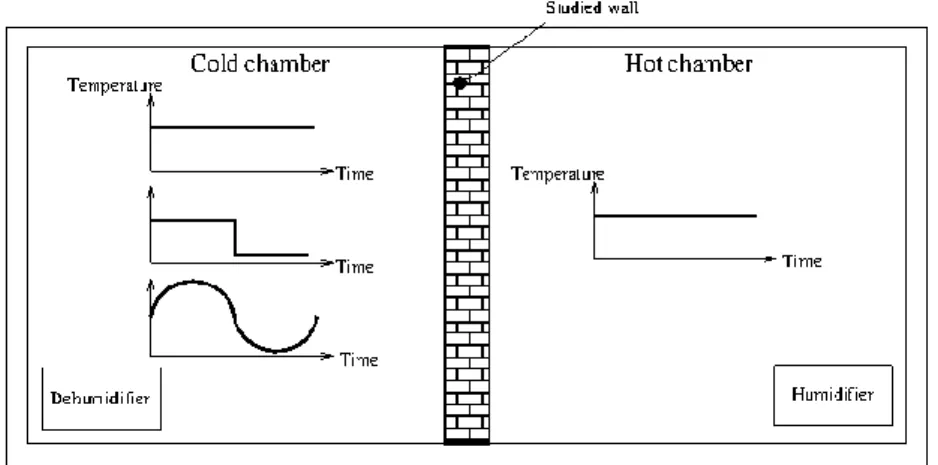
To proceed the experiments on a wall, two climatic chambers are used. The drawing on Fig. 6 shows the two chambers separated by the studied wall. The chambers are well isolated from the inner conditions of the experiment room so that these conditions do not influence the ambient conditions into the chambers. On the right, the chamber is called the « hot » chamber. It represents the interior of a building. The temperature can be maintained constant as a function of time thanks to regulated electrical resistances. It can be set from 10 to 40°C. The relative humidity is controlled by a humidifier so that a production of water vapour in a real local can be reproduced.
On the left of the drawing, there is the so called « cold » chamber representing the outside ambiance. Thanks to a regulator, the temperature can be constant or variable as a function of time. For example, the input signal can be an ascendant or a descendant step between two constant temperatures or a sinusoidal curve modelling the alternating temperature between days and nights. The temperature in the chamber is within the range -30/25°C. A refrigerating machine allows to obtain low temperatures. A dehumidifier put into the chamber is used to maintain the relative humidity to an acceptable value when the temperature drops.
Each chamber is around 2.3 m high, 3.3 m long and 1.6 m deep. The two chambers are ventilated so that the ambiances are homogenised. They are isolated from the experiment room with 10 cm of extruded polystyrene. In conclusion, the temperature is regulated in each chamber so as to reproduce ambient conditions as real as possible and the relative humidity can be treated to reach an acceptable value in the cold chamber.
3.2 Wall construction and instrumentation
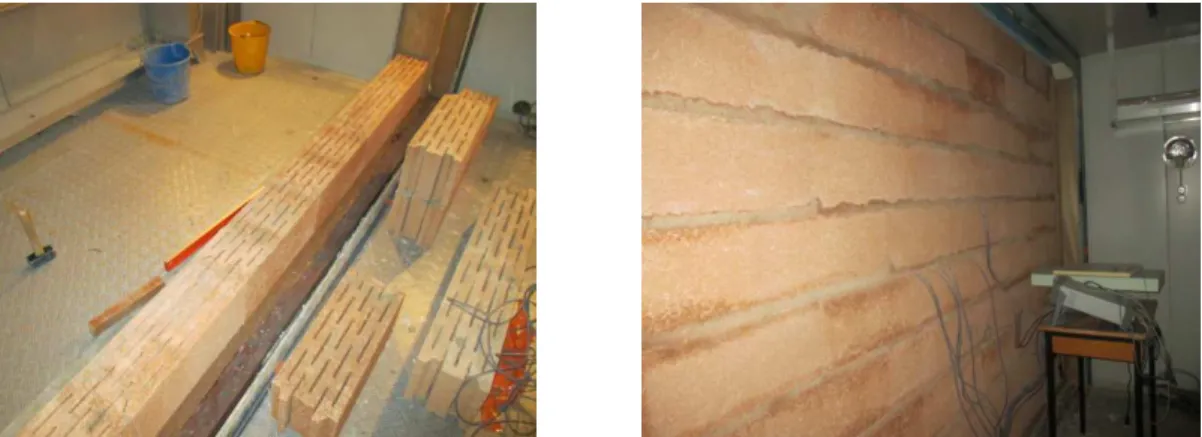
A wall is constructed between the two chambers using the hemp-shives precast blocks (see Fig. 7). A horizontal mortar whose binder is made of 70% of metakaolin and 30% of hydrated lime is put between each row of blocks. The thickness of the mortar layers is around 1 cm. There is no vertical joint because the blocks overlap one another.
The wall is instrumented with different kind of sensors: • 10 sensors (Honeywell HIH-4602-C) are used to
measure temperature and relative humidity at the same time. The temperature sensor type is an integral precision RTD with 2 wires and has an accuracy of ± 0.1°C.
• To measure relative humidity, the sensor construction consists of a planar capacitor with a second polymer layer. It has an accuracy of ± 3.5%. The sensor is cylindrical which is 8 mm in diameter.
• 2 heat flow sensors are used to measure the heat flow through the wall. They are rectangular (20 x 25 cm) and have a relative accuracy of 10 %. Moreover, there is one thermocouple type J in the centre of each sensor to measure the temperature with an accuracy of ± 0.3°C.
.
Fig. 7. Photographs of the construction of the wall between the two chambers (on the left) and of the sensor wires going out of the wall in the hot chamber (on the right).
Fig. 8: Positions of the temperature and relative humidity sensors.
The distribution of the sensors through the wall is shown in Fig. 8 where the top view of the two instrumented blocks found in the middle of the wall is represented. One sensor measuring the temperature and the relative humidity is put directly into the ambiance of each chamber at half height of the wall (sensors 1 and 10). Two others are positioned at the surfaces of the wall (sensors 2 and 9) Five sensors are introduced into air cavities along the thickness of the block found in the middle of the wall (sensors 3, 4, 5, 6 and 8). Finally the remaining one is introduced in an air cavity of the block beside the instrumented block at the same height as the other sensors (sensor 7).
The last one is used to validate the hypothesis of one-dimensional flow. It has to be noted that these sensors are not aligned along the thickness to allow wires (8 mm in diameter) to go out through the mortar joint above the block (see Fig. 7 on the right).
The two heat flow sensors are positioned on each surface (sensor A in the cold chamber and sensor B in the hot chamber.) just above the instrumented block 1. The contact between the sensor and the material is provided by thermal paste.
3.3 Data processing
All the sensors are linked to a data acquisition processor which is linked to a computer outside the chambers. Values are registered every 5 minutes. The obtained data (temperatures, relative humidities or heat flows) are then plotted according to time. The curves show fluctuations (see Fig. 9).
Fig. 9: Example of registered data of temperature curves as a function of time.
• Inside the hot and cold chamber, there are fluctuations around the temperature set points due to the power of the refrigeration unit and the heating resistances, and also due to on/off regulation.
• Every 7 hours, the chiller performs defrost for security reasons. This operation can be seen on the curve of the air temperature of the cold chamber (sensor 1). It is represented by several picks at equal distances. These picks are then found on the curve representing the temperatures inside the blocks with a large damping and a small phase shift.
In order to remove these fluctuations, all the signals are treated with a Fourier transformation (see Fig. 10).
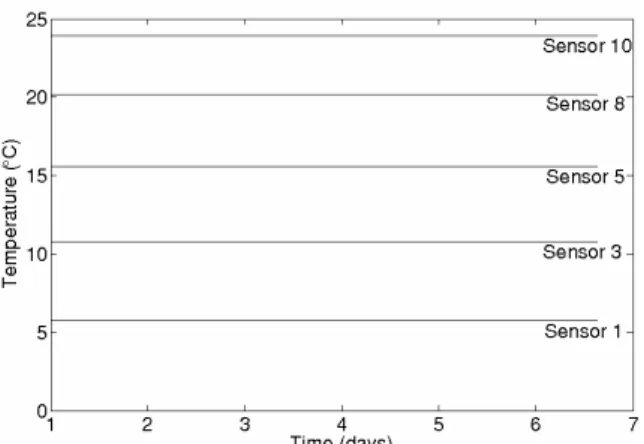
Fig. 10: Example of temperature curves after Fourier transform for constant temperature set points.
3.4 Types of solicitations
Several types of solicitations have been studied and are recapitulated in Tab. 3. The solicitation 0 consists of the initial conditions for all solicitations. A temperature of 22°C and a free relative humidity are imposed in the hot and cold chambers. A free relative humidity means that no device is turn on to control humidity inside the chambers. These conditions are used at the beginning of all the solicitations during one day. In the solicitation 1, a constant temperature (22°C) and a free relative humidity are used in the hot chamber. In the cold chamber, the set points are 6°C in temperature and 80% of relative humidity. It lasts 7 days. The principal aim is to calculate the thermal resistance of the wall. A variable temperature in the cold chamber is considered in the solicitation 2 whereas the other conditions are the same as in the solicitation 1. This unsteady state is used to evaluate the inertia of the wall. A sinusoidal signal in temperature (T) as a function of time (t) is chosen to reproduce diurnal real conditions (see (5)).
⋅
×
∆
+
=
t
P
T
T
T
sin
2
π
(5)with
T
=
14
°
C
which is the mean temperature,C
T
=
°
∆
8
which is the amplitude of the signal andP
=
24
h
which is the period of the signal. The signal is repeated during 7 days.The last solicitation 3 is the same as the solicitation 1 during 4 days. After 3 days, a sudden production of water vapour is brought into the hot chamber and then stopped after 1 hour. This solicitation is studied to understand how the wall behaves to interior extreme conditions like doing the cooking in a kitchen or taking a shower in a bathroom.
3.5 Results and discussion Solicitation 1
For the solicitation 1, the steady state is obtained after 1 day. It has been verified that:
• The temperatures of sensors 2 and 9 are in good agreement with the thermocouples of the heat flow sensors A and B, respectively. Only data from the sensors 2 and 9 are then presented.
• The temperatures of sensors 7 and 8 are also in good agreement. The hypothesis of one- dimensional system is then verified. Only data from the sensor 8 will be provided.
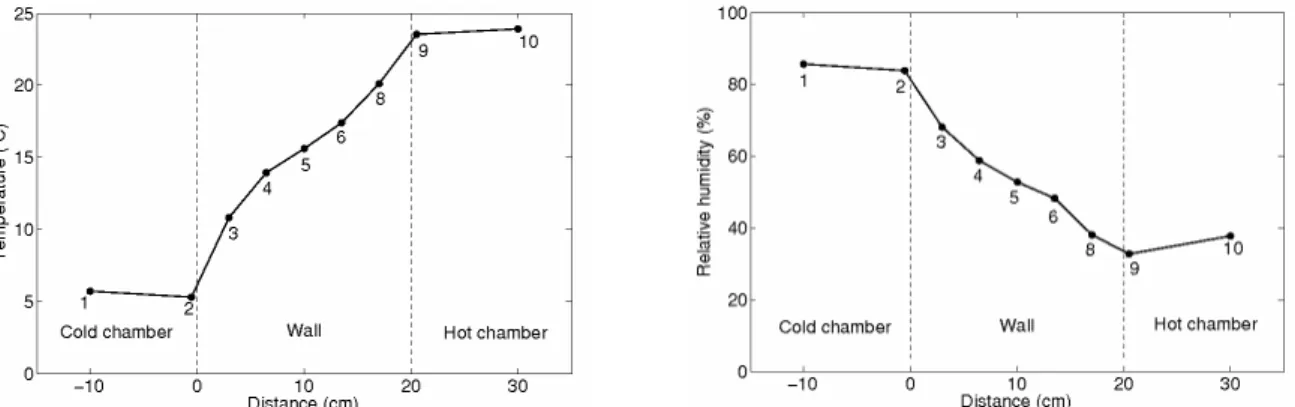
Results at steady state are presented in Fig. 5 for temperature and relative humidity profiles through the wall. First, we can note that the set points of 6°C and 80% are well reached in the cold chamber whereas the set point of 22°C is exceeded in the hot chamber. The temperature in the hot chamber reaches 24°C. The difference between the set point and the real temperature is registered for all the solicitation. It seems that the sensor used for the regulation inside the hot chamber has always the same disparity. It does not influence the results and the following discussions. When the relative humidity is free in the hot chamber, values between 35 and 40% are registered.
Concerning the profiles inside the wall, they tend to linear profiles. The slopes near both surfaces are steeper. The phenomenon is more pronounced between sensors 2 and 3.
Finally, the experimental thermal resistance is determined applying relation (6).
mean
T
T
r
Φ
−
=
9 2 exp (6)where T2 and T9 are the temperatures of the sensors 2
and 9, and Φmean is the mean heat flow density
between sensors A and B. Values between sensors A and B are quite different. It is important to note that, even if thermal paste has been added to obtain a good contact between the surface of the wall and the heat flow sensor, it remains difficult to measure a heat flow density with accuracy because of the high roughness and the porosity at the material surface. Besides, some errors have been noted on values registered by the sensor B that is why the thermal resistance is calculated only with values from sensor A. The temperature difference between the two surfaces is equal to 18.2°C and the heat flow is equal to 8.7 W/m2. A thermal resistance of 2.1 ± 0.3m2.K/W is then
obtained.
Duration Hot chamber Cold chamber Hot chamber Cold chamber (Days)
0 22 22 Free Free 1 Inital conditions
1 22 6 Free 80 7 Thermal resistance
2 22 Sinusoid Free 80 7 Inertia
3 22 6 Vapour production 80 4 Extreme conditions
Number Temperature (°C) Relative humidity (%) Aim
Tab. 3: Summary of all types of studied solicitations.
Fig.11: Temperature (left) and relative humidity (right) profiles through the wall at steady state for solicitation 1. Solicitation 2
The Fig. 6 presents the results obtained for the solicitation 2 for the temperatures and the relative humidities as a function of time. It shows registered data over 3 days (3 periods of 24 hours) when the regime is established.
The amplitude of the temperature signal is greatly reduced in the cold side. Between sensors 2 and 3, a damping of 36% is measured. The wall attenuates the signal very well. Moreover there is a phase shift of 3.5h between sensors 2 and 8 over a period of 24h. These
two observations allow to show that the wall has a good thermal inertia.
The evolution of the relative humidity in the cold chamber is governed by the temperature signal. The relative humidity evolves around 80% which is the set point of the dehumidifier. It has an influence till the centre of the block where the relative humidity of the sensor 5 is almost constant. Because of a free relative humidity in the hot chamber, the signal also follows a sinusoidal evolution reversed compared to the sinusoid in the cold chamber.
Fig. 12: Temperature (left) and relative humidity (right) as a function of time for solicitation 2 over 3 days. Sollicitation 3
The results for the solicitation 3 are shown on Fig. 13. In order to understand the physical phenomena, the Fourier transform is not applied to the registered data that is why some picks are visible for the curve representing sensors 1 and 2, due to the defrost of the chiller.
Use the humidifier for an hour increases the relative humidity from 40 to 54% in the hot chamber. This
increase influences temperatures throughout the wall. The steady state is then recovered after 15 hours. Temperature fluctuations within the wall are phase shifted. It can be explained by the phenomena of phase changes like evaporation and condensation in the pores of the material. It allows to illustrate that the hemp-shives blocks could ensure a buffer effect and have a good permeability to evacuate an excess of humidity from a room.
4 CONCLUSION
In its first part, this paper aimed to assess the basic hygrothermal properties of hemp concrete precast blocks industrially produced.
Results obtained for all the properties are quite similar with those of the literature. The main results to remember are:
• The low dry thermal conductivity is certainly due to the metakaolin binder.
• The effusivity does not seem to be influenced by water content in the range from 0 to 93%RH.
• The water vapor isotherm is well described by the GAB model. Higher humidity than 93% should be tested to complete the isotherm.
• The water vapor permeability is significant. In the second part of the paper, hemp concrete precast blocks are used to construct a wall separating two chambers. The wall is instrumented to follow the evolutions of temperatures and relative humidities according to three different solicitations. It has been shown that:
• The wall has a good thermal resistance at steady state.
• The wall has a good thermal inertia (large damping and phase shift).
• The wall can regulate the relative humidity of indoor air.
The two climatic chambers are then a new tool to understand the behavior of a whole wall made of hemp concrete precast blocks. The main point to improve now is the regulation of temperatures and relative humidities inside both chambers.
5 ACKNOWLEDGMENTS
The authors would like to thank Néocampus Toulouse III University for its financial support and the SEAC company, Cazères, France, for providing hemp concrete precast blocks.
6 REFERENCES
[Cerezo 2005] Cérézo V., Propriétés mécaniques, thermiques et acoustiques d’un matériau à base de particules végétales : approche expérimentale et modélisation théorique. Thèse de doctorat de l’ENTPE, June 2005.
[Chamoin 2013] Chamoin J., Optimisation des propriétés (physiques, hydriques et mécaniques) de bétons de chanvre par la maîtrise de la formulation. Thèse de doctorat de l’INSA Rennes, July 2013.
[Colinart 2013] Colinart T., Glouannec P., Pierre T., Chauvelon P., Magueresse A., Experimental Study on the Hygrothermal Behavior of a Coated Sprayed Hemp Concrete Wall. Buildings, 2013, 3, 79-99. [Collet 2014] Collet, F.; Pretot, S.; Experimental highlight of hygrothermal phenomena in hemp concrete wall. Building and Environment, 2014, 82, 459-466.
[Collet 2014b] Thermal conductivity of hemp concretes: Variation with formulation, density and water content, Construction and Building Materials, 2014, 65, 612-619.
[Dubois 2014] Dubois S., Modelling the hygrothermal behaviour of crop-based construction materials. Thèse de dectorat de l'Université de Liège, 2014. [Dinh 2014] Dinh The M., Contribution to the development of precast hempcrete using innovative pozzolanic binder, Thèse de doctorat de l’Université de Toulouse, May 2014.
[Evrard 2008] Evrard A., Transient hygrothermal behaviour of Lime-Hemp materials, Thèse de doctorat du l’Ecole poytechnique de Louvain, 2008. [ISO 12571] NF EN ISO 12571 October 2000, Hygrothermal performance of building materials and products - Determination of hygroscopic sorption properties.
[ISO 12572] NF EN ISO 12572 October 2001, Hygrothermal performance of building materials and products - Determination of water vapour transmission properties.
[Lelievre 2014] Lelievre D., Colinart T., Glouannec P., Hygrothermal behavior of bio-based materials including hysteresis: Experimental and numerical analyses. Energy and Buildings, 2014, 84, 617-627. [Oumeziane 2013] Evaluation des performances hygrothermiques d’une paroi par simulation numérique: application aux parois en béton de chanvre, thèse de doctorat de l’INSA Rennes, March 2013.
[Samri 2008] Samri D., Analyse physique et caractérisation hygrothermique des matériaux de construction: approche expérimentale et modélisation numérique. Thèse de doctorat de l’ENTPE, October 2008.
[Stefanidou 2010] Stefanidou M, Assael M, Antoniadis K, Matziaroglou G. Thermal conductivity of building materials employed in the preservation of traditional structures. Int J Thermophys 2010;31:844–51.
[Walker 2014] Walker P., Pavia S.; Moisture transfer and thermal properties of hemp-lime concretes. Construction and Building Materials, 2014, 64, 270– 276.