HAL Id: hal-00752601
https://hal.archives-ouvertes.fr/hal-00752601
Submitted on 16 Nov 2012
HAL is a multi-disciplinary open access
archive for the deposit and dissemination of sci-entific research documents, whether they are pub-lished or not. The documents may come from teaching and research institutions in France or abroad, or from public or private research centers.
L’archive ouverte pluridisciplinaire HAL, est destinée au dépôt et à la diffusion de documents scientifiques de niveau recherche, publiés ou non, émanant des établissements d’enseignement et de recherche français ou étrangers, des laboratoires publics ou privés.
EchoScan: a new system to objectively assess peripheral
hearing disorders
Thomas Venet, Pierre Campo, Cécile Rumeau, Hélène Eluecque, Cécile
Parrieti-Winkler
To cite this version:
Thomas Venet, Pierre Campo, Cécile Rumeau, Hélène Eluecque, Cécile Parrieti-Winkler. EchoScan: a new system to objectively assess peripheral hearing disorders. Noise and Health, Medknow Publi-cations, 2012, 14 (60), pp.253-259. �10.4103/1463-1741.102964�. �hal-00752601�
Introduction
Pure-tone air-conduction audiometry (PTA) is a subjective test relying on a patient’s capacity to determine thresholds of hearing sensations to frequency-specific acoustic stimuli. Given the plasticity of the central auditory system, which can compensate slight inner-ear dysfunctions, threshold shifts measured by PTA may underestimate cochlear injuries.[1- 4] As a result, PTA should be completed by supplementary prevention tools. Today, clinicians and occupational physicians can measure distortion-product otoacoustic emissions (DPOAEs) to detect inner-ear dysfunctions, while isolating possible central influences. When two-tone stimulations with frequencies f1 and f2, known as primaries, are presented simultaneously to the ear canal, several DPOAEs can be measured in only few seconds. The most
prominent DPOAE is the cubic-difference DPOAE at 2f1-f2. The amplitude is much larger than that of other distortion products, and its existence requires a frequency-selective compressive nonlinearity in basilar membrane mechanics in the region where the primaries overlap.[5,6] This nonlinearity is mainly due to the motility of outer hair cells.[7] These cells are sensitive to noise[8,9] and ototoxic agents.[10,11]
On the other hand, the number of outer hair cells decreases with age.[12] As a result, DPOAEs should be more suitable than PTA for detecting sub-clinical threshold alterations induced by a noise and ototoxic agents (solvents). Combined with contralateral acoustic stimulation, DPOAEs can be measured prior to, during and after triggering the stapedial reflex (middle-ear reflex: MER) providing useful information on the central nervous elements driving the middle-ear function.[13,14] In order to evaluate the middle-ear and the outer-hair cell functions, the authors have designed a new device, and a specific procedure that they named EchoScan to optimize the measurement of the DPOAEs prior to, and during a simultaneous contralateral stimulation.
One of the aims of this study, conducted in hospital (CPP 10.0702; Affsaps UEC/AnnR/DA/2010-212), was to test whether EchoScan was capable of detecting a gender effect[15] Access this article online
Quick Response Code: Website:
www.noiseandhealth.org
DOI:
10.4103/1463-1741.102964
PubMed ID:
***
EchoScan: A new system to objectively assess peripheral
hearing disorders
Thomas Venet, Pierre Campo, Cécile Rumeau, Hélène Eluecque
1,
Cécile Parietti- Winkler
1,2National Institute of Research and safety (INRS) CS 60027, F-54519 vandoeuvre Cedex, 1ENT Department CHU- Central Hospital, Nancy, 2INSERM U954, Lorraine University School of Medecine, F-Nancy, France
Abstract
Pure-tone air-conduction audiometry (PTA) is the reference clinical test used in Europe and the United States to measure the extent of hearing loss. It is a subjective, behavioral test, which measures thresholds of hearing sensations and perceptions based on patient responses to frequency-specific pure-tone stimuli. PTA can detect hearing problems due to cochlear or retro-cochlear impairment, without identifying the source of the problem. In contrast, cubic distortion product otoacoustic emissions (DPOAEs) detect inner-ear dysfunctions, particularly those involving the outer hair cells sensitive to noise and ototoxicants. Recently, ototoxicants were shown to have an action on the central nuclei driving the middle-ear acoustic reflex. Therefore, a new device, called EchoScan, was conceived to collect and measure performance both in the middle- and inner-ear. Its originality: the use of a battery of DPOAE measurements associated with contra-lateral acoustic stimulation. Changes in DPOAE amplitude due to ageing and gender were incidentally detected and EchoScan was more sensitive than impedancemetry to detect the stapedial reflex. EchoScan can be used both in clinical investigations and in occupational medicine, especially for the auditory follow-up of people exposed to noise or ototoxic agents. EchoScan could be promising to assess early detection in programs to prevent hearing loss.
Venet, et al.: EchoScan allows DPOAE and MER measurements
Noise & Health, September-October 2012, Volume 14 254
and an age-related decline[16] by measuring either the DPOAE magnitudes or the MER thresholds. Of particular interest were the effects of certain chemicals on the stapedial reflex and as such the investigators focused on how effectively EchoScan elicited MER thresholds.[14,17]
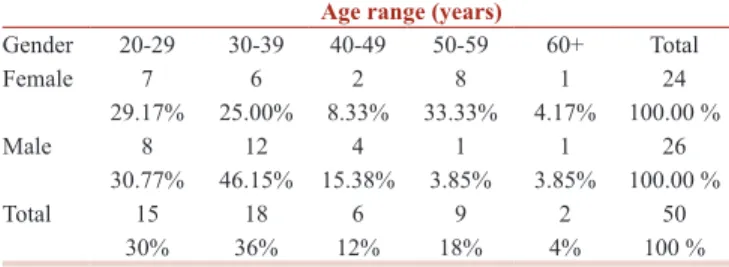
Study participants
A population of fifty volunteers aged from 20 to 65 years old (24 women and 26 men) were included in this study [Table 1]. Hearing was tested by PTA (Interacoustics AC 40) for frequencies ranging from 500 to 8000 Hz. The subjects who suffered from 30 dB hearing loss at frequencies less than 4000 Hz were excluded from our population. Normal (type A) acoustic compliance was also checked by immittance (GSI Tympstar, 2000-97XX). Middle-ear immittance was performed in each ear using a 226 Hz probe tone with a static pressure change in the outer canal of 200 daPa/sec, varying from 200 to -200 daPa. Subjects had to have a stapedial reflex to be included in our population.
In summary, the selection of the subjects was essentially based on the PTA results, and the detection of the stapedial reflex at one or more frequencies by impedance audiometry. Anamnesis was also performed to exclude subjects who had suffered the influence of noise and ototoxic agents.
Methods
All measurements were performed in a sound-attenuated booth located in the Otolaryngology department (ENT) of University hospital Nancy, France. Three sets of measurements were taken on two consecutive days: D (1 set) and D+1 (two sets taken at a 1-hour interval). A possible effect of time of day on our results[18] was minimized by performing tests on days D and D+1 with identical schedules.
Input/Output DPOAE procedure
The DPOAE probe (Etymotic Reasearch ER10C) contained 2 transducers, with a bandwidth ranging from 200 Hz to 12 kHz at ± 10 dB. These generated f1 and f2, chosen to generate distortion-product otoacoustic emissions (DPOAEs) defined as 2f1-f2. The f2/f1 ratio was 1.2. The levels of the primaries were L2 = L1- 6 dB HL.[19-21] Two synthesizers (Pulse, B and K 3610) were connected to the probe to deliver f1 and f2 in the ipsilateral (left) ear; the highest intensity was limited
to 70 dB HL so as not to activate the middle-ear acoustic reflex. Four couples of frequencies were tested in the current investigation: (1000/1200), (2000/2400), (3000/3600), (4000/4800) Hz.
DPOAEs were recorded with a microphone which was also placed in the probe. The three transducers were enclosed in the probe, whose tip was inserted into the subject’s external ear canal. DPOAE amplitude was determined from a linear averaged (N = 4) spectrum of 250 ms with a frequency resolution of 8 Hz. For each frequency couple, DPOAE amplitudes were acquired as a function of primary intensities, which increased from 49 to 70 dB HL in 3 dB steps.
An Ear Simulator Type RA0045 GRAS (IEC 711) was used to perform a calibration procedure according to standards ISO 389-2 and IEC 60318-4. This ensured that f1 and f2 were always emitted at the target intensities. Notice that the intensities used to generate DPOAEs will be expressed in dB HL to be consistent with the usual convention. In contrast, the amplitude of the DPOAEs measured with EchoScan will be expressed in dB SPL.
The equivalence between the DPOAE stimuli from dB HL to dB SPL is illustrated by two examples. Using the ER10C probe driven by a 1 V sinus tone, the pressure level measured by the ear simulator type RA0045 GRAS (CEI 711 and CEI 60318-4:2010) was 67.5 dB SPL at 2 kHz and 81 dB SPL at 4 kHz. The equivalent hearing level value was 56.0 dB HL at 2 kHz and 66.0 dB HL at 4 kHz.
DPOAE pattern across frequency: DPgram
Participants were screened for DPOAEs across the f2 frequency ranging from 1008 to 8064 Hz, with a constant stimulation level: L1 = 62 dB HL and L2 = 56 dB HL. Notice that the measures of f1 and f2 were expressed in dB HL to make the comparison with PTA easier. In contrast, the DPOAE amplitude was measured in dB SPL, which is the usual convention. DPOAE pattern across frequency, or DPgrams were performed up to 8 kHz to make comparisons with PTA data possible.
Input/Output middle-ear reflex procedure
The earphone used to trigger the stapedial reflex was an Etymotic Research ER4 B, with a bandwidth ranging from 20 Hz to 16 kHz at ± 4 dB. It was fitted into the contralateral (right) ear, whereas the DPOAE probe was placed in the ipsilateal (left) ear. The contralateral emitter was calibrated as described for the DPOAE probe emitters. The noise was an 800 Hz band noise centered on a frequency, varying from 500 to 4000 Hz. Each burst lasted up to 2 seconds. The contralateral noise was synthesized by a B and K Pulse 3610, and emitted at an intensity between 65 and 95 dB HL. The upper intensity limit was fixed at 95 dB HL to preserve participants’ hearing. The procedure was performed to detect a decrease in DPOAE amplitude induced by activation of the stapedial reflex. Table 1: Population distribution as a function of gender and
age
Age range (years)
Gender 20-29 30-39 40-49 50-59 60+ Total Female 7 6 2 8 1 24 29.17% 25.00% 8.33% 33.33% 4.17% 100.00 % Male 8 12 4 1 1 26 30.77% 46.15% 15.38% 3.85% 3.85% 100.00 % Total 15 18 6 9 2 50 30% 36% 12% 18% 4% 100 %
Data recording schedule
Table 2 describes the schedule of the investigations carried out in the study.
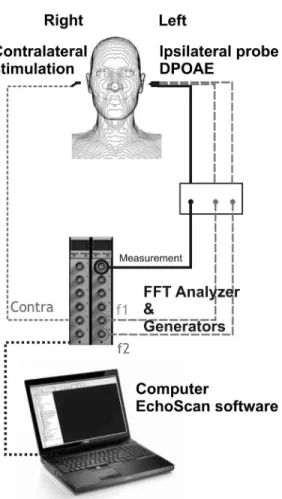
EchoScan
A patent application has been lodged for EchoScan Figure 1 and the process used to measure the trigger threshold of the MER as a function of frequencies chosen based on a previous DPOAE I/O analysis.
Statistical analysis
Statistical analyses were performed using mixed linear random effect models to evaluate the effects of age and gender. The significance of the MER threshold was determined by Student’s t-test. Statistical significance was defined at an alpha level of 0.05 (significant at 95%). The linear association between the middle-ear reflex threshold elicited by both impedance audiometry and EchoScan was measured by calculating correlation (Pearson’s product moment correlation coefficient). Generally, the level of significance is indicated in tables by: * at 5%, and *** at 1/1000. All analyses were designed and performed by PW statistical consulting www.pw-statistical-consulting.eu. Results
DPOAE input/output function
The DPOAE growth curves presented in Figure 2 are based on data obtained with subject # 7. They are representative of the majority of results. As illustrated in Figure 2a, the
Figure 1: Details of the EchoScan. f1 and f2: primary frequencies. f2/f1 = 1.2. FFT: Fast Fourier Transform
Figure 2: DPOAE amplitude vs. f1 intensity. Data for subject #7 are reported. (a) The grey area corresponds to the linear portion of the DPOAE growth curve, which was subsequently used to evaluate the trigger threshold of the middleear reflex. (b) (1) A reduction in f1 intensity leads to a reduction in DPOAE amplitude (2) The frequency panels in (a,b) correspond to F2
b a Table 2: Test schedule summarizing the main steps and hearing tests performed in this study
Day D Day D + 1
(2 sets of measurements) Hearing tests EchoScan EchoScan
Pure-tone audiometry from 500 to 8000 Hz I/O DPAOE f2: 1200, 2400, 3600, 4800 DPgram from f2: 1008 to 8064 Hz at 56 dB HL I/O DPAOE f2: 1200, 2400, 3600, 4800 DPgram from f2: 1008 to 8064 Hz at 56 dB HL Acoustic compliance test
Impedancemetry to measure stapedial reflex from 500 to 4000 Hz Trigger thresholds I/O MER from 500 to 4000 Hz Trigger thresholds I/O MER from 500 to 4000 Hz
Venet, et al.: EchoScan allows DPOAE and MER measurements
Noise & Health, September-October 2012, Volume 14 256
intensity-magnitude DPOAE relationship was linear up to 65 dB HL at 3600 Hz and 4800 Hz. Above 65 dB HL the DPOAE amplitude saturated. It is important to determine the level of saturation so as not to underestimate the middle-ear reflex threshold. Indeed, when DPOAE amplitudes are saturated (e.g. over 65 dB HL at 4800 Hz) the MER trigger could have no effect on the DPOAE amplitude, and therefore remain undetectable. As a result, the choice of the primary intensities was determinant at this point in the experiment so as to avoid saturation of the growth curves Figure 2b.
DPOAE input/output vs. age and gender
Ageing and gender effects were observed at 4800 Hz [Table 3]. The decrease in amplitude, 0.14 dB per year noted at 4800 Hz was determined to be significant by the mixed random effects model. On the other hand, differences between men and women were only observed at the highest frequencies: A 1.8- dB difference was noted at 3600 Hz, and a significant 3.7 dB difference at 4800 Hz. Moreover, our findings showed that DPOAEs were present and repeatable for each volunteer across the time-period studied (Days D and D+1), for all the frequencies considered. The between-subjects variations were less than 5 dB, which is comparable to the variability generally reported with PTA. The “Intercept” term listed in Table 3 corresponds to the mean value predicted by the mixed random effects model for a 20 year-old man.
DPOAE patterns across frequencies: DPgram
As shown in Table 3, significant ageing and gender effects were observed at 4800 Hz, but higher frequencies, namely 6528 and 8064 Hz also showed these effects [Table 4]. DPgram gave clearer ageing effects than DPOAE I/O measurements, because it screened frequencies up to 8 kHz. A significant decrease in amplitude, of approximately 0.19 dB per year, was observed from 4800 Hz to 8064 Hz. Similarly, the differences between men and women were mainly observable at the highest frequencies. In general, the gender effect accounted for a 4 dB difference. Once again, our findings showed that DPOAEs were present, and reproducible in all volunteers for the time-period studied (Days D and D+1), for all frequencies tested. The
intercept listed in Table 4 corresponds to values predicted by the mixed random effects model for a 20 year-old man.
Comparing DPgram with subjective thresholds across frequencies
Subjective auditory thresholds were obtained using a typical PTA approach, whereas EchoScan was used to perform objective auditory measurements. The variations in DPgram amplitudes were quite similar [4-5 dB] to those measured with PTA [Table 5]. The different patterns observed for PTA and DPgram may be due to calibration differences. Two different standards were used for calibrate our equipments: standard ISO 389-2 and IEC 60318-4 for the EchoScan probe, and standard IEC 60645 for the audiometer.
In addition, we used dB HL to express PTA results, according to the consensus, whereas DPgram results were expressed in dB SPL. Note that the PTA measures were collected at the thresholds, whereas the DPgram was obtained with L1 = 62 dB HL (§3.1). These two measurements are not obtained in the same range of intensities. Moreover, PTA is a auditory sensory threshold, which is the result of the entire auditory system, from the auditory receptor to the cortical area. In contrast, DP gram mainly reflects the outer hair cell function. All these reasons can explain the difference of pattern observed between the PTA and DPgram curves. Nevertheless, line 2000 Hz and column 8064 Hz in Table 6 show relevant correlations (R>0.15) between the DPgram and PTA values.
MER thresholds elicited with echoscan, as a function of age
Although we did not find any gender difference for MER thresholds, an ageing effect at 4000 Hz was detected. The values obtained with a random-intercept proportional odds model are reported in Table 7. In spite of between-subject variations, the age effect was significant at the highest frequency tested.
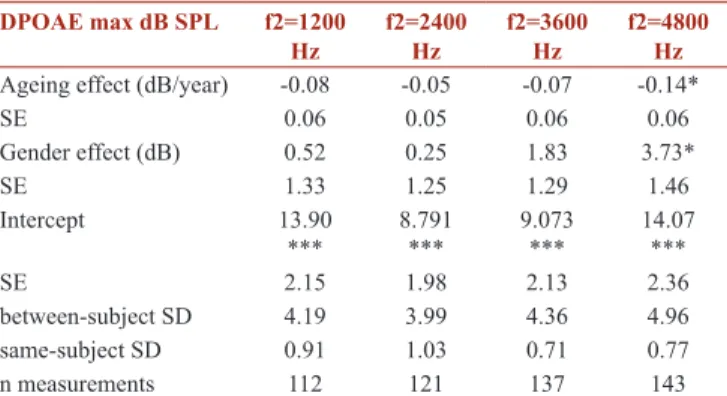
Table 3: Statistical analysis of DPOAE amplitudes as a function of age and gender
DPOAE max dB SPL f2=1200
Hz f2=2400 Hz f2=3600 Hz f2=4800 Hz
Ageing effect (dB/year) -0.08 -0.05 -0.07 -0.14*
SE 0.06 0.05 0.06 0.06 Gender effect (dB) 0.52 0.25 1.83 3.73* SE 1.33 1.25 1.29 1.46 Intercept 13.90 *** 8.791 *** 9.073 *** 14.07 *** SE 2.15 1.98 2.13 2.36 between-subject SD 4.19 3.99 4.36 4.96 same-subject SD 0.91 1.03 0.71 0.77 n measurements 112 121 137 143
* and *** correspond to respectively 5% and 0.1% level of significance, SE: Standard error; SD: Standard deviation; Intercept: mean value predicted by the mixed random effects model for a 20 year-old man
Table 4: Statistical analysis of DPgram amplitudes as a function of age and gender
DPgram L1= 62 dB HL f2 Frequency (Hz)1008 1200 2016 2400 3264 4032 4800 6528 8064 Ageing effect (dB/year) -0.06 -0.02 -0.03 -0.02 -0.10 -0.10 -0.18* -0.20* -0.19* SE 0.05 0.07 0.06 0.06 0.06 0.07 0.07 0.07 0.07 Gender effect dB -0.92 -1.47 -1.64 -1.85 2.04 3.89 4.34* 3.66* 1.98 SE 1.16 1.56 1.45 1.37 1.38 1.78 1.76 1.65 1.55 Intercept 10.945 *** 10.81 *** 6.819 *** 5.37 *** 3.67 *** 5.33 *** 9.24 *** 10.30 *** 7.87 *** SE 0.99 1.42 1.32 1.30 1.26 1.60 1.61 1.54 1.43 btw subject SD 3.24 4.73 4.82 4.48 4.67 5.93 5.98 5.48 4.94 same-subject SD 1.28 1.12 1.04 0.99 0.10 0.92 0.74 1.63 2.90 n measures 96 110 123 128 140 138 142 137 128 * and *** correspond to respectively 5% and 0.1% level of significance, SE: Standard error; SD: Standard deviation; Intercept: mean value predicted by the mixed random effects model for a 20 year-old man
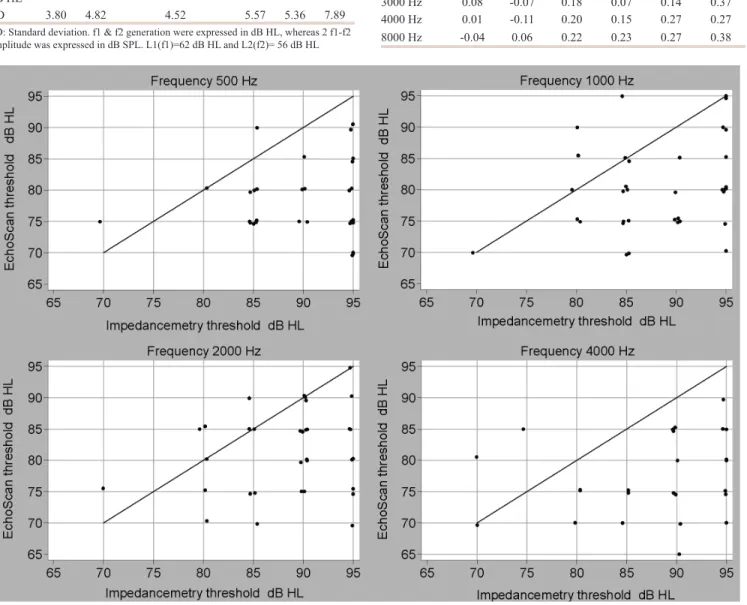
MER thresholds: EchoScan vs. impedance audiometry
MER thresholds at less than or equal to 95 dB HL were much better measured by EchoScan than by impedance audiometry. For instance, with impedance audiometry, 25% of MER thresholds could not be measured, whereas EchoScan only failed to find a threshold for 8% of measurements, regardless of frequency.
The comparison of threshold values measured with EchoScan and by impedance audiometry is illustrated in [Figure 3]. The
X-axis represents the MER thresholds obtained by impedance audiometry, whereas the Y-axis corresponds to the MER thresholds obtained with the EchoScan. Equal sensitivity between the two tests would have resulted in values clustered along the diagonal red line. Obviously, EchoScan measures the stapedial reflex more sensitively.
Discussion
The findings reported in this study show a frequency-by-frequency correspondence between human DPOAES and PTA [Table 6]. However, the advantage of DPOAEs is that they provide an objective measurement to evaluate biomechanical aspects of acoustic information processing
Figure 3: Comparison between stapedial reflex thresholds measured by impedance audiometry and with EchoScan; X axis: Impedance audiometry threshold in dB HL. Y axis: EchoScan threshold in dB HL
Table 5: Pure-tone audiometry (PTA) and DPOAE levels across frequency (DPgram) DPgram Hz 1008 1200 2016 2400 3264 4032 8064 Mean dB SPL 9.34 10.13 5.83 4.29 3.15 5.56 5.95 SD 3.2 4.53 4.72 4.35 4.63 5.96 5.68 PTA Hz 500 1000 2000 3000 4000 8000 Mean dB HL 11.78 11.98 10.72 9.26 10.19 11.2 SD 3.80 4.82 4.52 5.57 5.36 7.89
SD: Standard deviation. f1 & f2 generation were expressed in dB HL, whereas 2 f1-f2 amplitude was expressed in dB SPL. L1(f1)=62 dB HL and L2(f2)= 56 dB HL
Table 6: Coefficient of correlation (R value) between PTA and DPgram values DPgram / PTA 2016 Hz 2400 Hz 3264 Hz 4032 Hz 4800 Hz 8064 Hz 2000 Hz 0.32 0.41 0.49 0.37 0.38 0.42 3000 Hz 0.08 -0.07 0.18 0.07 0.14 0.37 4000 Hz 0.01 -0.11 0.20 0.15 0.27 0.27 8000 Hz -0.04 0.06 0.22 0.23 0.27 0.38
Venet, et al.: EchoScan allows DPOAE and MER measurements
Noise & Health, September-October 2012, Volume 14 258
within the cochlea.[22,23] Two separate portions of the input-output DPOAE growth curve were found with EchoScan for subjects with normal hearing: a linear and a saturated portion above 65 dB. DPOAE levels across frequency (DPgrams) are repeatable for the same subject Table 3, and although a between-subjects variation was measured, the degree of variation is very close to that obtained with PTA measurements [Table 5]. As a result, DPOAEs allow objective screening of cochlear performance over a wide frequency bandwidth. This is why DPOAEs were developed as an audiometric tool to detect cochlear hearing loss in newborns and infants. [24] Surprisingly, DPOAEs are not used to perform clinical investigations in routine, and the technique is even ignored in occupational medicine.
By triggering the MER with a contralateral noise prior to, during and after DPOAE measurements, EchoScan allows study of both the inner-and middle-ear physiologies, provided that primary intensities are chosen within the linear portion of the DPOAE growth curve.[25] By taking these precautions, this equipment could be used as a valuable system to screen for early signs of cochlear and middle-ear impairments. As far as the stapedial acoustic reflex is concerned, Venet et al, showed the importance of eliciting the MER threshold in a hearing-loss prevention program. These authors showed that, in rats, the MER amplitude is sensitive to ototoxic agents, such as aromatic solvents.[17] Thus, where multiple exposures are a problem, both inner-ear and middle-inner-ear physiologies should be measured to appreciate the risk run by people exposed to both noise and ototoxic agents.
Before studying hearing loss, it is essential to keep in mind the decline in auditory performance with advancing age. [12] Because the kinetics of presbycusis has become better known due to the increasing number of older people in our society, many studies documenting age-related hearing loss using either PTA or DPOAEs have been published.[16,26-29] Based on findings reported in the present
study, EchoScan can be used to detect age-related hearing loss. Indeed, a significant decrease in DPOAE amplitude was found in high-frequencies as a function of age [Table 2: -0.134 dB per year, and Table 4]. Based on data reported in [Tables 3, 4, and 7], we can state that EchoScan is suitable to detect and monitor the kinetics of presbycusis. In line with the findings of Lonsbury-Martin et al., this study also shows a gender-by-frequency interaction whereby female volunteers had larger DPOAEs amplitude than males [Table 2: 3.7 dB] at f2 = 4800 Hz. Therefore, as for the ageing effect, the sensitivity of DPOAE measurements with EchoScan is sufficient to detect DPOAE changes due to gender differences, as recently reported by McFadden.[30] The major finding of this study concerns the detection of MER. Due to the sensitivity of the MER to certain ototoxicants, EchoScan was designed to allow easy measurement of the MER by clinicians and occupational physicians. In addition, EchoScan is the first equipment allowing evaluation of both inner-ear and middle-ear functions with a single set of hearing tests. The expected ageing effect on the MER at 4000 Hz was observed. This is likely due to age-related hearing loss in some subjects, which alone can explain a significant increase in MER thresholds.
In conclusion, the major aim of the current work was to test the efficiency of EchoScan and to offer it as alternative to subjective PTA for the detection of early-stage hearing impairments. It will be interesting to see it applied in occupational medicine. The clinical tests performed showed that EchoScan can provide innocuous, sensitive, objective, and reliable measurements of both inner- and middle-ear performances in subjects with normal hearing, taking both the age and gender of subjects into account. DPOAEs were present and reproducible over a contiguous 24-hour period (days D and D+1), for f2 frequencies ranging from 1200 to 4800 Hz, and for primary levels varying between 55 and 75 dB SPL. The results obtained with EchoScan have shown: (1) a clear influence of presbycusis, and (2) an unexpected extensive influence of gender on DPOAE magnitudes. These influences were quite obvious in the high frequencies. The findings in this study demonstrate that EchoScan detects stapedial reflex thresholds more sensitively than impedance audiometry. Consequently, EchoScan is directly relevant to clinical settings allowing the incorporation of high-frequency DPOAEs into clinical protocols. In addition, EchoScan could be still more convincing in occupational medicine, where it could be used to follow up workers’ hearing. It should be a promising tool to evaluate the early stages of presbycusis, the impact of ototraumatic and ototoxic agents on the cochlea, and the impact of occupational chemicals on the middle-ear reflex. It is very suitable for early detection in a hearing conservation program.
Table 7: Thresholds of middle-ear reflex elicited with DPOAE measurements as a function of age
Frequency
Hz Age classesyears Measurements n dB HLMean SD
500 20 13 77.1 7.1 30 16 77.0 4.9 >40 17 79.4 4.9 1000 20 13 81.7 7.5 30 16 78.9 4.9 >40 16 80.3 7.2 2000 20 13 79.8 5.4 30 16 80. 8 4.9 40 15 82.0 5.9 4000* 20 13 76.9 7.2 30 16 79.5 5.6 >40 16 82.5 6.8
Perspectives
The EchoScan is currently being used in the workplace to test a cohort of noise-exposed workers. The aim of this first investigation is to test (1) the efficacy of the device in occupational environments (2) and the sensitivity of DPOAEs associated with a contralateral stimulus after a single working day in a moderate-intensity noise. This first on site investigation will be followed by other tests with workers exposed either to solvent or to noise and solvent. Acknowledgment
The authors would like to thank Chantal Cour, Benoît Rieger, and Aurélie Thomas for their help throughout the clinical tests, and Aurélie Rémy (INRS) for her substantial help in interpreting the analyses.
Address for correspondence:
Dr. Pierre Campo,
National Institute of Research and Safety (INRS), CS60027, 54519 Vandoeuvre Cédex, France.
E-mail: [email protected] References
1. Salvi R, Wang J. Evidence of rapid functional reorganization in inferior colliculus and cochlear nucleus. In: Acoustical signal processing in the central auditory system. Editors: Syka, Plenum Press, N.Y.; 1997. p. 477-88.
2. Syka J. Plastic changes in the central auditory ystem after hearing loss, restoration of function, and during learning. Physiol Rev 2002;82:601- 28. 3. Kaltenbach J, Zhang J. Intense-sound plasticity in the dorsal cochlear
nucleus of rats: Evidence for cholinergic receptor upregulation. Hear Res 2007;226:232-43.
4. Finlayson P, Kaltenbach J. Alterations in the spontaneous discharge patterns of single units in the dorsal cochlear nucleus following intense sound exposure. Hear Res 2009;256:104-17.
5. Ruggero M, Rich N, Recio A, Narayan S. Basilar- membrane responses to tones at the base of the chinchilla cochlea. J Acoust Soc Am 1997;101:2151-63.
6. Lopez-Poveda E, Johannesen P. Otoacoustic emission theories and behavioral estimates of human basilar membrane motion are mutually consistent. J Assoc Res Otolaryngol 2009;10:511-23.
7. Dallos P. The active cochlea. J Neurosci 1992;12:4575-85.
8. Hamernik R, Patterson J, Turrentine G, Ahroon W. The quantitative relation between sensory cell loss and hearing thresholds. Hear Res 1989;38:199-212.
9. Lonsbury-Martin B, Whitehead M, Martin G. Distortion-product otoacoustic emissions in normal and impaired ears: Insight into generation processes. Prog Brain Res 1993;97:77-90.
10. Campo P, Lataye R, Loquet G, Bonnet P. Styrene-induced hearing loss: A membrane insult. Hear Res 2001;154:170-80.
11. EU-OSHA. Combined exposure to noise and ototoxic substances.
Available from: http://www.europa.eu. [Last cited on 2010].
12. Schucknecht H, Gacek M. Cochlear pathology in presbycusis. Ann Otol Rhinol Laryngol 1993;102:1-16.
13. Maguin K, Campo P, Parietti-Winkler C. Toluene can perturb the neuronal voltage-dependant Ca2+ channels involved in the middle-ear reflex. Toxicol Sci 2009;107:473-81.
14. Venet T, Rumeau C, Campo P, Rieger B, Thomas A, Cour C. Neuronal circuits involved in the middle-ear acoustic reflex. Toxicol Sci 2011;119:146-55.
15. Dunckley K, Dreisbach E. Gender effects on high frequency distortion product otoacoustic emissions in humans. Ear Hear 2004;25:554-64. 16. Gates G, Cooper JC Jr, Kannel WB, Miller NJ. Hearing in the elderly:
The Framingham cohort, 1983-1985. Part I. Basic audiometric test results. Ear Hear 1990;11:247-56.
17. Campo P, Maguin K, Lataye R. Effects of aromatic solvents on acoustic reflexes mediated by central auditory pathways. Toxicol Sci 2007;99:582-90.
18. Cacace A, McClelland W, Weiner J, McFarland D. Individual differences and the reliability of 2f1-f2 distortion-Product otoacoustic emissions: Effects of time-of-day stimulus variables, and gender. J Speech Hear Res 1996;39:1138-48.
19. Gaskill S, Brown A. The behavior of the acoustic distortion product 2f1- f2 from the human ear and its relation to auditory sensitivity. J Acoust Soc Am 1990;88:821-39.
20. Whitehead W, McCoy M, Lonsbury-Martin B, Martin G. Dependence of distortion-product otoacoustic emissions on primary levels in normal and impaired ears. Effects of decreasing L2 below L1. J Acoust Soc Am 1995;97:2346-58.
21. Neely S, Johnson T, Kopun J. Distortion-product otoacoustic emission I/O characteristics in normal-hearing and hearing-impaired human ears. J Acoust Soc Am 2009;126:728-38.
22. Lonsbury-Martin B, Harris M, Hawkins M, Stagner B, Martin G. Distortion product emissions in humans. Basic properties in normally hearing subjects. Ann Otol Rhinol Laryngol 1990;147:3-14.
23. Avan P, Bonfils P. Frequency specificity of human distortion product otoacoustic emissions. Audiology 1993;32:12-26.
24. Norton S, Gorga M, Widen J, Folsom R, Sininger Y, Cone-Wesson B, et al. Identification of neonatal hearing impairment: Summary and recommendations. Ear Hear 2000;21:529-35.
25. Nieschalk M, Hustert B, Stoll W. Distortion-product otoacoustic emissions in middle-aged subjects with normal versus potentially presbyacusic high-frequency hearing loss. Audiology 1998;37:83-99. 26. Rosenhall U, Pedersen K, Svanborg A. Presbycusis and noise-induced
hearing loss. Ear Hear 1990;11:257-63.
27. Lonsbury-Martin B, Cutler W, Martin G. Evidence for influence of aging on distortion-product otoacoustic emissions in humans J Acoust Soc Am 1991;89:1749-59.
28. Oeken J, Lenk A, Bootz F. Influence of age and presbyacusis on DPOAE. Acta Otolaryngol 2000;120:396-403.
29. Campo P, Venet T, Rumeau C, Thomas A, Rieger B, Cour C, et al. Impact of noise or styrene exposure on the kinetics of presbycusis. Hear Res 2011;280:122-32.
30. McFadden D. Sexual orientation and the auditory system. Front Neuroendocrinol 2011;32:201-13.
How to cite this article: Venet T, Campo P, Rumeau C, Eluecque H,
Parietti- Winkler C. EchoScan: A new system to objectively assess peripheral hearing disorders. Noise Health 2012;14:253-9.