HAL Id: hal-00317701
https://hal.archives-ouvertes.fr/hal-00317701
Submitted on 3 Jun 2005
HAL is a multi-disciplinary open access
archive for the deposit and dissemination of
sci-entific research documents, whether they are
pub-lished or not. The documents may come from
teaching and research institutions in France or
abroad, or from public or private research centers.
L’archive ouverte pluridisciplinaire HAL, est
destinée au dépôt et à la diffusion de documents
scientifiques de niveau recherche, publiés ou non,
émanant des établissements d’enseignement et de
recherche français ou étrangers, des laboratoires
publics ou privés.
Pulsed flows observed during an interval of prolonged
northward IMF
G. Provan, M. Lester, A. Grocott, S. W. H. Cowley
To cite this version:
G. Provan, M. Lester, A. Grocott, S. W. H. Cowley. Pulsed flows observed during an interval of
prolonged northward IMF. Annales Geophysicae, European Geosciences Union, 2005, 23 (4),
pp.1207-1225. �hal-00317701�
Annales Geophysicae, 23, 1207–1225, 2005 SRef-ID: 1432-0576/ag/2005-23-1207 © European Geosciences Union 2005
Annales
Geophysicae
Pulsed flows observed during an interval of prolonged northward
IMF
G. Provan, M. Lester, A. Grocott, and S. W. H. Cowley
Department of Physics and Astronomy, University of Leicester, University Road, Leicester LE1 7RH, UK
Received: 13 August 2004 – Revised: 10 December 2004 – Accepted: 16 February 2005 – Published: 3 June 2005
Abstract. On the 22 December 2002 the interplanetary mag-netic field (IMF) was directed northwards for more than 12 h. The Northern and Southern Hemisphere SuperDARN radars were used to study global high-latitude convection during this interval, complemented by data from the ACE and DMSP F13 spacecraft. The relative magnitudes of the
IMF Byand Bzcomponents varied during this period. When
the magnitude of the By component was comparable with
or dominated the Bzcomponent, signatures of simultaneous
low-latitude and lobe reconnection were observed. Specif-ically two “standard” merging cells were observed in both hemispheres. In the Northern Hemisphere a high-latitude lobe cell was observed within the dusk merging cell, and there was also evidence of a narrow viscous cell located equatorward of this lobe cell. We observed the ionospheric signatures of flux transfer events (FTEs) in both the Northern and Southern Hemispheres, occurring with a periodicity of
∼15 min. In the Northern Hemisphere the FTEs were
associ-ated with a stepwise equatorward progression of the equator-ward boundary of radar backscatter on the dayside. When the
IMF Bzcomponent was predominantly greater than the IMF
Bycomponent, we observed a four-cell convection pattern in
the Northern Hemisphere, with pulses of reverse reconnec-tion and an associated stepwise poleward retracreconnec-tion of the equatorward boundary of radar backscatter occurring every
∼25 min. These observations are consistent with pulsed lobe
reconnection occurring in both hemispheres, closing open flux and adding closed flux to the dayside magnetopause. So, during this northward IMF interval the location of the sites of reconnection between the IMF and the Earth’s mag-netosphere, and thus the form of reconnection process, var-ied with changing IMF conditions. However, the reconnec-tion remained pulsed, with lobe-only reconnecreconnec-tion having a significantly longer periodicity compared with simultaneous lobe and low-latitude reconnection.
Keywords. Magnetospheric physics (Solar
wind-magnetosphere interactions; Magnetosphere-ionosphere
interactions; Polar cap phenomena) Correspondence to: G. Provan ([email protected])
1 Introduction
Over the years much attention has been paid to the process of magnetic reconnection occurring at the dayside magne-topause during intervals of southward interplanetary mag-netic field (IMF), leading to a greatly enhanced understand-ing of this process and of the pulsed flux transfer events (FTEs) that are observed during such intervals. The first ob-servations of impulsive dayside reconnection were made us-ing space instruments (Haerendel et al., 1978; Russell and Elphic, 1978, 1979). More recently large instrumental ad-vances have resulted in detailed studies of the ionospheric response to dayside reconnection (e.g. Sandholt et al., 1989; Lockwood et al., 1990; Elphic et al., 1990), with the near global coverage of the SuperDARN chain of HF radars mak-ing these instruments ideal for studymak-ing the large-scale iono-spheric response (Pinnock et al., 1995; Provan et al.,1998; McWilliams et al., 2000).
Currently the process of dayside reconnection during in-tervals of Northward IMF is a “hot topic” of discussion. For example, Frey et al. (2003), presented two case studies of magnetic reconnection during northward IMF. Their ob-servations were consistent with reconnection at the Earth’s high-latitude magnetopause being driven directly by the so-lar wind, and remaining continuous and even quasi-steady
over a period of time. On the other hand, Sandholt et
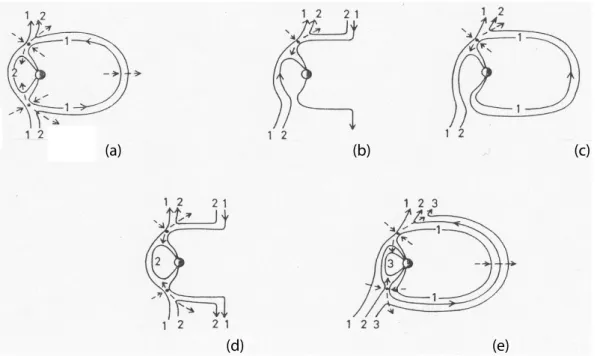
al. (2000) reported bursts of reverse convection and a step-wise poleward motion of radar backscatter during an inter-val containing a rapid northward turning of the IMF. It is now over forty years since Dungey (1963) first postulated that dayside reconnection could occur during intervals of northward IMF at very high-latitude field lines tailward of the cusp. Dungey’s (1963) ideas were later described by Cowley (1981, 1983), who presented a pictorial catalogue of physically possible magnetic topologies for lobe reconnec-tion during Northward IMF. Cowley’s (1981, 1983) picto-rial catalogue is presented here in Fig. 1, and has previously been discussed by Crooker (1992). Dungey’s (1963) model of lobe reconnection is presented in Fig. 1a. Dungey (1963) discussed a totally closed magnetosphere, with one mag-netosheath field line reconnecting with the same closed
1208 G. Provan et al.: Pulsed flows observed during an interval of prolonged northward IMF
(a) (b) (c)
(d) (e)
Fig. 1
Fig. 1. Cowley’s (1981, 1983) pictorial presentation of five different physically possible topologies for lobe reconnection during Northward
IMF.
magnetospheric field line in both the Northern and Southern Hemisphere. The result is the transfer of closed nightside flux to closed dayside flux, with the newly-created magneto-spheric field lines on the dayside first being pulled sunwards, due to the magnetic tension of the newly reconnected field lines, before being swept anti-sunward towards the dawn and dusk flanks with the magnetosheath flow. These two oppos-ing forces would result in two reverse-convection cells beoppos-ing created in each hemisphere, with sunward flow over the polar cap and anti-sunward flow at lower latitude. This sense of ro-tation is opposite to the direction of roro-tation of high-latitude flows observed under southward IMF conditions.
Figure 1b presents Russell’s (1972) suggestion that day-side reconnection during intervals of northward IMF could occur with open field lines in one lobe only, particularly in the presence of an east-west component of the IMF, result-ing in the reconfiguration of open magnetic field lines. This merging would also be accompanied by reverse convection, which is decoupled in the two hemispheres. The convection cells created due to lobe merging are typically referred to as lobe cells. Lobe cells are located wholly on open field lines with flux merely being circulated within the polar cap (Burch et al., 1985; Reiff and Burch, 1985).
In Fig. 1c high-latitude lobe merging occurs in only one hemisphere, as also presented in Fig. 1b. But this time the magnetosphere is closed, not open. Thus the effect of the re-connection is to add open flux to the dayside magnetosphere, and the polar-cap should expand. In Fig. 1d Cowley (1981, 1983) describes magnetic reconnection occurring simultane-ously in both hemispheres (as also suggested in Fig. 1a). However, this time the magnetosphere is open, and the re-connection occurs on open lobe field lines. The net result
is to transfer open lobe flux into closed dayside flux, result-ing in a shrinkresult-ing of the polar cap. The nightside polar-cap boundary moves northward with the reverse-cell flow.
Finally, Fig. 1e presents Cowley’s (1983) representation of sequential merging in the Northern and Southern
Hemi-spheres. Lobe reconnection first occurs in the Northern
Hemisphere, forming an open field line that drapes over the dayside and one that connects to the Southern Hemisphere. Later, the overdraped field line merges with one of the previ-ously opened field lines in the Southern Hemisphere, forming a closed dayside field line and a completely detached field line. Similar sequential merging can also occur in the case of open field lines in the tail, though this is not illustrated in the figure.
First observations of reverse convection were made by Maezewa (1976) who interpreted ground magnetometer sig-natures in terms of lobe convection. Later, the existence of high-latitude “lobe” reconnection has been verified by in-situ spacecraft observations (Gosling et al., 1991; Kessel et al., 1996). Gosling et al. (1991) reported that during an
inter-val when the IMF Bz component was slightly negative and
|By| |Bz|, mixed populations of accelerated magnetosheath
and magnetospheric plasma were observed close to the mag-netopause boundary, while Kessel et al. (1996) observed sun-ward flowing protons during reconnection at the high-latitude
magnetopause (75◦) when the IMF was directed northward.
Low-altitude and ground-based observations illustrate that “four cell” convection is typical under northward IMF con-ditions. The two highest latitude cells are reverse convec-tion cells with sunward flow over the polar cap. At lower latitude two “standard” convection cells are observed, in which the flow rotates in the same direction as ionospheric
G. Provan et al.: Pulsed flows observed during an interval of prolonged northward IMF 1209 cells observed under southward IMF conditions, with
anti-sunward flow at high latitude and anti-sunward flow at lower lat-itude. These two lower-latitude cells are often attributed to viscous processes at the magnetopause boundary at lower lat-itudes (Burke et al., 1979; Potemra et al., 1984; Freeman et al., 1993).
Crooker et al. (1979) stated that for lobe reconnection to occur the northward IMF needs to be near anti-parallel to the geomagnetic field of the tail lobes. The tilt of the Earth’s magnetic dipole and the IMF conditions will at times mean that lobe reconnection will be more likely to occur in one hemisphere than the other. The seasonal tilt of the magnetic dipole, as well as the relative magnitude and orientation of
the IMF Byand Bxcomponents, will determine which
hemi-sphere is favoured. Cowley (1983) stated that if the IMF is
pointed antisunward (IMF Bx<0) the Northern Hemisphere
is favoured over the southern as a site of reconnection, as the IMF is anti-parallel to the geomagnetic field there. It was suggested that the reconnection in the unfavoured hemi-sphere may eventually be activated at a later stage, involv-ing the overdraped magnetic flux resultinvolv-ing from reconnec-tion in the favoured hemisphere (as in Fig. 1e). Crooker and Rich (1993) showed that lobe reconnection was much more likely to occur in the summer hemisphere. Lockwood
and Moen (1999) illustrated that a large IMF Bx
compo-nent can alter the effective dipole tilt of the magnetosphere with respect to the IMF, and hence, alter the favoured hemi-sphere for reconnection. Østgaard et al. (2003) observed two examples of non- conjugate theta auroras, suggesting that
the pointing direction of the IMF Bx component resulted in
lobe reconnection being favoured in one hemisphere over the other.
The relative magnitude of the IMF By component
com-pared to the IMF Bzcomponent will also alter the
reconnec-tion process. For example, Cumnock et al. (1992), Freeman et al. (1993), and Knipp et al. (1993) showed that low-latitude reconnection could still occur during intervals of Northward
IMF if the IMF By component was larger than the IMF Bz
component, so that the magnetic shear at the low-latitude magnetopause was sufficient for reconnection to start there. Knipp et al. (1993) and Ruohoniemi and Greenwald (1996) reported a progression of the convection form from a dis-torted two-cell pattern to a multi-cell pattern with increasing IMF Bzpositive.
High-latitude rapid velocity transients are commonly ob-served in the l-o-s velocity measurements detected by HF radars. Poleward-moving regions of antisunward flow mea-sured by HF radar, suggested to be associated with FTEs, have been studied at high-time resolution by Pinnock et
al. (1995) and Rodger and Pinnock (1997). Provan et
al. (1998) employed data from the CUTLASS Finland radar to perform a detailed study of the dynamics and extent of pulsed ionospheric flows (PIFs). These antisunward-moving transient features were identified as the ionospheric signa-tures of impulsive dayside reconnection i.e. the signature of magnetopause flux transfer events (FTEs) (Russell and El-phic, 1978, 1979). Such impulsive reconnection is believed
to be the primary mechanism for the transfer of flux from the Earth’s magnetosheath to the magnetosphere (e.g. Milan et al., 2000), and occur generally during intervals of low-latitude merging when the IMF is directed southwards (e.g. Rijnbeek et al., 1984). However, a recent statistical study by McWilliams et al. (2000) found that one third of the pulsed ionospheric flows observed by the SuperDARN radars oc-curred under northward IMF conditions. Below we will fur-ther study FTEs observed during low-latitude merging when
the IMF is directed northwards. By “low-latitude
merg-ing” we mean merging occurring equatorward of the open-closed field-line boundary between open-closed magnetospheric field lines and the unconnected field lines of the IMF. The actual latitude at which this merging occurs, whether “low” or otherwise, is not examined in this paper. The term “low-latitude” is thus only used to differentiate this merging pro-cess from the high-latitude lobe merging observed tailward of the cusp, between the IMF and open field lines of the tail lobe.
In this paper we present a case study of one day of pro-longed northward IMF. During this interval, on 22
Decem-ber 2002, the IMF Bzcomponent was pointing continuously
northward for more than 12 h, reaching values of up to 18 nT. We study the global high-latitude ionospheric flow patterns using the Northern and Southern Hemisphere SuperDARN radars. We also present data from the ACE spacecraft and the F13 DMSP spacecraft. We study the effect of the IMF
By and Bz components on dayside reconnection processes
that occur during this northward IMF interval, giving partic-ular attention to the pulsed nature of this reconnection.
2 Instrumentation
The ionospheric convection velocities presented in this study are provided by the Northern and Southern Hemisphere Su-perDARN radars, part of the international SuSu-perDARN chain of HF radars (Greenwald et al., 1995). At present there are 9 SuperDARN radars imaging the high-latitude convection in the Northern Hemisphere, and 7 radars in the Southern Hemisphere. Each radar of the system is frequency agile (8–20 MHz), and routinely measures the line-of-sight (l-o-s) Doppler velocity, the spectral width, and the backscattered power from ionospheric plasma irregularities. The radars
each form 16 beams of azimuthal separation 3.24◦. Each
beam is gated into 75 range bins. In the standard operation (normal resolution) mode used here, each gate has a length of 45 km and the dwell time for each beam is 7 s, giving a
full 16 beam scan, covering 52◦ in azimuth and over 3000
km in range (an area of over 4×06km2), every 2 min. Dur-ing this interval data were available from 6 of the 9 Northern Hemisphere radars i.e. Hankasalmi (f), Iceland East (e), Ice-land West (w), Saskatoon (t), Kapuskasing (k), and Prince George (b), and from 5 of the 7 Southern Hemisphere radars i.e. Syowa (j), Syowa East (n), Sanae (d), Halley (h), and Tiger (r). The letters in brackets after the radar names rep-resent the station identification letter. Low altitude particle
1210 G. Provan et al.: Pulsed flows observed during an interval of prolonged northward IMF
A
B
F
ig 2
Fig. 2. The IMF conditions observed by the ACE spacecraft from 10:00 to 17:00 UT on 22 December 2002. A 55 min delay time has been
added to the plots. The IMF Bxcomponent is coloured blue, the IMF Bycomponent is coloured red and the IMF Bzcomponent black. Time
intervals A and B are indicated on the plot by the vertical dashed lines.
precipitation data are provided by the DMSP F13 spacecraft. Hardy et al. (1984) have provided detailed information con-cerning the detectors. Upstream IMF data is provided by the ACE satellite (Smith et al., 1999).
3 Data presentation
3.1 IMF observations
The top panel of Fig. 2 presents the IMF conditions from the ACE spacecraft for 22 December 2002 for the time interval 10:00 to 17:00 UT. At 10:00 UT ACE is positioned upstream of the Earth at GSM position (X, Y, Z)=(241.7, 4.4, 13) RE.
A 55 min lag time has been added onto the time scale of the plot, representing the delay between the IMF being observed by the satellite and when it impinges on the magnetopause, calculated using the algorithm of Lester et al. (1993). IMF
Bxcomponent is coloured blue, the IMF Bycomponent red
and the IMF Bzcomponent black. The middle panel of
Fig-ure 2 presents the absolute magnitude of the IMF Byand Bz
components, again coloured red and black respectively. The bottom panel of Fig. 2 shows the IMF clock angle, calculated as
θ = t an−1(By/Bz). (1)
As stated previously, one of the main aims of this paper is to study the effect of variations in the IMF conditions on the
dayside reconnection process. In order to achieve this we have chosen to study two intervals during this day in detail. The two time intervals are marked with black dashed vertical lines on Fig. 2, and labelled A and B. During both intervals
the IMF Bzcomponent remains wholly positive (northward),
and the IMF Bx component negative. During interval A,
which lasts from 11:00 to 13:35 UT, the IMF Bycomponent
is also positive and generally comparable with or larger than
the IMF Bz component. The IMF clock angle is thus
pre-dominantly ∼45◦or larger. During interval B, from 13:35 to
16:10 UT, the IMF Bycomponent is generally negative and
smaller than the IMF Bzcomponent. The first ∼55 min of
in-terval B, however, from 13:35 to 14:30 UT, are characterised
by variable magnetic field conditions. The IMF By
compo-nent changes from positive to negative values at 13:50 UT.
The IMF Bzcomponent dominates the Bycomponent except
for a few minutes around 14:20 UT, when a strongly nega-tive Bycomponent results in a clock angle of ∼−60◦. After
14:30 UT the IMF conditions remain fairly stable, with the
IMF Bz component significantly larger than the By
compo-nent. During this time the clock angle is consistently small, fluctuating between −20◦and 15◦.
3.2 SuperDARN observations
Figure 3 presents l-o-s velocities from the four Northern Hemisphere radars that observed the most scatter on this
G. Provan et al.: Pulsed flows observed during an interval of prolonged northward IMF 1211 1000 1100 1200 1300 1400 1500 1600 1700 UT 70 72 74 76 78 80 82 84 Magnetic Latitude 1000 1100 1200 1300 1400 1500 1600 1700 UT 70 72 74 76 78 80 82 84 Magnetic Latitude Beam 2 HANKASALMI 1000 (356) to 1700 (356)
-800
-600
-400
-200
0
200
400
600
800
Velocity (m
s
-1)
Ground
Scatter
1000 1100 1200 1300 1400 1500 1600 1700 UT 73 74 75 76 77 78 79 80 Magnetic Latitude 1000 1100 1200 1300 1400 1500 1600 1700 UT 73 74 75 76 77 78 79 80 Magnetic LatitudeBeam 2 ICELAND EAST 1000 (356) to 1700 (356)
1000 1100 1200 1300 1400 1500 1600 1700 UT 74 76 78 80 82 Magnetic Latitude 1000 1100 1200 1300 1400 1500 1600 1700 UT 74 76 78 80 82 Magnetic Latitude
Beam 15 ICELAND WEST 1000 (356) to 1700 (356)
1000 1100 1200 1300 1400 1500 1600 1700 UT 76 77 78 79 80 81 82 83 Magnetic Latitude 1000 1100 1200 1300 1400 1500 1600 1700 UT 76 77 78 79 80 81 82 83 Magnetic Latitude Beam 15 KAPUSKASING 1000 (356) to 1700 (356)
NORTHERN HEMISPHERE L-O-S VELOCITY, 20021222, 1O TO 17 UT
A
B
Fi
g
. 3
Fig. 3. The l-o-s velocities from the Hankasalmi (beam 2), Iceland East (beam 2), Iceland West (beam 15) and Kapuskasing (beam 15)
radars, from 10:00 to 17:00 UT on 22 December 2002. The plots presents l-o-s velocity as a function of time, the velocity is colour coded where positive values (green and blue) show flows toward the radar and negative values (yellow and red) show flows away from the radar. Time intervals A and B are indicated on the plot by the vertical dashed lines.
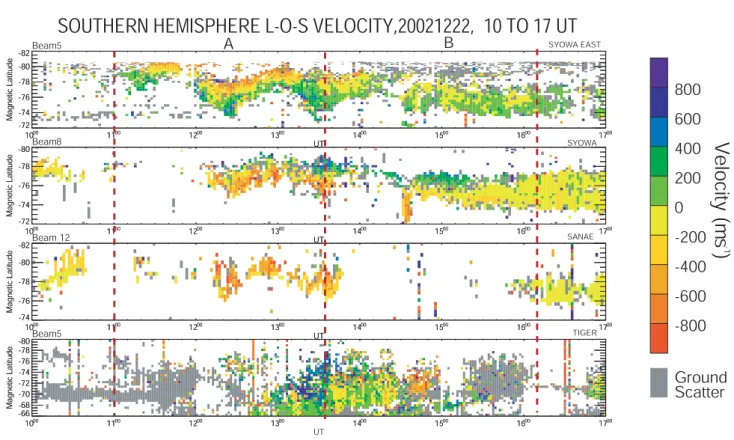
day, Hankasalmi (beam 2), Iceland East (beam 2), Iceland West (beam 15) and Kapuskasing (beam 15), from 10:00 to 17:00 UT. The plots shows colour-coded l-o-s velocity as a function of time, where positive values (green and blue) show flows toward the radar and negative values (yellow and red) show flows away from the radar. The two time inter-vals A (11:00 to 13:35 UT) and B (13:35 to 16:10 UT) are marked on the plot with red dashed vertical lines. Figure 4 presents the l-o-s velocities from four of the Southern Hemi-sphere radars for the same time period, Syowa East (beam 5), Syowa (beam 8), Sanae (beam 12), and Tiger (beam 5). Again the two time intervals A and B are marked with red dashed vertical lines on the plot. Figure 5 presents the f-o-v of the selected Northern (Fig. 5a) and Southern (Fig. 5b) Hemisphere radars at 13:00 UT, during interval A. The plots are in MLAT/MLT co-ordinates, with 12:00 MLT being lo-cated at the top of the page. The radar beams from which data were presented in Figs. 3 and 4 are marked on the plots with red lines. The plots show that at this time all the four selected Northern Hemisphere radars are located on the dayside, with the selected radar beams at Hankasalmi (f), Kapuskasing (k) and Iceland West (w) all looking toward the cusp region. In the Southern Hemisphere three of the selected radars are on the dayside, with the selected beams of Sanae (d) and Syowa
(j) both observing the cusp region. The Tiger (r) radar is lo-cated close to local midnight. We will now present a detailed analysis of the ionospheric flows observed during intervals A and B.
3.3 Interval A
Figure 3 presents the l-o-s velocity from beam 2 of the Han-kasalmi radar and beam 15 of the Iceland West radar. Dur-ing interval A these two radar beams are predominantly ob-serving plasma flow near noon (Fig. 5). They observe fast plasma flow moving away from the radar. These flows are observed at high latitudes, between 72◦and 82◦by the
Han-kasalmi radar and between 75◦and 81◦by the Iceland West
radar. These flows appear to have a pulsed nature. The Ice-land East radar is located in the post-noon region. Figure 3 also presents the l-o-s velocity from beam 2 of this radar, this beam is looking in a zonal direction toward dusk. The Iceland East radar is observing strong plasma flows moving towards the radar which are also variable with time. The Kapuskasing radar is located in the morning sector, and is observing little backscatter in this interval.
In the Southern Hemisphere the Syowa East, Syowa and Sanae radars are located on the dayside (Fig. 5). The l-o-s
1212 G. Provan et al.: Pulsed flows observed during an interval of prolonged northward IMF 1000 1100 1200 1300 1400 1500 1600 1700 UT -72 -74 -76 -78 -80 -82 Magnetic Latitude 1000 1100 1200 1300 1400 1500 1600 1700 UT -72 -74 -76 -78 -80 -82 Magnetic Latitude
Beam 5 SYOWA EAST
SOUTHERN HEMISPHERE L-O-S VELOCITY,20021222, 10 TO 17 UT
1000 1100 1200 1300 1400 1500 1600 1700 UT -72 -74 -76 -78 -80 Magnetic Latitude 1000 1100 1200 1300 1400 1500 1600 1700 UT -72 -74 -76 -78 -80 Magnetic Latitude Beam 8 SYOWA 1000 1100 1200 1300 1400 1500 1600 1700 UT -74 -76 -78 -80 -82 Magnetic Latitude 1000 1100 1200 1300 1400 1500 1600 1700 UT -74 -76 -78 -80 -82 Magnetic Latitude Beam 12 SANAE 1000 1100 1200 1300 1400 1500 1600 1700 UT -66 -68 -70 -72 -74 -76 -78 -80 Magnetic Latitude 1000 1100 1200 1300 1400 1500 1600 1700 -66 -68 -70 -72 -74 -76 -78 -80 Magnetic Latitude Beam 5 TIGER A B -800 -600 -400 -200 0 200 400 600 800
Velocity (m
s
-1)
Ground Scatter F ig 4Fig. 4. L-o-s velocities are shown from four of the Southern Hemisphere radars from 10:00 to 17:00 UT; Syowa East (beam 5), Syowa (beam
8), Sanae (beam 12) and Tiger (beam 5). Time intervals A and B are indicated by the red vertical dashed lines.
velocities presented in Fig, 4 demonstrate that the radars all observe strong flows moving away from the radar. There is indication that this plasma flow is pulsed. The Tiger radar is located on the nightside during this interval. The radar observes little backscatter for the majority of interval A, al-though the radar starts to observe strong flows towards the radar at the end of the interval.
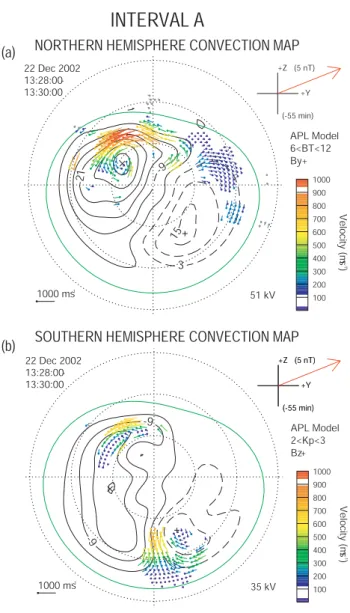
The l-o-s velocities from all the SuperDARN radars were combined to produce global convection maps of plasma con-vection for both the Northern and the Southern hemispheres for intervals A and B, using the map-potential technique (Ruohoniemi and Baker, 1998). Figure 6a presents map-potential flow vectors and fitted equimap-potential streamlines in the Northern Hemisphere for the interval 13:28 to 13:30 UT, giving a snap-shot of the Northern Hemisphere convection pattern during interval A. The vectors are presented as a function of magnetic local time and magnetic latitude, with 12 MLT located at the top of the plot, and dusk to the left. The velocity of the fitted vectors is coded both in colour (blue indicating the slowest velocities, red the fastest) and in the length of the vectors. The flow pattern is a standard two-cell convection pattern with anti-sunward flow over the polar cap and sunward return flow at lower latitude. The dusk flow cell dominates the dawn flow cell, with significant flow of dusk sector plasma across the noon meridian. This type of convec-tion pattern is similar to southward IMF intervals, when mag-netosheath field lines reconnect with closed magnetopsheric field lines at the dayside magnetopause (Dungey, 1963). We
believe that the large IMF Bycomponent during interval A is
creating a magnetic shear at the dayside magnetopause suf-ficient for “low-latitude” reconnection to occur, although a lobe cell may also be present as discussed further below. We note that previous studies have indicated that “low-latitude” reconnection and open flux production may not switch off entirely until the clock angle falls below ∼30◦(Sandholt et
al., 1998; Grocott et al., 2003)
Figure 6b presents the map-potential flow vectors in the
Southern Hemisphere for the same time interval. Again
12 MLT is at the top of the page, and dusk is to the left. The flow pattern is very similar to the Northern Hemisphere flow pattern for this time interval, a standard two-cell convection pattern with anti-sunward flow at high-latitude and sunward flow at lower latitude. It appears that in the Southern Hemi-sphere the post-noon convection cell is also dominating the pre-noon cell. However, we do not feel confident to discuss dawn-dusk distortions of the Southern Hemisphere flow pat-tern, since a lack of data points, especially in the dawn and pre-noon regions, precludes us from making such compar-isons. This lack of data points could also result in the map-potential flow contours being more dependent on the statis-tical model to which the flow vectors are fitted, rather than to actual geophysical observations. It is, nevertheless, strik-ing that a well-developed anti-sunward flow is present in the midnight sector, indicative of on-going Dungey-cycle con-vection.
G. Provan et al.: Pulsed flows observed during an interval of prolonged northward IMF 1213 f e w k 18 06 12 24 d j n r 12 24 06 18 (a) (b)
F-O-V OF SELECTED N-HEMISPHERE RADARS AT 13:OO UT.
F-O-V OF SELECTED S-HEMISPHERE RADARS AT 13:OO UT. f - Hankasalmi e - Iceland East w - Iceland West k - Kapuskasing n - Syowa East j - Syowa d - Sanae r - Tiger Fig 5 f e w k 18 06 12 24 d j n r 12 24 06 18 (a) (b)
F-O-V OF SELECTED N-HEMISPHERE RADARS AT 13:OO UT.
F-O-V OF SELECTED S-HEMISPHERE RADARS AT 13:OO UT. f - Hankasalmi e - Iceland East w - Iceland West k - Kapuskasing n - Syowa East j - Syowa d - Sanae r - Tiger Fig 5
Fig. 5. The f-o-vs of the selected Northern (Fig. 5a) and Southern
(Fig. 5b) SuperDARN radars are shown at 13:00 UT. The plots are in a MLAT/MLT co-ordinate system with 12:00 MLT being located at the top of the plots.
Low altitude particle precipitation data for this interval is provided by the DMSP F13 spacecraft. Figure 7 presents the spectrogram from the F13 spacecraft for the time inter-val 13:25 to 13:41 UT, with both ion and electron data be-ing shown. This spacecraft pass occurred durbe-ing interval A and is contemporaneous with the SuperDARN data presented in Fig. 6. The spacecraft pass was in the Northern Hemi-sphere, and flew through the fields of view of the Hankasalmi and Iceland East radars. Overplotted dashed lines mark the boundaries between different plasma regions. The spacecraft is first located on closed field lines in the dusk sector, demon-strated by the high energies of the precipitating ions and elec-trons. At 13:27:33 UT the spacecraft crosses into a region we have labelled as the “low-latitude boundary layer” (llbl), where the energy of the precipitating electrons decreases, and the spacecraft observes clear evidence of electron accelera-tion. At 13:28:38 UT the energy of the precipitating ions also significantly decreases, such that we judge the spacecraft to be now located on open field lines. The energy of the pre-cipitating particles in this region is similar to that observed by Eriksson et al. (2002, 2003) on sunward flow within a
NORTHERN HEMISPHERE CONVECTION MAP
INTERVAL A
-9 -9 3 100 200 300 400 500 600 700 800 900 1000 Velocity (m s -1 ) 13:28:00 -13:30:00 22 Dec 2002 35 kV APL Model 2<Kp<3 Bz+ 1000 ms-1 +Z (5 nT) +Y (-55 min) +Z (5 nT) +Y (-55 min)SOUTHERN HEMISPHERE CONVECTION MAP
-21 -9 3 15 100 200 300 400 500 600 700 800 900 1000 Velocity (m s -1 ) 13:28:00 -13:30:00 22 Dec 2002 51 kV APL Model 6<BT<12 By+ 1000 ms-1 +Z (5 nT) +Y (-55 min) (a) (b) Fig 6
Fig. 6. (a)Shows map-potential flow vectors and equipotential
streamlines observed by the Northern Hemisphere radars during the interval 13:28 to 13:30 UT. The vectors are presented as a func-tion of magnetic local time and magnetic latitude, with noon at the top and dusk to the left. The velocity of the fitted vectors is coded both in colour (blue indicating the slowest velocities, red the fastest) and in the length of the vectors. The red arrow in the top left-hand corner shows the IMF clock angle at 13:28 UT. (b) Shows map-potential flow vectors and equimap-potential flow streamlines observed by the Southern Hemisphere radars in the same interval, in the same format. Noon is again at the top of the plot, and dusk to the left.
lobe cell, the precipitation being associated with a transpo-lar auroral arc. Lyons et al. (1996) also observed precipi-tating electrons with similar energies in a region of negative electric field divergence in the centre of a circular convection cell (i.e. a region of clockwise flow as viewed from above the Northern Hemisphere as in the present case), which the authors identified as being associated with a polar-cap arc.
The spacecraft remains within the polar-cap arc region until 13:31:25 UT, although it does observe two narrow void regions during this time. Between 13:31:25 UT and
1214 G. Provan et al.: Pulsed flows observed during an interval of prolonged northward IMF 9 13 8 12 LOG JE ELECTRONS IONS 2 4 2 4 LOG E AVE 2 3 4 ELEC 2 3 4 2 3 4 IONS 2 3 4 UT 13:25:00 13:26:35 13:28:11 13:29:47 13:31:23 13:32:59 13:34:35 13:36:11 13:37:47 13:39:23 13:40:59 MLAT 66.6 71.3 75.9 80.4 84.1 85.1 82.1 77.7 72.9 67.9 62.7 GLAT 69.7 74.5 78.7 81.0 80.2 76.7 72.1 67.0 61.7 56.3 50.8 GLONG 49.4 39.7 22.3 352.0 316.7 293.6 280.7 273.1 268.0 264.2 261.4 MLT 17:43 17:30 17:10 16:33 14:58 11:25 08:56 07:59 07:32 07:16 07:06
F13
02/356
Dec 22
LOG ENERGY (EV)
JHU/APL 5 10 3 8 ELEC IONE FLUX
LOG
closed field lines llbl arc polar rain cusp llbl closed field lines
F
ig 7
Fig. 7. Spectrogram from the DMSP F13 spacecraft for the time interval 13:25 to 13:41 UT. The black dashed lines on the plot mark the
boundaries between plasma regions.
closed field lines llbl polar-cap arc void polar-rain/mantle cusp Fig 8
Fig. 8. The map-potential flow contours for the interval 13:34 to
13:36 UT, overlaid is the track of the F13 spacecraft from 13:24 to 13:41 UT. The track is colour coded to show the different plasma regions. Overlaid are the cross-track plasma velocity vectors mea-sured by the DMSP spacecraft.
13:34:03 UT the spacecraft is then located within a polar rain/mantle precipitation region. At 13:34:03 UT it enters a region of cusp-like precipitation. Compared with the po-lar cap/mantle region, the cusp region is characterised by an enhanced flux of precipitating electrons with energies below 1 keV, as well as low-energy ions towards its lower-latitude boundary. Between 13:37:16 and 13:38:12 UT the spacecraft is again located within the llbl region, before moving on to the dawn closed field line region at 13:38:12 UT.
Figure 8 presents the map-potential flow streamlines for the interval 13:34 to 13:36 UT, overlain on which is the track of the F13 spacecraft from 13:24 to 13:41 UT. Red por-tions of the track indicate closed field lines, black the llbl, yellow the polar-cap arc regions, orange the void regions, green the polar-cap/mantle region, and blue the cusp. The spacecraft traverses the Northern Hemisphere polar cap from dusk to dawn. The spacecraft is initially located on closed field lines, within the sunward flow of the dusk convection cell. It then passes briefly through the llbl region, also in the region of sunward flow, before entering the polar-cap arc region, which is located at the centre of the dusk con-vection cell. The spacecraft then passes through the
polar-G. Provan et al.: Pulsed flows observed during an interval of prolonged northward IMF 1215 1100 1130 1200 1230 1300 1330 UT -72 -74 -76 -78 -80 -82 Magnetic Latitude 1100 1130 1200 1230 1300 1330 UT -72 -74 -76 -78 -80 -82 Magnetic Latitude Beam 4 1100 (356) to 1335 (356) 1100 1130 1200 1230 1300 1330 UT 72 74 76 78 80 82 84 Magnetic Latitude 1100 1130 1200 1230 1300 1330 UT 72 74 76 78 80 82 84 Magnetic Latitude Beam 2 Hankasalmi 1100 (356) to 1335 (356) Syowa East -800 -600 -400 -200 0 200 400 600 800
Velocity (m
s
-1)
Ground Scatter F ig 9Fig. 9. L-o-s velocities from the Hankasalmi (beam 2) and Syowa East (beam 4) radars from 11:00 to 13:35 UT during interval A. Overplotted
black lines highlight some of the PIFs.
rain/mantle region before entering the cusp region, located within the high-latitude convection throat in the morning sec-tor. The spacecraft then briefly passes through the llbl region again before moving onto closed field lines which generally coincide with the sunward flows of the dawn convection cell. Also shown in Fig. 8 are the cross-track plasma velocity vectors measured by the DMSP spacecraft. These are in gen-eral accord with the SuperDARN flow map, though some small-scale features are observed in the spacecraft data in the dusk sector, as will be discussed further below in Sect. 4, that are not reproduced in the large-scale radar map. In addition it will be noted that there is a discrepancy in the sense of the cross-track flow in the noon sector, with the radar-derived map indicating an antisunward flow in this region, while the spacecraft data indicate a weak sunward flow. We note, how-ever, that radar backscatter is not actually observed in this specific region during the interval (see Fig. 6a) with the im-plication that the streamlines of the “dusk” cell are actually more extended across noon into the dawn sector than is im-plied by the radar map. The principal flow at the spacecraft was thus most probably a flow along the track from dusk-to-dawn.
Figure 9 presents the l-o-s velocity observed in beam 2 of the Hankasalmi radar and beam 4 of the Syowa East radar during interval A. The Hankasalmi and Syowa East radars
view approximately conjugate regions of the ionosphere but with different viewing direction to the flow. The Hanksalmi radar is clearly observing pulsed ionospheric flows (PIFs) moving away from the radar at high latitude. The PIFs have a recurrence rate of approximately 15 min. Some of the PIFs have been identified on Fig. 9 with black lines, in order to guide the eye. Previous work by Provan et al. (1998) has identified PIFs as being the ionospheric signature of FTEs occurring at the dayside magnetopause. The Syowa East radar is observing a flow reversal boundary with the plasma flowing towards the radar equatorwards of the boundary and away from the radar polewards of the boundary. Syowa East also appears to be observing pulsed flows at this time, pole-ward of the flow reversal boundary. A few of these flows have been tentatively identified with black lines. However, the pulsed flow signatures in the Southern Hemisphere plot are not as clear and easy to identify as the pulsed signatures observed in the Northern Hemisphere.
In order to further examine the pulsed flow, we selected a few range gates within the main regions of backscatter iden-tified in Fig. 9, and present the averaged l-o-s velocity from these ranges in Fig. 10. The top panel shows the average l-o-s velocity obl-o-served at l-o-six rangel-o-s between magnetic latitude
76◦to 80◦ for beam 2 of the Hanksalmi radar. The bottom
1216 G. Provan et al.: Pulsed flows observed during an interval of prolonged northward IMF
1100 1130 1200 1230 1300 1330
1100 1130 1200 1230 1300 1330
F
ig 10
Fig. 10. The top panel presents the average l-o-s velocity observed at six ranges between magnetic latitude 76◦to 80◦for beam 2 of the
Hanksalmi radar. The bottom panel shows the averaged velocity observed at selected ranges between latitudes −76◦to −82◦for beam 4 of
the Syowa East radar. The dashed black lines are the standard deviation of the average velocity. Solid red lines highlight selected flow pulses.
between latitiudes −76◦ to −82◦ for beam 4 of the Syowa
East radar. The dashed black lines presented on the graphs are the standard deviation of the average velocity. Figure 10 clearly demonstrates that flow pulses are observed in both hemispheres, as marked by the solid red lines, with the mag-nitude of the l-o-s velocities fluctuating with time. These PIFs have an average recurrence period of ∼15 min in both the Northern and Southern Hemispheres.
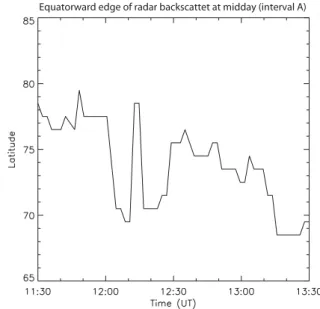
FTEs at the dayside magnetopause result in the addition of open flux to the polar-cap and the subsequent equator-ward motion of the polar cap boundary. Previous work by Milan et al. (1998) demonstrated that the latitudinal extent of the ionospheric backscatter in the dayside auroral regions relates to the boundaries of geophysical processes. Specifi-cally, Rodger et al. (1995) and Milan et al. (1999) identified the equatorward boundary of the radar backscatter near noon to be co-located with the equatorward boundary of 630 nm emission from cusp precipitation. Although the open-closed field line boundary (OCB) may be typically displaced a few tens of km equatorward of the boundary of the emission, we can thus nevertheless use the backscatter boundary to track the motion of the OCB poleward or equatorward. The equa-torward edge of the radar backscatter for the interval stud-ied here has been determined from the Northern Hemisphere
map-potential global convection plots. Figure 11 presents the position of the equatorward boundary of radar backscat-ter from 11:30 to 13:30 UT during inbackscat-terval A. The position of the boundary is quantised by the map-potential grid to which the vectors are mapped, which has grid cells which
are 1◦in latitude (∼111 km projected onto the Earth’s
sur-face), and as close to 111 km in longitude as possible. The equatorward boundary of radar backscatter is at a latitude of
78.5◦at 11:30 UT, but by 13:30 UT the boundary has moved
equatoward to a latitude of 69.5◦. This equatorward
pro-gression of the radar backscatter is not gradual and contin-uous, but stepwise, with an equatorward “step” of the bound-ary approximately every 15 min. However, between ∼12:15 and ∼12:35 UT the radar backscatter boundary moved in a
mainly poleward direction, at this time the IMF Bz
compo-nent was generally equal to or greater than the By
compo-nent.
3.4 Interval B
We have defined interval B as lasting from 13:35 to 16:10 UT.
During this time the IMF Bz component was generally
larger the By component, except for a few minutes around
neg-G. Provan et al.: Pulsed flows observed during an interval of prolonged northward IMF 1217
ative resulting in a clock angle of ∼−60◦. Between 14:30
and 16:10 UT the IMF conditions were fairly steady with the
IMF Bzcomponent dominating the Bycomponent.
Studying Figs. 3 and 4, we can see that there is a rapid and extensive reconfiguration in the plasma flow observed by the SuperDARN radars between interval A and interval B.
The IMF Bzcomponent starts to dominate By at 13:35 UT.
For the next ten minutes or so the plasma flow appears un-changed with the Hankasalmi and Iceland West radars con-tinuing to observe strong flows away from the radar and the Iceland East radar continuing to observe strong flows towards the radar. Between ∼13:50 and ∼14:00 UT these three day-side Northern Hemisphere radars all observe a decrease in l-o-s velocity. This may be related to the changing direction
of the IMF By component at 13:50 UT. At ∼14:00 UT the
Iceland West and Iceland East radars both start to observe strong flows, directed in the opposite direction to the flows observed prior to ∼13:50 UT.
Figure 12 presents Northern Hemisphere map-potential flow vectors and equipotential streamlines for the interval 14:02 to 14:04 UT. A four cell flow pattern is observed, as opposed to the two-cell pattern detected during interval A. The two high-latitude cells are “reverse” convection cells with sunward flow over the polar-cap and anti-sunward flow at lower latitude, with the post-noon cell being stronger than the pre-noon cell. The plasma flow in the two lower lati-tude cells are rotating in the “standard” direction with anti-sunward flow at high-latitude. The overall flow pattern is typical of flows observed during northward IMF when lobe merging is occurring (e.g. Burke et al., 1979; Knipp et al., 1991; Freeman et al., 1993).
The multi-cell flow pattern shown in Fig. 12 is the first four cell flow pattern to be observed by the radars during
interval B. Thus it takes ∼25 min from when the IMF Bz
component starts to dominate the By component, until the
first four cell flow pattern is observed. In the transitional pe-riod between 13:35 and 14:02 UT the ionospheric flow pat-tern is very variable, with highly distorted two cell patpat-terns, and some three cell patterns, being observed. This dynamic high-latitude convection is observed as the global convection reconfigures from a standard convection pattern to a reverse convection pattern, however it will also be influenced by the variable magnetic field conditions observed during this time. After 14:30 UT the magnetic field conditions become
more stable with the Bzcomponent dominating the By
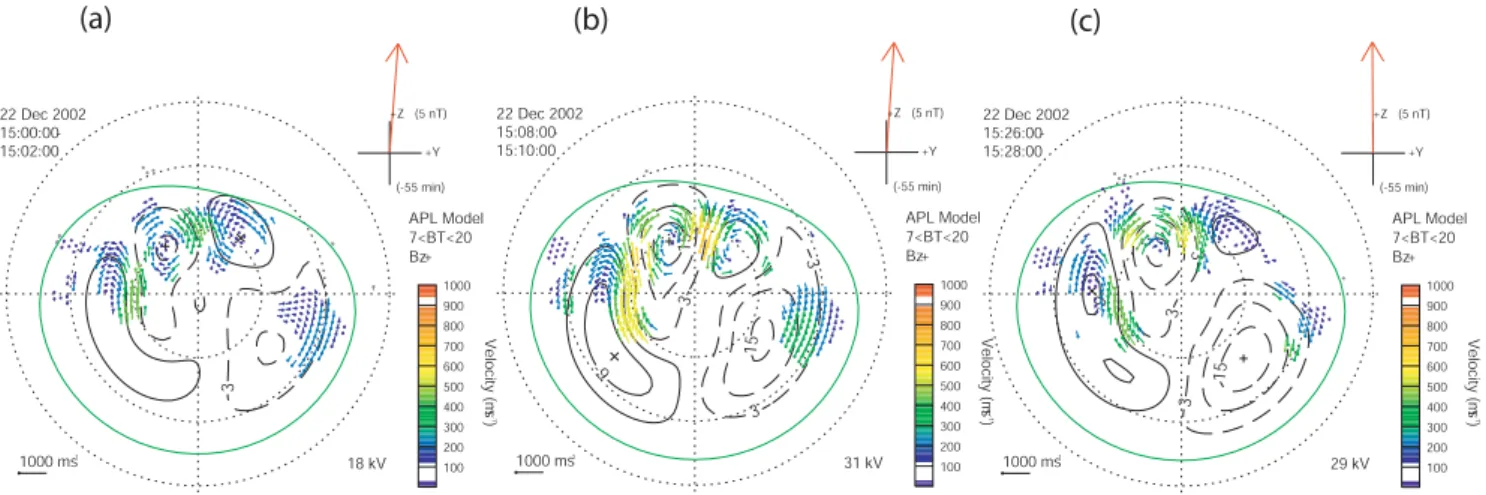
com-ponent. Figure 13 presents the Northern Hemisphere map-potential flow vectors and equimap-potential streamlines observed at three times during interval B; for 2 min intervals starting at (a) 15:00 UT, (b) 15:08 UT and (c) 15:26 UT. The reasons for selecting these specific times will be explained later in this section. Again, four convection cells are observed dur-ing each interval. Due to the lack of backscatter in the South-ern Hemisphere during interval B, we are unable to present a similar analysis of the Southern Hemisphere flows.
Figure 14 presents data from the DMSP F13 spacecraft for the time interval 15:06:00 to 15:20 UT. At 15:06 UT the
F13 DMSP spacecraft is located at a MLAT of 64.8◦and a
Equatorward edge of radar backscattet at midday (interval A) Fig 11
Fig. 11. The latitudinal position of the equatorward boundary of
radar backscatter at local magnetic noon, observed between 11:30 and 13:30 UT during interval A.
3 3 100 200 300 400 500 600 700 800 900 1000 Velocity (m s -1 ) 14:02:00 -14:04:00 22 Dec 2002 18 kV APL Model 7<BT<20 Bz+ 1000 ms-1 +Z (5 nT) +Y (-55 min) Fig 12
Fig. 12. The Northern Hemisphere map-potential flow vectors
and equipotential flow streamlines observed between 14:02 and 14:04 UT (interval B).
MLT of 17:57. Over the next fourteen minutes the spacecraft traverses the polar cap, and at 15:20 UT it is located in the
dawn sector at 06:36 MLT and 68.3◦MLAT. The spacecraft
identifies a decline in ion energy, indicative of the dusk side
OCB, at a magnetic latitude of ∼79.1◦and 17:38 MLT, and
similarly at ∼78.5◦MLAT and 06:53 MLT. These times are
marked with dashed vertical black lines on the plot. A de-tailed analysis of the high-latitude particle precipitation ob-served poleward of the two OCBs is outside the scope of this paper, and will be presented in a subsequent paper.
1218 G. Provan et al.: Pulsed flows observed during an interval of prolonged northward IMF 3 3 100 200 300 400 500 600 700 800 900 1000 Velocity (m s-1 ) 15:00:00 -15:02:00 22 Dec 2002 18 kV APL Model 7<BT<20 Bz+ 1000 ms-1 +Z (5 nT) +Y (-55 min) -9 3 3 3 15 15 100 200 300 400 500 600 700 800 900 1000 Velocity (m s-1 ) 15:08:00 -15:10:00 22 Dec 2002 31 kV APL Model 7<BT<20 Bz+ 1000 ms-1 +Z (5 nT) +Y (-55 min) -9 3 3 3 15 100 200 300 400 500 600 700 800 900 1000 Velocity (m s-1 ) 15:26:00 -15:28:00 22 Dec 2002 29 kV APL Model 7<BT<20 Bz+ 1000 ms-1 +Z (5 nT) +Y (-55 min) (a) (b) (c) Fig 13
Fig. 13. The Northern Hemisphere map-potential flow vectors and equipotential flow streamlines observed at two minute intervals starting
at: (a) 15:00 UT, (b) 15:08 UT and (c) 15:26 UT.
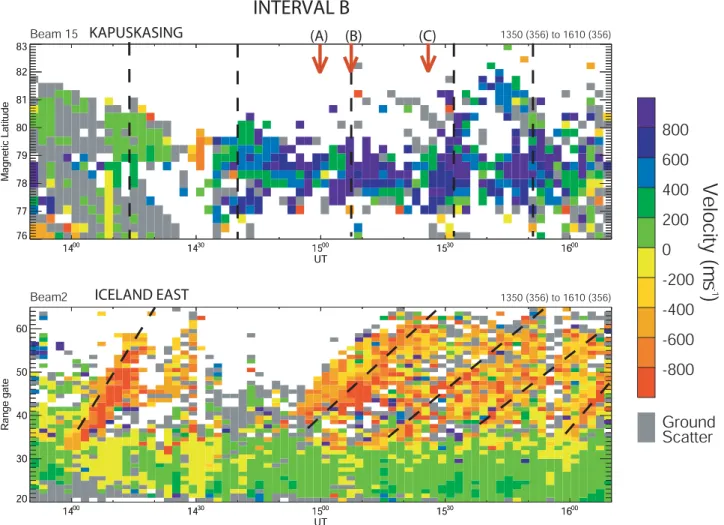
Figure 15 presents a polar-plot of the DMSP F13 space-craft track across the Northern Hemisphere polar region from 15:06 to 15:20 UT. The track is presented as a function of MLAT and MLT, with local noon being located at the top of the plot. The track of the spacecraft is coloured blue equa-torward of the open-closed field line boundary, and red pole-ward of the open-closed field line boundary. Overlaid on the plot are the potential contours observed by the map-potential technique from 15:08 to 15:10 UT (previously presented in Fig. 11). From the figure it can be seen that the two OCB identified in Fig. 14 are located near the poleward boundary of the latitude dawn and dusk cells, such that the low-latitude dawn and dusk cells are located on closed field lines. In the previous section we demonstrated that pulsed flows were observed during interval A. As stated above pulsed flows are also observed during interval B, which we will now study in more detail. Figure 16 presents the l-o-s velocity vectors observed by beam 15 of the Kapuskasing radar and beam 2 of the Iceland East radar from 13:50 to 16:10 UT during interval B. Beam 15 of the Kapuskasing radar is ob-serving the cusp region at this time, and observes flow to-wards the radar. Before ∼14:30 UT the observed l-o-s veloc-ity is comparatively small, after 14:30 UT the l-o-s velocveloc-ity increases significantly. There also appears to be a decline in radar backscatter for a few minutes at ∼14:25 UT. This de-cline, and the subsequent increase in the observed l-o-s ve-locity, is probably due to the variable IMF conditions during
∼14:20 to ∼14:30 UT. The IMF Bz component dominated
the By component for most of interval B, expect for a few
minutes around ∼14:20 UT. After 14:30 UT the magnetic field conditions remained relatively stable, with the IMF Bz
component significantly larger than the Bycomponent. Five
clear flow bursts are observed during interval B, these pulses being marked with overplotted black dashed lines. As the fluctuating IMF conditions before 14:30 UT may affect the flow pulsations, and the occurrence of radar backscatter, we concentrate on the flows observed after 14:30 UT when the IMF conditions were relatively stable. Four pulses are
ob-served between ∼14:30 and ∼16:00 UT, thus having a peri-odicity of approximately 25 min. Beam 2 of the Iceland East radar is located in the post-noon sector at this time, and is pointing in an azimuthal direction, observing the dusk sector. The radar observes strong pulsed flow away from the radar. Due to the zonal pointing direction of the radar beam these pulses can be more difficult to identify in the Iceland East data as compared with the Kapuskasing radar. The approx-imate position of five pulses observed by the Iceland East radar is marked on the bottom panel of Figure 16 with over-plotted black lines.
We wish to study the global flow patterns during the pulsed flows in more detail. Superimposed on the Kapuskasing l-o-s velocity presented in Fig. 16 are three red arrows la-beled (a), (b), and (c). Arrow (a) is positioned just before a flow burst at 15:00 UT, arrow (b) is positioned in the mid-dle of a flow burst at 15:08 UT and arrow (c) just after the flow burst at 15:26 UT. The map-potential flow patterns from these times have already been presented in Fig. 13, and la-belled (a), (b), and (c). At all times multi-cell flow patterns are observed with the high-latitude post-noon flow cell dom-inating the high-latitude pre-noon flow cells. At time (a) rel-atively low velocity flows are observed by the radars. At time (b) much stronger velocity flows are observed by the Northern Hemisphere radars. This increase in the strength and magnitude of the plasma flow is particularly evident in the high-latitude post-noon flow cell with increased flow ob-served from 11:00 MLT to 21:00 MLT. At time (c) (after the flow burst) the magnitude of the plasma flow has again de-creased.
In order to analyse whether these bursts of lobe reconnec-tion were affecting the amount of open flux within the po-lar cap, we again used the equatorward boundary of radar backscatter at magnetic noon to track the position of the OCB. As in interval A, the equatorward edge of the radar backscatter was determined from the Northern Hemisphere map-potential global convection maps. Figure 17 presents the latitude of the equatorward edge of the radar
backscat-G. Provan et al.: Pulsed flows observed during an interval of prolonged northward IMF 1219
Saskatoon
9 13 8 12 LOG JE ELECTRONS IONS 2 4 2 4 LOG E AVE 2 3 4 ELEC 2 3 4 2 3 4 IONS 2 3 4 UT 15:06:00 15:07:23 15:08:47 15:10:11 15:11:35 15:12:59 15:14:23 15:15:47 15:17:11 15:18:35 15:19:59 MLAT 64.8 69.4 74.0 78.6 83.1 87.3 86.9 82.5 77.9 73.1 68.3 GLAT 67.0 71.4 75.5 79.0 81.0 80.5 77.9 74.1 69.8 65.2 60.6 GLONG 27.6 21.2 11.3 354.8 327.9 296.3 273.4 259.7 251.3 245.7 241.6 MLT 17:57 17:54 17:48 17:40 17:18 15:39 08:33 07:12 06:51 06:42 06:36F13
02/356
Dec 22
LOG ENERGY (EV)
JHU/APL 5 10 3 8 ELEC IONE FLUX
LOG
Fig 14
Fig. 14. Spectrogram from the DMSP F13 spacecraft for the time interval 15:06 to 15:20 UT. The two black dashed lines on the plot indicate
boundaries between open and closed field lines.
ter at magnetic local noon between 14:30 UT and 16:10 UT. This period was chosen as the IMF was particularly stable during this time. The radar backscatter boundary was at a
latitude of 74.5◦at 14:30 UT, but by 16:10 UT it had moved
poleward to a latitude of 76.5◦. This poleward motion of the boundary was not steady, but occurred in a stepwise manner. Between 14:30 and 16:10 there were five poleward retrac-tions of the boundary, with the boundary relaxing slightly equatorward between each of these retractions. Thus, there was an average time period ∼23 min between each poleward retraction of the radar backscatter, similar to the repetition rate of the bursts of lobe reconnection. Our observations are consistent with the closure of open flux at the dayside mag-netopause during these bursts of lobe reconnection, resulting in the stepwise retraction of the OCB.
4 Discussion
We have performed a detailed case study of one interval of prolonged northward IMF, which occurred on 22 December
2002. We have utilised data from the Northern and Southern Hemisphere SuperDARN radars, the low-altitude F13 DMSP spacecraft, the ACE spacecraft, as well as the map-potential analysis tool. We have studied two intervals during this day in particular detail. During interval A (11:00 to 13:35 UT)
the IMF By component was positive and comparable with
or greater in magnitude than the IMF Bz component.
Dur-ing interval B (13:35 to 16:10 UT), the IMF Bz component
was predominantly greater than the By component (except
for a few minutes around 14:20 UT). This change in the IMF conditions corresponded to a significant change in the high-latitude convection pattern.
We have presented map-potential global convection patterns for both the northern and Southern Hemisphere. The convection patterns are calculated by a mathematical fitting technique using all the available line-of-sight velocity mea-surements. The solution is constrained by folding in infor-mation from a statistical model (Ruohoniemi and Greenwald, 1996), keyed to the IMF conditions. As the l-o-s vectors are fitted to a model, it is always useful to investigate how
im-1220 G. Provan et al.: Pulsed flows observed during an interval of prolonged northward IMF -9 3 3 3 15 15 F13 20021222, NORTHERN HEMISPHERE GLOBAL CONVECTION, 1508-1510 UT.
12 MLT
06 18
24 MLT
closed field lines high-latitude field lines Particle regions
Fig 15
Fig. 15. Polar-plot of the DMSP F13 spacecraft track across the
Northern Hemisphere polar region from 15:06 to 15:20 UT. The track is presented as a function of MLAT and MLT, with local noon being located at the top of the plot. The track of the spacecraft is coloured blue equatorward of the open-closed field line boundary, and red poleward of the open-closed field line boundary. Overlaid on the plot are the potential contours observed by the map-potential technique from 15:08 to 15:10 UT
portant the model is in determining the final convection pat-tern. Since the model is parameterised by the upstream IMF, a good way to check its influence is to force the model to use a fixed IMF input with different characteristics to those
actu-ally observed (e.g. Grocott et al., 2002). For the present
study we reanalysed our northward IMF interval with the IMF input fixed in a strong southerly orientation with an op-posite sense of By. The results, while sometimes different in
regions of little or no radar backscatter, showed similar flow patterns in regions where radar data were present. Indeed, evidence of lobe “reverse” convection cells was still clearly apparent, even though the statistical model for southward IMF conditions contains no such cells. This illustrates that, in the present case, the data are clearly dominating the model in our determination of the convection pattern and gives us confidence in using these pattern to draw conclusions on the nature of the flow.
During interval A both the Northern and Southern Hemi-sphere map-potential flow contours showed a distorted twin cell convection pattern with anti-sunward flow at high-latitude, and sunward return flow at lower latitude (Figs. 6a and b). The Northern Hemisphere flow pattern is distorted with the dusk flow cell dominating the dawn cell, and signif-icant flow of dusk sector plasma across the noon meridian. The Southern Hemisphere radars also observed a two-cell convection pattern (Fig. 6b). It would appear from the de-rived convection pattern that in the Southern Hemisphere the post-noon convection cell is dominating the pre-noon cell. However, we do not feel confident in discussing potential distortion in the Southern Hemisphere flow pattern, due to the lack of data in the dawn and pre-noon regions. The pres-ence of antisunward flow in the midnight sector, however,
is consistent with the continuous presence of Dungey cycle convection.
Heppner and Maynard (1987) presented Northern Hemi-sphere empirical flow patterns for intervals of positive IMF
By. The distorted two-cell convection pattern observed by
Heppner and Maynard (1987) under weakly positive IMF
Bz conditions are similar to the Northern Hemisphere flow
pattern presented in Fig. 6a. The flow pattern shows the
typical By asymmetry that one would expect for standard
Dungey-cell flow, as has previously been discussed by e.g. Jørgensen et al. (1972) and Cowley (1981). It is
interest-ing to note that this By flow asymmetry persists when the
clock angle is ∼50◦to ∼60◦. Grocott et al. (2003) has ob-served a highly distorted Bydominated twin cell flow pattern
when the IMF clock angle was ∼−50◦ to ∼−60◦. Our
re-sults support previous observations by e.g. Clauer and Friis-Christensen (1988), Freeman et al. (1993) and Greenwald
et al. (1995), that during intervals of positive IMF Bz and
a large IMF By, the magnetic shear at the dayside
magne-topause is sufficient for reconnection to occur equatorward of the polar cap, resulting in the creation of a distorted two-cell convection pattern. Similar conclusions have also been reached from studies of the cusp auroral morphology (e.g. Sandholt et al., 1998).
However, in this study combining global convection pat-terns with particle precipitation observations have shown that the observed convection pattern does not just consist of two distorted merging cells. Within the centre of the dusk con-vection cell we observed polar cap arc particle precipitation. Such precipitation has previously been observed in a dusk convection cell during an interval of positive IMF Byand Bz
where By Bz (Eriksson et al., 2002, 2003). Eriksson et al.
(2002, 2003) observed the polar cap arc particle precipita-tion on sunward flow within a high-latitude lobe cell in the dusk region. The lobe cell was located next to a viscous cell within the dusk merging cell. The observed convection pat-tern was a three-cell convection system of coexisting merg-ing, viscous and lobe-type convection cells, as suggested by Burch et al. (1985) and Reiff and Burch (1985). During in-tervals of positive (negative) IMF Bythey predicted that the
dusk (dawn) merging cell dominates the dawn (dusk) cell in the Northern Hemisphere, and that the lobe and viscous cells where to be found within the dusk (dawn) merging cell. Eriksson et al. (2002) found that the existence of such com-posite convection cells was strongly linked to conditions of IMF By/Bz>1. The observations presented in this paper are
consistent with a large IMF By component creating a
mag-netic shear at the dayside magnetopause sufficient for recon-nection to occur on closed field lines located equatorward of the OCB, simultaneously with merging in the high-latitude lobe regions.
In this study we observed a lobe convection cell within the centre of the dusk merging cell. Burch et al. (1985) suggested that equatorward of this lobe cell we should observe a narrow viscous cell. A convection reversal should then be observed within the viscous cell and a second flow reversal should be observed within the higher-latitude sunward flow cell of the
G. Provan et al.: Pulsed flows observed during an interval of prolonged northward IMF 1221 1400 1430 1500 1530 1600 UT 20 30 40 50 60 Range gate 1400 1430 1500 1530 1600 UT 20 30 40 50 60 Range gate Beam 2 1350 (356) to 1610 (356) 1400 1430 1500 1530 1600 UT 76 77 78 79 80 81 82 83 Magnetic Latitude 1400 1430 1500 1530 1600 UT 76 77 78 79 80 81 82 83 Magnetic Latitude Beam 15 1350 (356) to 1610 (356)
INTERVAL B
ICELAND EAST KAPUSKASING (A) (B) (C)-800
-600
-400
-200
0
200
400
600
800
Velocity (m
s
-1)
Ground
Scatter
Fig 16Fig. 16. The l-o-s velocity observed by beam 15 of the Kapuskasing radar and beam 2 of the Iceland East radar from 13:50 to 16:10 UT
(during interval B). Overlaid black lines highlight flow pulsations. Three red arrows are overlaid on the l-o-s velocity observed by the Kapuskaing radar, and labelled a, b and c. Arrow a is positioned just before a flow burst at 15:00 UT, arrow b is positioned in the middle of a flow burst at 15:08 UT and arrow c just after the flow burst at 15:26 UT. The times correspond to the flow maps shown in Figs. 13a, b and c.
lobe cell and the lower-latitude anti-sunward flow of the vis-cous cell. The map-potential global convection pattern does not observed this anti-clockwise rotating viscous cell, how-ever the cross-track DMSP vectors shows a narrow regions of anti-sunward flow at the equatorward edge of the lobe con-vection cell, consistent with the viscous concon-vection cell pre-dicted by Burch et al. (1985). It is possible that this narrow flow cell is not present on the map-potential global convec-tion pattern as the map-potential technique produce global maps of the plasma flow, and small-scale flow changes may be overlooked.
The dusk lobe cell lies within polar-cap arc precipitation, as defined by Lyons et al. (1996). Eriksson et al. (2002, 2003) reported that such polar-cap arc precipitation is associated with sunward flow on high-latitude lobe cells. Our observa-tions suggest that the polar-cap arc precipitation is associated with both the sunward and anti-sunward flow of the lobe cell. However, this result may be due to the shape of the lobe cell not being accurately reproduced by the map-potential algo-rithm as mentioned earlier. The lobe cell was partially within
the field-of-view of the Goose Bay radar at this time, and as stated above the Goose Bay radar was not working dur-ing this interval. The DMSP flow vectors also suggest that there is a flow stagnation region within the lobe cell, with some very weak anti-sunward flow being observed. Eriksson et al. (2002) also observed a flow stagnation region within a high-latitude lobe cell, poleward of the region of sunward plasma convection. They noted that Phan et al., 2000 re-ported that the WIND spacecraft observed a similar region of stagnant magnetosheath-like ions deep inside the magne-totail lobes.
Reiff and Heelis (1994) have suggested that the distorted two-cell convection pattern may be a transitional pattern which occurs as the IMF conditions changes. Our results, and the results presented by Greenwald et al. (1995) and Gro-cott et al. (2003), would suggest that the distorted two-cell convection pattern is a stable configuration, occurring when
the IMF Bycomponent is positive and dominates the IMF Bz
1222 G. Provan et al.: Pulsed flows observed during an interval of prolonged northward IMF
Latitude of open-closed field line boundary at magnetic local noon (interval B)
14:30 15:00 15:30 16:00
Equatorward edge of radar backscatter at local noon (interval B)
Fig 17
Fig. 17. The latitudinal position of the equatorward boundary of
radar backscatter at local magnetic noon, observed between 14:30 and 16:10 UT during interval B.
During interval A, the Northern and Southern Hemi-sphere radars observed pulsed high-velocity flows moving to higher-latitudes with time, with an average recurrence rate of ∼15 min (Figs. 9 and 10). This flow was observed to lie within the two merging cells, and it is not yet clear whether the flow within the dusk lobe cell was also pulsating. Dur-ing interval A the equatorward edge of the Northern Hemi-sphere radar backscatter also moved equatorward in a step-wise manner approximately every 15 min, suggesting that the OCB moved in a similar manner. In the past, pulsed flows have been observed on open field lines by the SuperDARN radars (Provan et al., 1998), and have been identified as being the ionospheric signatures of FTEs occurring at the dayside magnetopause. The observations presented here are consis-tent with flux transfer events occurring at the dayside magne-topause with a repetition rate of ∼15 min. The FTEs are ob-served as PIFs in the radar data, and result in the bursty addi-tion of open flux to the dayside magnetosphere and the subse-quent stepwise equatoward expansion of the OCB. Previous work by Milan et al. (1999) used the equatorward bound-ary of the radar aurora as a proxy for the open-closed field line boundary, and related the rapid equatorward motions of this boundary to the occurrence of individual flux trans-fer events. Our results are the first detailed analysis of flux transfer events observed during an interval of northward IMF. However, McWilliams et al. (2000) performed a statistical study of pulsed ionospheric flows. The analysis technique was based on the Fourier transform, which was used to se-lect the dominant repetition rates of the periodic flow bursts seen along the radar line-of-sight. One third of the pulsed ionospheric flow intervals occurred when the interplanetary magnetic field had a northward component, although the
rel-ative magnitude of the Bycomponent was not considered by
these authors.
During interval B the IMF Bz component was generally
greater than the IMF By component. The l-o-s velocities
observed in the Northern (Fig. 3) and Southern (Fig. 4) Hemispheres demonstrated an extensive and dramatic re-organisation of the high-latitude plasma flows. In the North-ern Hemisphere the high-latitude flow pattNorth-ern changed from a standard two cell convection pattern to a reverse four cell convection pattern over a ∼25 min period. However, the vari-able IMF conditions might have effected the time it took for the flow patterns to reorganise. Previous work by e.g. Clauer and Friis-Christensen (1988), and Freeman et al. (1993) stated that while a distorted standard two cell convection
pat-tern could be observed during northward IMF Bzand large
IMF By conditions, convection under a northward IMF Bz
but a small IMF Bywas most consistent with a four cell
con-vection pattern, as found here.
The Southern Hemisphere radars which observed the day-side during intervals A and B (Syowa, Syowa East and Sanae) experienced a sudden decline in radar backscatter during interval B, as compared with interval A. However, this decline in the radar backscatter may be related to a change in
the direction of the IMF Bycomponent at 13:50 UT, from By
positive to Bynegative.
The observed multi-cell flow pattern observed in the Northern Hemisphere consisted of two high-latitude reverse convection cells with sunward flow over the pole, and two lower-latitude standard flow cells with anti-sunward flow. Reverse convection cells observed during northward IMF are indicative of lobe merging, as described by Dungey (1963). Data from the DMSP F13 spacecraft indicates that the two standard cells could lie on closed field lines. During interval B pulses of reverse convection were clearly observed by the Kapuskasing and Iceland East radars (Fig. 16). The pulsed flows had a periodicity of ∼25 min. The flow bursts were associated with a stepwise poleward retraction of the equa-torward boundary of radar backscatter. Similar bursts of re-verse convection and a stepwise poleward motion of radar backscatter have previously been observed by Sandholt et al. (2000). These authors reported a case study of an interval containing a rapid northward turning of the IMF. This north-ward turning was accompanied by a long stepwise polenorth-ward retraction and latitudinal widening of the band of auroral emission in the Northern Hemisphere cusp region. Data from selected Northern Hemisphere SuperDARN radars demon-strated that the auroral poleward motion was associated with bursts of reverse two-cell convection, and a stepwise pole-ward motion of the radar backscatter. They concluded that the observations were consistent with a theoretical descrip-tion of a sequence of bursts of lobe merging involving both hemispheres, resulting in closed flux being added to the day-side magnetosphere. We believe the same process to be oc-curring here. The retraction of the equatorward boundary of radar backscatter is consistent with the lobe reconnection occurring in both hemispheres, adding closed flux to the day-side magnetosphere (Cowley, 1981, 1983; Cowley and