Development and Testing of An Application Specific Force Sensor for Snowpack Assessment
MASS
by
Samuel Tileston Whittemore
Submitted to the
Department of Mechanical Engineering
in Partial Fulfillment of the Requirements for the Degree of
ACHUSETTS INSTITUTE OF TECHNOLOGY
JUL 30 2014
LIBRARIES
Bachelor of Science in Engineering as Recommended by the Department of Mechanical Engineering
at the
Massachusetts Institute of Technology February 2014
C 2014 Samuel Tileston Whittemore. All rights reserved.
The author hereby grants to MIT permission to reproduce and to distribute publicly paper and electronic copies of this thesis document in whole or in part in any medium now known or
hereafter created.
Signature of Author:
Certified by:
Signature redacted
Department of Mechanical Engineering January 24,2014
Signature redacted
Warren P. SeeringWarren P. Seering Weber-Shaughnfss Professor of Mechanical Engineering
At Thesis Supervisor
Signature redacted
Accepted by:
Anette Hosoi Professor of Mechanical Engineering Undergraduate Officer
Development and Testing of An Application Specific Force Sensor for Snowpack Assessment
by
Samuel Tileston Whittemore
Submitted to the Department of Mechanical Engineering on January 2 4th, 2014 in Partial Fulfillment of the
Requirements for the Degree of
Bachelor of Science in Engineering as Recommended by the Department of Mechanical Engineering
Abstract
Snow penetrometers create a specific application for a force sensor with specifications that are over achieved at great cost when using traditional load cells. A moderately priced, compact force sensor suitable for this application does not exist, and numerous force-sensing technologies were investigated, from spring and displacement transducer combinations, to strain gauges mounted on plastics, to pressure transducers. The high dynamic range, linearity, and electrical simplicity of low-cost piezo-resistive pressure sensors lent well to rapidly developing a working design on a small budget. Preliminary prototypes show promising results where the natural frequency
requirement is 60% above the target specification at co, = 10497 rad/s 92 rad/s. The sensor is nearly ideally damped with damping ratio, ( = .43 .04. A linear model results in acceptable hysteretic error for mid and upper range force values, but the sensor performs inaccurately below
2.8 N (greater than 20% error). While the sensor's performance isn't perfect for all criteria,
snowpack simulation tests suggest that the sensor's shortcomings are acceptable for the targeted application of measuring relative snow hardness.
Thesis Supervisor: Warren P. Seering
Acknowledgements
I would like to thank Professor Seering for his thoughtful guidance and optimism
throughout this project. His experience gave me confidence in my research and our shared enthusiasm continues to push the design as I work for AvaTech. I also want to thank Michael Chuah for assisting me with early prototypes and sharing his experience with pressure sensors. I would like to acknowledge Christina Chase and all the folks at the Trust Center for GFSA and organizing the serendipitous t=O hardware night that put Michael and me in contact. I want to thank my two co-founders at AvaTech, Brint Markle and Jim Christian, for helping start the project that motivates this research, and offering to help every step of the way. I owe Dr. Hughey, Eric Lutz, HP Marshall, Mark Belanger, Joe Church, Nikita Khylstov, and Jim Pierson a thank you for offering their expertise on design considerations that were outside of my knowledge. Finally, I would like to thank my friends and family for encouraging my hard work and being a home to return to at the end of the day.
Table of Contents Abstract 3 Acknowledgements 5 Table of Contents 7 List of Figures 8 1. Introduction 9
2. Snow Penetrometer Design 10
2.1 Snow Penetration Resistance 10
2.2 Target Specifications and Project Goals 11
2.3 Penetration Resistance Sensor Research and Prototype Development 12
2.3.1 Strain Gauges 13
2.3.2 Piezoelectric Transducers 16
2.3.3 Displacement and Spring 16
2.3.3.1 Spring Geometries 16
2.3.3.2 Magnetic Field Intensity (Hall Effect) 18
2.3.3.3 Digital Encoders 21
2.3.3.4 Linear Variable Differential Transformers (LVDT) 22
2.3.3.5 Capacitance 22
2.3.4 Pressure 22
3. Experimental Evaluation of the Sensor Design 31
3.1 Force Range, Precision, and Dynamic Range 31
3.2 Characterizing the Transient Response 39
4. Conclusions 40
List of Figures Figure 2-1: Figure 2-2: Figure 2-3: Figure 2-4: Figure 2-5: Figure 2-6: Figure 2-7: Figure 2-8: Figure 2-9: Figure 2-10: Figure 2-11: Figure 2-12: Figure 2-13: Figure 3-1: Figure 3-2: Figure 3-3: Figure 3-4: Figure 3-5: Figure 3-6: Figure 3-7:
Mechanical schematic of snow penetrometer tip Early strain gauge on rubber prototype
Output vs. input graph of strain gauge on rubber prototype SolidWorks nonlinear FEA for flat plate - force vs. displacement Hall Effect sensor prototype
Output vs. input graph of Hall Effect prototype Electromagnetic FEA of Hall Effect prototype
Mechanical schematic of polymer based pressure sensor Modeling diagram of polymer based pressure sensor
First generation of polymer based pressure sensor prototypes Third generation of polymer based pressure sensor prototypes Polymer based pressure sensor optimization assembly
Field testing polymer based pressure sensor prototypes Output vs. input graph of final polymer based pressure sensor Output vs. input graph of near final sensor
Definition of linear fit force residual
Linear fit force residual vs. input force graph and error histogram Linear fit force error vs. input force graph
Snowpack simulation performance graph Second order system mechanical schematic
10-11 14 15 17 18-19 19 20 23 24 27 28 29 30 31-32 33 34 35 36 38-39 39-40
1. Introduction
A snow penetrometer is a device used to measure snow hardness by sensing the pressure
required to drive a pole through the snowpack (defined as snow penetration resistance [MPa]). With applications related to polar ice stability, water resource surveying, and avalanche safety, the designs and use cases for these devices are broad. Some penetrometers are motor driven through the snowpack up to 5 meters to assess polar ice cap strength, while others are hand driven devices that only penetrate 1.5 meters'. This research is motivated by the need for a lightweight, low-cost, handheld penetrometer designed for avalanche safety professionals and amateur backcountry skiers.
While a penetrometer can be made by placing off-the-shelf sensors at the tip of a pole, the technology currently available sells for $80,000, making penetrometers available only to a few snow scientists and avalanche forecasters. The need to weatherproof and overload-protect these devices further complicates the design and increases cost. However, while the primary goal of this research is to determine relative, not absolute, snow hardness, many existing sensors are over-engineered for the minimum specifications to determine a snow hardness profile. Consequently, there is an opportunity to develop an application-specific sensor to reduce manufacturing cost while still meeting minimum requirements.
Research began with the goal of improving on existing prototypes that suffered from unacceptable hysteresis and contamination sensitivity. Strain, Hall Effect, capacitance, pressure, and LVDT sensing concepts were compared, and the technologies most suited for this project's target specifications were prototyped. The sensor will be modeled as damped second order system whose response characteristics can be determined by measuring impulse response parameters (response time, damping ratio), quasi-static output vs. input relationship, and frequency response. The sensor will be tested for its ability to meet several core specifications: 1) natural frequency, 2) damping ratio, 3) overall precision. The background section of this thesis overviews snow penetrometry, second order dynamics, and sensor precision, while the remainder focuses on second order characterization of the sensor and the precision resulting from a linear model. If results are significant, this testing will determine if the discussed design is worth continuing to pursue, and if so, which areas need improvement and special attention.
2. Snow Penetrometer Design 2.1 Snow Penetration Resistance
Typical snow/ice penetration resistance (also referred to as snow hardness) can range from 0 - 40 MPal. However, for avalanche safety assessment, penetration resistance values rarely exceed 3 MPa, and only values between 0 - 1 MPa are of interest for determining slope
stability, allowing any values above 1 MPa to be lumped together as hard, ice-like snow'. The equivalent penetration force can be found by multiplying the penetration resistance pressure by the cross sectional surface area of the resistance-sensing element that transmits the signal from the snow to the sensor:
od
resistance sensing elementFigure 2-1: Shown above is a schematic representation of the penetrating tip at leading end of the penetrometer pole. The snowpack exerts a force on the pointed cone of the resistance sensing element that depends on snow type. The resulting force signal can be used to generate snowpack stratigraphy that shows major layer boundaries and layer hardness.
2.2 Target Specifications and Project Goals
Using penetrometers for avalanche safety snowpack assessment requires measurement of snow pressures up to 1 MPa, resulting in a maximum force requirement of up to 19.6 N for a 5 mm diameter resistance sensing element:
F = P"wd 2 = 19.6 N 4
Extremely low density snow can have a penetration resistance pressure as low as .0001 MPa, but professionals only require measurements down to .0025 MPa (.05 N for a 5 mm resistance sensing element)2. A linear sensor is targeted for ease of calibration and software integration, which results in a dynamic range requirement of at least 400. Furthermore, snow hardness regimes (e.g. hand hardness classifications) follow a logarthmic scaling, making large changes in hardness (e.g. changes of at least 100%) more important than small variations in snow hardness. Consequently, the sensor precision is not as critical as in systems that scale linearly with the same dynamic range, and an initial target specification is 20% of any given input. This parameter is defined as "linear fit force error" (E%) in section 3.1.
Past research on snow penetrometry has found that the resistance sensing element can be sharpened to a 60 degree cone to help prevent compaction at the tip while also keeping tip height relatively low'3. The resulting tip height for a 5 mm diameter resistance sensing element is 4.33
mm, which effects the thickness of a weak (soft) snow layer that can be detected. As a starting point, this research aims to develop an instrument capable of detecting weak layers with a thickness of at least 5 mm. The soft snow input will be masked by surrounding hard snow until the resistance sensing element is fully embeded in the weak layer. This will take up the first 4.33 mm of weak layer, leaving .67 mm left for the sensor's transient response to approach the near
steady state value. AvaTech's research has shown that 2 m/s is an appropriate upper limit on penetration speed, which leaves .34 ms for the sensor to reach it's new value. All sensing concepts were modeled with the mechanical domain as a second order system, where the
10%-90% rise time, TR, is used to determine the corresponding natural frequency,f [Hz], requirement:
.35 (2)
TR =
f
resulting in a natural frequency specification off > 1030 Hz (6470 rad/s).
The penetrometer tip must be able to withstand shock loads up to 1500 N (referred to as overload protection), and must be sealed from dust, sand, ice, and water (up to 1.5 m deep) ingress. The sensor will be integrated into a collapsible pole, requiring that the sensing assembly be no greater in diameter than 15 mm and no longer than 300 mm. The usage environment requires that the sensor maintains specified performance between -20 degrees Celsius and 25 degrees Celsius. The sensing unit should perform adequately for at least 20,000 snowpack tests
(2-3 years of heavy use). Furthermore, the entire tip assembly must cost $40 or less in production
volumes of 1000 units and up.
Finally, the sensor design had to be finalized in 3 months with a budget of $5,000 and access to a CNC/manual machine shop and prototyping space. The goal of this project is to arrive -on a design that meets the above target specifications and can be incorporated into 25 complete penetrometer prototypes for AvaTech's 2014 testing program. This requires that 25 working penetration resistance sensors are available for assembly by the end of January, 2014.
2.3 Penetration Resistance Sensor Research and Prototype Development
Snow penetration resistance can be treated as a pressure or a force, depending on the transducer used for measurement (1 MPa or 19.6 N, both with a dynamic range of 800). While there are many transducers available off the shelf that meet most mechanical specifications outlined above, the requirements for overload protection, weatherproofing, package size, and manufacturing cost demand a custom sensor. This research began with a broad investigation of
electrical transducers that had potential to meet target specifications for force/pressure range, dynamic range, natural frequency, and geometry. Many concepts were ultimately set aside because of their inability to meet cost and development time constraints. Mechanical solutions
for weatherproofing and overload protection could remain relatively constant across different electrical transducer concepts. Due to the lack of an electrical engineer on the project and a tight timeframe, the development process focused on selecting an acceptable electrical transducer and designing the mechanical system around it.
2.3.1 Strain Gauges
Strain gauges mounted on metal flexures are one of the most common force transducers (load cells) used today. AvaTech used Futek load cells in early penetrometer proof of concept prototypes, but these compact sensors were priced at $1,875. Of over 15 off the shelf load cell manufacturers contacted, none knew of any load cell that would meet the required force range, geometry, and cost specifications. The small diameter needed for this project lends itself well to a strain gauge based sensor for very large forces, where a simple column in axial compression can serve as the flexure under strain. However, the relatively small forces encountered in the snowpack makes it difficult to achieve measurable strains in traditional materials (e.g. metals) in such a compact geometry. As an alternative, very early proof of concept prototypes were made
by gluing strain gauges onto a cylinder of polyurethane rubber that is under axial compression
Figure 2-2: This picture shows an early AvaTech prototype, with calipers
set to 1" for scale. Strain gauges are used to measure the elongation/compression of polyurethane rubber due to the force required to penetrate the snowpack. While this style of penetration resistance sensor was suitable to collect roughly
representative snowpack data, it suffers from fragility (due to difficulty gluing strain gauges to a rubber), temperature sensitivity, non-return-to-zero, and hysteretic error. Shown below is a plot of this sensor's output vs. input from a calibrated force sensor (Vernier Dual Range Force Sensor):
so., 0.5 - '.5. 1.0-0 10 5 2 S ex. **4%6 >1.0 J* are** SO 0 0 5 10 15 20 Input Force (N)
Figure 2-3: The output is proportional to the input force, but is also
heavily path dependent. The upper half of the hysteresis loop is data collected during loading cycles, and the lower half is data collected while unloading the sensor. The flat line in the upper right is due to saturation of the instrumental amplifier used to amplify the signal.
AvaTech is continuing to research strain gauge based sensors that incorporate more elastic plastic flexures like acrylic and polycarbonate. Additionally, Strain Measurement Devices
(SMD) is working with AvaTech to develop an OEM thin film strain gauge based sensor, where,
instead of being glued to a surface, strain gauges are etched onto metal to reduce assembly cost and improve mechanical integration. SMD quoted the sensor at $26 each (quantity of 1000 pieces), which does not include any housing or signal conditioning, and may lead to too high a cost. Unfortunately, SMD was unable to provide prototypes by the necessary deadline, but
AvaTech continues to work with them as a back up plan for the future. Other OEM companies could only offer sensors costing $100 or more in high volumes.
2.3.2 Piezoelectric Transducers
Piezoelectric transducers excel in all targeted specifications except cost. The
SnowMicroPen (SMP) contains a hermetically sealed Kistler piezoelectric sensor for snowpack penetration resistance and textural index measurement, but the sensor costs over $2,0003. Furthermore, because of the transient nature of their output, piezoelectric sensors are best for dynamic measurements4. While it's possible that a custom piezoelectric transducer could meet
penetrometer requirements, the high complexity of prototype development, including charge leakage, relatively complex electronics, and sensitivity to contamination, made development of a piezoelectric snowpack sensor unrealistic for this project's timeline and available resources5.
2.3.3 Displacement Measurement with Spring
All force and pressure sensing technologies require an indirect measurement of force (e.g.
force's effect on strain, and therefore resistivity), and measuring the displacement of a calibrated spring opens a broad category of possible force sensors. There are many options for spring parameters, such as geometry, linearity, and stiffness, as well as numerous possibilities for measuring displacement.
2.3.3.1 Spring Geometries
Coil springs exhibit good linearity, a wide variety of available stiffness's, and lend well to fitting the narrow cylindrical package of a snow penetrometer. The main disadvantage of coil springs is the relatively large height taken up in the axial direction.
Thin flexures (diaphragms) clamped on all sides (e.g. flat plates where the thickness is much less than the diameter) provide a stiff spring in a small package, but experience high nonlinearity for deflections over half of their thickness6:
0.15- _0.1-E a) 0.05 0 - ---- -10 20 Input Force (N)
Figure 2-4: SolidWorks nonlinear finite element analysis was used to
model the displacement of the clamped flat plate spring (thickness of .127 mm) as a function of input force. In order to increase the force range over which these springs are linear, a thicker, larger diameter flat plate is required, but such a diameter is not possible inside the narrow pole of a snow penetrometer. The linear section up to .06 mm validates Roark's rule of thumb that linearity remains only up to displacements equal to half the flat plate thickness (.06 mm).
While a thicker plate can be used to create a more linear (and stiffer) spring, the resulting deflections are so much smaller than the nonlinear design that many displacement transducers are unable to measure deflections with the necessary dynamic range (see below).
The form of nonlinearity present in the diaphragm spring, where the displacement vs. force curve has a higher slope for smaller force values, actually loosens the dynamic range requirement for the sensor. Here, more resolution is in the lower force values, which is the exact need for snowpack assessment due to the log scaling used in interpreting penetration resistance data. Of course a linear sensor with great enough dynamic range will suffice, but this type of nonlinearity could be very useful if a linear sensor cannot be developed.
2.3.3.2 Magnetic Field Intensity (Hall Effect)
A common displacement sensor used in robotics outputs a voltage proportional to
magnetic field intensity, which operates by virtue of the Hall Effect. A prototypical force sensor was made by linking a small neodymium magnet and a clamped flat plate spring:
Figure 2-5, Top: Force is applied to the left end of the shaft, which is
supported by the clamped flexure when assembled in the housing. Force is transmitted though the shaft to the flexure spring, resulting in deflection of the
shaft dependent on applied force and flexure stiffness. Consequently, the
embedded magnet moves with the shaft in the direction of applied force. Bottom: The rectangular outline marks the mounting location of the Hall Effect sensor. The sensor is fixed to the housing and does not move with the magnet.
200-150 -100 -50 -0
-r-r
I 2 I 10 20 0 30 Input Force (N)Figure 2-6: A known input was applied to the transducer with a Vernier
Dual Range Force Sensor, which resulted in the output shown above over three load-unload cycles. The nonlinear spring gets stiffer the more it's displaced, resulting in an output vs. input graph with gradually decreasing slope.
The nonlinearity of the sensor's force input vs. voltage output graph closely resembles the nonlinearity that describes the clamped circular flat plate's displacement vs. input force (see figure 2-4).
>
0.
While the similarity between the curves in figures 2-4 and 2-6 is clear, a perfect match isn't expected because magnetic field intensity does not scale linearly with distance away from the magnet (linear magnetic field intensity is required to obtain a linear displacement scale, which would then leave all nonlinearity to the flat plate spring). Finite Element Method
Magnetics (FEMM) was used to model the magnetic field intensity at the Hall Effect sensor as a function of displacement of the magnet:
0.6 ~0.4 0.3 S 0.2 0.1 -0 0.05 0.1 0.15 0.2 Disnlacement (mm)
Figure 2-7: The finite element model shows the magnetic field intensity varies nonlinearly with displacement. The larger the displacement, the closer the magnet is to the Hall Effect sensor. The slope of the above graph increases as the magnet approaches the sensor, which results in the greatest measurement
resolution when the magnet is closest to the Hall Effect sensor.
From figure 2-7, and assuming a linear relationship between displacement and force, the sensor will have greater resolution at higher forces, which is the opposite of what is desired in a snow penetration resistance sensor. However, figure 2-4 illustrates the nonlinear relationship
between force and displacement. These two compounding nonlinearities affect the nonlinear relationship shown in figure 2-6, but the nonlinear effect of the spring is stronger than that of the magnetic field intensity, resulting in an overall output vs. input curve with a gradually decreasing slope. Even though the net nonlinearity is beneficial for snowpack measurement, the nonlinear magnetic field intensity makes the entire output vs. input curve sensitive to small variations in the initial distance between the sensor and the magnet. This makes manufacturing repeatability more important, but could be compensated for by a more complicated calibration process.
Another concern with this transducer is the dynamic range limitation inherent to all single axis Hall Effect sensors available. Based on noise levels and the sensor's output span, the
maximum attainable dynamic range is approximately 550. This is barely enough for a linear sensor, which is concerning, but could work reliably with the right nonlinearity if tight manufacturing tolerances are held.
Despite the difficulties of the single axis Hall Effect sensor used in this project, a promising Hall Effect based design was disclosed in 2002 by a German research group, where two two-axis Hall Effect sensors are used to measure displacement (or rotation) by measuring the change in direction of magnetic field when a magnet is moved relative to the sensor array 7 8. The result is a linear sensor with a dynamic range of 1000. Unfortunately, this setup wasn't
discovered until late in this project, but it stands as a backup plan in case the current choice fails extensive field testing to be completed February through April of 2014.
2.3.3.3 Digital Encoders
Digital encoders are most often based on optical or magnetic counters. While a theoretically infinite dynamic range is possible with a long enough strip of linear encoder
"ticks", the snow penetrometer requires a dynamic range of 800 over a relatively short distance to meet natural frequency requirements. With a resistance sensing element mass of 1 gram, only
1.2 mm of displacement is permissible to keep the natural frequency up to spec (1030 Hz). This is beyond the scope of cost effective encoders available, and a Vernier style transducer with multiple counters was avoided because of the large amount of prototyping complexity compared to other sensing options.
2.3.3.4 Linear Variable Differential Transformers (LVDT's)
Like piezoelectric force transducers, a LVDT and spring combination is well suited to the functional requirements of a snow penetrometer, but remained a poor option for this project because of the high cost of off the shelf sensors9. Designing an LVDT from scratch was avoided because of the electrical complexity required for signal conditioning. With a longer timeframe and a dedicated electrical engineer on board, a LVDT could be an excellent custom transducer that has potential for meeting cost requirements after a lengthy development project.
2.3.3.5 Capacitance Sensors
Due to capacitance's dependency on the distance between two conductors, a simple displacement transducer can be made by measuring the change in capacitance that results from moving one charged plate relative to another. Unfortunately, the relatively long time constant present in low cost capacitance sensors makes them suitable only for measurements up to approximately 200 Hz, which is inadequate for this hand driven penetrometer.
2.3.4 Pressure Sensors
Directing the snowpack pressure into a fluid (or fluid-like medium) allows the use of a pressure sensor to record snowpack resistance values. Piezoresistive pressure sensors are low cost, low noise, and highly linear sensors with a fast response time and small package size. Freescale has a line of on-chip signal conditioned piezoresistive pressure sensors that are used for live monitoring of automobile tire pressure, and the chips cost $5 each in quantities of 1000
1. MIT Researcher Michael Chuah from MIT's Biomimetic Robotics Lab developed a force
sensor that uses a polymer to transmit pressure to the Freescale sensor. Chuah's prototype consisted of a slab of polymer with embedded pressure sensors, where pressure on the slab's surface propagates through the polymer to the pressure sensor. This design inspired an effort to make a similar sensor for the snow penetrometer, which encloses the polymer in a cylindrical metal housing to form a pressure vessel of sorts":
aluminum
resistance sensing ele
J- ,
nent
snow
Figure 2-8: The striped zones indicate locations of a soft polymer, while the remaining spaces are structural aluminum housing. Any forces transmitted to the resistance sensing element propagate through the polymer to the sensor in contact with the upper part of the pressure cavity. The thin sheath of polymer surrounding the resistance sensing element's shaft forms a bearing that allows small displacements of the tip while also sealing the sensor from contamination.
Early prototypes suffered from hysteresis and nonlinearity due to difficulty completely filling the pressure cavity with viscous, uncured polymer. Despite these problems, the sensors'
- pressure sensor
polymer
simple mechanical and electrical configuration allowed for rapid testing and design iteration. However, the lack of documented mechanical properties for polymers made modeling this design extremely difficult. Nonetheless, initial physical relationships and order of magnitude
approximations were possible by considering the bulk compression and shear of the polymer:
diameter = D
polymer in shear,
shear modulus = G
annular seal thickness =
Length =
resistance sensing element
II, ,*~ I* *'i gI I,, I * I -I pressure sensor
polymer cavity in bulk compression,
bulk modulus =K
initial volume = V
cross sectional area = a diameter = d
4T
Figure 2-9: Shown above are the zones of polymer in shear and
compression, with dimensions needed for the analytical model labeled. Displacement of the resistance sensing element, Ax, is positive for upward displacements.
The model can be used to calculate the deflection of the resistance sensing element for a given input force, as well as the pressure, P, inside the polymer cavity. The deflection is useful
for approximating the natural frequency, while knowing the pressure aids in selecting a pressure sensor with the appropriate pressure range. The model assumes that, for static equilibrium, F,, is balanced by a resulting shear force, FG and bulk compression force, FK:
Fin+ FG+ FK=
Assuming no slip between the resistance sensing element and the polymer, there will be a shear stress, T, and shear strain, y, and FG is:
2irrlG (Ax)
FG = -2rrlGy = -_______
t
Simple bulk compression is incorporated into the model, which assumes the polymer housing is rigid and completely sealed. The increase in pressure due to this bulk compression acts over area, a, and causes a change in volume of the polymer, d, yielding:
FK = (dV)Ka V where: dV = -(Ax)a so: FK= -(Ax)Ka 2 V
which results in:
21rrlG(Ax) (Ax)Kaz Fin= +
V
(3) (4) (5) (6) (7) (8)Equation 8 can be solved for Ax directly, or for the polymer cavity pressure by substituting:
M = (Ax)Ka (9)
~a ~ V
Even though this model wasn't entirely representative of the sensor, it is useful for understanding the relationship between deflection, polymer cavity pressure, and geometric parameters of the assembly. Prototypes were compared with each other based on this model and experimental results, which helped with setting the geometry of successive prototypes. In order to direct the majority of the snowpack signal to the pressure sensor, and therefore maximize the system's gain, special care was given to increase the ratio of polymer cavity pressure to the shear reaction in the polymer bearing. The final prototype was optimized across multiple geometric variables by trial and error, where one round of 4 slightly different prototypes was used hone in on dimensions. Based on those results, a batch of 10 more prototypes was made, which informed a final batch of 6 prototypes that were tested in the field and laboratory. From those 6, one design was chosen to incorporate into AvaTech's 2014 testing program. Shown below are pictures of several generations of the prototypes:
Figure 2-10: These two sensors were made with the help of Michael
Chuah from MIT's Biomimetic Robotics Lab. The black tape on the right sensor was used to funnel polymer into the cavity. Bolts were used for resistance sensing elements in these first prototypes.
Polymer
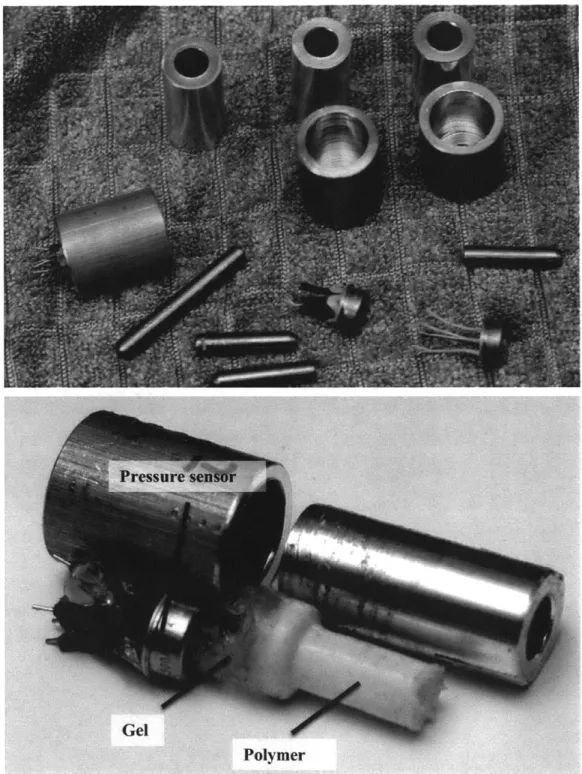
Figure 2-11, Top: Shown here are third generation prototypes that use a
pressure sensor made by Measurement Specialties. Bottom: This is a
disassembled sensor, which shows the early shape of the polymer cavity and polymer bearing. Gel with a low uncured viscosity was poured before polymer to
Figure 2-12, Top: These prototypes are the near final design used to
optimize across geometric variables. They were built into a brick of aluminum for easy assembly and transport, but could not be removed for testing in snow. Bottom: This is a close-up of the optimization assembly, which shows different tip and cavity geometries.
Figure 2-13, Top: These prototypes were built to test in snow in
Colorado, and served as the final round of sensors used to optimize geometry and polymer type. Bottom: Shown here is a close up of the six prototypes built for testing in snow. Two slightly different polymers were used, which had different durometers when cured (top row is black, bottom row is clear).
3. Experimental Evaluation of the Sensor Design 3.1 Force Range, Precision, and Dynamic Range
At low frequencies, the sensor can be modeled as a simple linear system where the output voltage equals the input force times a constant:
Vout = B * Fin
where B, the sensor calibration constant, is in units V/N. The sensor calibration constant can be determined experimentally by providing a low frequency, known input. A Vernier Dual Range Force Sensor was used to input a known force over eight load-unload cycles, and each signal was recorded using Vernier Logger Pro data acquisition software:
10 Input Force (N) 15 (10) 3 2 1 0 a, 0) 0 0 0 5
Figure 3-1: Eight low frequency (approximately 1 Hz) load-unload cycles
show some deviation from a linear model, and the final sensor's calibration constant, B= .191 V/N .007 V/N (95% confidence).
The resulting force range of the sensor is 18.1 N, which is 8% lower than the target specification (19.6 N), but acceptable for AvaTech's 2014 testing program. The Freescale pressure sensor was tested in an electronics lab, and showed only .2 mV of high frequency noise on a regulated power supply. Over the sensor's 2.5 V span, this yields a maximum possible dynamic range of 12,500. Unfortunately AvaTech has not finished the penetrometer's electronics yet, so the final noise magnitude (and therefore dynamic range) is unknown. AvaTech's lead electrical engineer is confident that noise will be under 5 mV, which would result in an acceptable dynamic range of 500.
An in depth analysis of overall sensor precision was done on a prototype several weeks before the final design was developed. This study was done to rigorously assess whether or not the polymer pressure sensor concept was worth further development that would lead to incorporation of the sensor in AvaTech's 2014 testing program. Ten load-unload cycles were conducted to determine the sensor's calibration constant, B:
10
Load-Unload Cycles
SI I 3-2---
linear fit
-
. .
increasing force
--
decreasing force
01I 0 5 10 15 20Input Force (N)
Figure 3-2: Ten loading-unloading cycles resulted in the above output,
with the linear fit showing that the near-final sensor's calibration constant, B=
.1635 V/N.
After calibration, the output voltage shown above was scaled to an output force based on the sensor calibration constant, B, obtained during calibration:
The resulting linear fit force residuals, R, were recorded to then determine the corresponding linear fit force error E%. Figure 3-3 illustrates the linear fit force residuals:
Load-Unload Cycle
10 20
Force In (N)
Figure 3-3: For a given output, i.e. 10 N, the linear fit force residual, RF,
is defined as indicated above. The sensor output is scaled from voltage to force for a direct comparison between the true input and the output obtained with the linear model. This is possible only if B is determined during calibration as shown in equation 11. 20 151
0
0 0 10 Unloading RF --- R---F---Fout data -- linear fit Loading51
( 0 IThe linear fit force error, E%, can then be defined as:
E%(Fout) = 100 * RF(FOUt)
Fout
which is targeted not to exceed 20%.
For the ten load-unload cycles shown in figure 3-2, the linear fit force residuals, RF, are plotted against the input force to illustrate where the system deviates most from the linear model:
Linear Fit Residuals
5 10 15
Linear Fit Residual PDF
0 C7 0 0 0. 20 -0.5 Input Force (N) 0
Input Force Residual (N)
Figure 3-4, Left: The linear fit force residual, RF, is plotted as a function of the input force for the near-final sensor. Green points indicate that the applied force was decreasing, while red points correspond to increasing input force. Right: The probability density function (PDF) of linear fit force residuals, RF, shows that decreasing force residuals (green) are predominately less than zero, while increasing force residuals (red) are more often greater than zero.
(12) 0.5 0 -0.5 **increasing force .* * decreasing force *~1 Oka...~ 71 W . -ot -fto-AMOM. . .. VWM'q ft% 0 .left VW~m ~ . . .a .~. - .,. . . 0 I-% . foc increasing force decreasing force .2-0 0.5 I
These data strongly suggest that the sensor imprecision is due to hysteresis. The dependence of the residual value on previous system state can be seen by the separation of residuals measured during increasing force vs. the residuals measured during decreasing force. Moreover, the hysteresis prevents the sensor from fully returning to zero, which causes the linear fit force error, E%, to approach infinity as the input force approaches zero:
% Error in Linear Model
300 2 0 f.14 0 0 0 10 0.01 0.1 10 100 Input Force (N)
Figure 3-5: The near-final sensor's linear fit force error, E%, becomes very large as the input force approaches zero. This is due to the fact that the residual, RF, magnitude stays relatively constant while the force corresponding to the residual becomes near zero.
The overall sensor error performs acceptably (E% < 20%) for forces above 4.2 N, but for
forces below 4.2 N, the near-final prototype tested does not meet target specifications (the final sensor's performance has improved over the near-final sensor; it remains within the target
. . .increasing force
decreasing force
0-I .
specification down to 2.8 N). This analysis highlights the difficulty of meeting the requirement that E% < 20% over a dynamic range of 400. Most transducers aren't rated using this parameter, and are instead rated for being precise within a certain percentage of the full-scale output (FSO) over the entire span. The majority of sensors are precise within between .25% FSO and 5% FSO, and cost scales directly with precision in most cases. Due to the logarithmic scaling used to interpret snowpack hardness, the E% parameter is appropriate because it demands greater precision for low hardness values than high ones. However, a target specification of E% < 20% may be unrealistic, because over a dynamic range of 400, it is equivalent to a precision of .05%
FSO when E% is measured at 1/4 0 0th of the full span:
100% (3
20% @ dynamic range of 400 = .2 * 400 = .05% FSO (13) 400
This suggests that the specification of E% < 20% may be unrealistic for almost any transducer with a dynamic range of 400, so care should be taken to determine exactly what precision specification is necessary for a representative profile. Alternatively, more testing could be done to understand how close the sensor is to showing a snow profile that provides value to avalanche safety investigations. To investigate this, a more realistic test was conducted, where a very accurate force sensor (Vernier Dual Range Force Sensor) was used to input a simulated snow profile into the final prototype of the AvaTech sensor. The two outputs were then plotted on the same axes to examine how the AvaTech sensor's imprecision manifests itself in a realistic use case:
Output Force (N) Input Force (N) Output Force (N) Input Force (N) 0 a IImIIm I 0 a uamaaa I CA, 0L c7~ 0 0 0 C,,
Figure 3-6, Top: The input force (purple) is plotted on log scale (vertical
axis only) against the calculated output force (orange) based on the linear model defined in equation 9. Bottom: This is the same simulation study, but plotted on a linear vertical axis. The sensor saturated during the highest input force (2.2 seconds into the test), which is seen by the flat line in the upper right of both graphs.
Here, the failure to meet the precision target specification appears as an underestimation of the hardness of very soft snow layers. This is far more preferable than overestimating the hardness of soft snow layers, because avalanche safety is concerned with abrupt changes in hardness, which are now slightly exaggerated. Consequently, the information collected by a penetrometer with this sensor is acceptable, because at worst, it will highlight an already existent danger in the snowpack.
3.2 Characterizing the Transient Response
With known low frequency performance, the sensor's transient response must be tested to quantify response time and overshoot. The sensor can be modeled as a lumped parameter underdamped second order system containing two springs, one mass, and one damper, where force is input from the snowpack, Fi, and output to the pressure sensor, F, :
Kb
Figure 3-7: The bearing spring constant, Kb, is affected by the shear
modulus of the polymer, as well as the exact dimensions of the polymer sheath bearing. The compressive spring constant, KE, is affected by the bulk modulus of the polymer and the volume of the pressure cavity. Some degree of internal damping is inherent to all materials under stress, so the model includes a damper with damping constant, C, in parallel with the two springs. The lumped mass considers the steel resistance sensing element, as well as the inertia of the polymer as it displaces due to shear and compression.
With Fj, being an impulse force, the output force as labeled in Figure 3-7, F,,,, is an exponentially decaying sinusoid:
Fout = Ae-Nnt * sin (wnt) (14)
where A is a constant dependent on the system gain and impulse magnitude. Four impulses were input to the force sensor by flicking it with a small titanium rod. Any tests showing multiple strikes were discarded, and the sensor's voltage output was recorded at 50 kHz in Logger Pro using the Vernier LabPro and accompanying Vernier Voltage Probe data acquisition system. In order to overcome dependency on imperfect impulses, the first period of oscillation was
discarded and an exponential sine fit (see equation 13) was computed in Logger Pro. The natural frequency, co = 10497 rad/s 92 rad/s, and the damping ratio, (= .43 .04 (uncertainty given for 95% confidence).
4. Conclusions
While snow penetrometers have the potential to increase the efficiency of snowpack measurement and allow safer navigation in avalanche terrain, their presence in the field depends
on the development of a low-cost, robust system that can fit into a backpack. Snow hardness is measured with a force sensor, but many traditional force-sensing technologies are expensive and
fall short of target specifications for cost, response time, package size, dynamic range, and weatherproofing. Numerous sensing concepts were researched, with the most promising options being thin film strain gauge based force sensors, and pressure sensors that incorporate an elastic polymer.
Many generations of the polymer based pressure sensor led to a transducer that closely fits the model of a linear second order system, and responds repeatably to dynamic tests and quasi-static precision tests with a damping ratio, ( = .43 + .04, natural frequency, o, = 10497 rad/s 92 rad/s, and E% < 20% for forces above 2.8 N. While the specifications for all of these
metrics don't meet their initial targets, the sensor exceeds expectations for cost, weatherproofing, and overload protection. Moreover, snowpack simulation tests suggest that the transducer will be suitable to obtain representative snowpack hardness profiles, and that the targeted precision values should be reconsidered once this sensor's capability has been further tested in AvaTech's 2014 testing program.
Bibliography
1 McCallum, Adrian. "Cone Penetration Testing in Polar Snow." Diss. University of Cambridge, 2012. Web. <https://www.repository.cam.ac.uk/handle/1810/244073>.
2 Lutz, Eric. "Snow Penetrometry and the SnowMicroPen." informal. AvaTech. Cambridge, MA.
15 Aug 2013. Address.
3 Schneebeli, Martin. MEASURING SNOW MICROSTRUCTURE AND HARDNESS USING A
HIGH RESOLUTION PENETROMETER. Swiss Federal Institute for Snow and
Avalanche Research, Web.
<http://www.patarnott.com/satsens/pdf/snowTextureMeasurement.pdf>.
4 Fassler, Matthias. Force Sensing Technologies. MS thesis. Swiss Federal Institute of
Technology Zurich, 2010. Web. <http://students.asl.ethz.ch/uplpdf/231 -report.pdf>.
5 Measurement Specialties. "Piezo Film Sensors." Technical Manual.
6 Young, Warren, and Richard Budynas. Roark's Formulasfor Stress and Strain. 7. New York:
McGraw Hill, 2002. Print.
7 Schott, C., Racz, R., Betschart, F., Popovic, R.S. "A new two-axis magnetic position sensor," Sensors,2002.ProceedingsoflEEE,2, 911- 915, 2002.
8
Blakemore, Andrea. The Design of a Hall Effect Force Sensing Flexure on the Front Leg of a
Robotic Cheetah. MS thesis. Massachusetts Institute of Technology, 2011. Print.
9 "LVDT: Introduction." eFunda.com. eFunda. Web. 22 Jan 2014.
<http://www.efunda.com/designstandards /sensors/lvdt/lvdtintro.cfm>.
10 "High Temperature Accuracy Integrated Silicon Pressure Sensor for Measuring Absolute
Pressure, On-Chip Signal Conditioned, Temperature Compensated and Calibrated." MPXA6400A MPXH6400A MPX HZ6400A Series.
11 Whittemore, Samuel, Jim Christian, and Brinton Markle. "METHODS, APPARATUS AND SYSTEMS FOR MEASURING SNOW STRUCTURE AND STABILITY." USPTO,