HAL Id: hal-03151096
https://hal.archives-ouvertes.fr/hal-03151096
Submitted on 31 May 2021
HAL is a multi-disciplinary open access
archive for the deposit and dissemination of
sci-entific research documents, whether they are
pub-lished or not. The documents may come from
teaching and research institutions in France or
abroad, or from public or private research centers.
L’archive ouverte pluridisciplinaire HAL, est
destinée au dépôt et à la diffusion de documents
scientifiques de niveau recherche, publiés ou non,
émanant des établissements d’enseignement et de
recherche français ou étrangers, des laboratoires
publics ou privés.
Distributed under a Creative Commons Attribution - NonCommercial| 4.0 International
Synaptic communication mediates the assembly of a
self-organizing circuit that controls reproduction
Matan Golan, J. Boulanger-Weill, A. Pinot, Pierre Fontanaud, Adèle
Faucherre, D. Gajbhiye, L. Hollander-Cohen, T. Fiordelisio-Coll, Agnès O
Martin, Patrice Mollard
To cite this version:
Matan Golan, J. Boulanger-Weill, A. Pinot, Pierre Fontanaud, Adèle Faucherre, et al.. Synaptic
communication mediates the assembly of a self-organizing circuit that controls reproduction. Science
Advances , American Association for the Advancement of Science (AAAS), 2021, 7 (8), pp.eabc8475.
�10.1126/sciadv.abc8475�. �hal-03151096�
N E U R O S C I E N C E
Synaptic communication mediates the assembly
of a self-organizing circuit that controls reproduction
M. Golan1,2*, J. Boulanger-Weill3, A. Pinot4, P. Fontanaud1,4, A. Faucherre1, D. S. Gajbhiye2,L. Hollander-Cohen5, T. Fiordelisio-Coll1,6, A. O. Martin1, P. Mollard1,4*
Migration of gonadotropin-releasing hormone (GnRH) neurons from their birthplace in the nasal placode to their hypothalamic destination is critical for vertebrate reproduction and species persistence. While their migration mode as individual GnRH neurons has been extensively studied, the role of GnRH-GnRH cell communication during migration remains largely unexplored. Here, we show in awake zebrafish larvae that migrating GnRH neu-rons pause at the nasal-forebrain junction and form clusters that act as interhemisphere neuronal ensembles. Within the ensembles, GnRH neurons create an isolated, spontaneously active circuit that is internally wired through monosynaptic glutamatergic synapses into which newborn GnRH neurons integrate before entering the brain. This initial phase of integration drives a phenotypic switch, which is essential for GnRH neurons to properly migrate toward their hypothalamic destination. Together, these experiments reveal a critical step for reproduc-tion, which depends on synaptic communication between migrating GnRH neurons.
INTRODUCTION
Neuronal migration is a critical process for brain development and function. One key example is the migration of the small population of gonadotropin-releasing hormone (GnRH) neurons, which are born in the nasal placode (NP) and migrate during embryonic devel-opment along the tract of the terminal nerve into their final location in the hypothalamus (1), a process that is conserved across all verte-brates (2). Since GnRH neurons are master regulators of reproduc-tion (3), defects in their migrareproduc-tion lead to reproductive dysfuncreproduc-tion and infertility, as observed in human patients with Kallmann syn-drome (1, 2). Correct guidance of GnRH neuron migration from the NP toward their final brain location is therefore critical for the propagation of the species.
During their initial stage of migration, GnRH neurons pause and form tight clusters at the cribriform plate, located at the boundary between the NP and brain. This pause has been observed in avians (4), rodents (5), and humans (6), yet its role and underlying pro-cesses remain unknown. A transitory pause and aggregation have also been reported in other migratory neuron populations at the interface between two extracellular environments (7–9). In neocor-tical and hippocampal migrating neurons, the pause has been shown to precede a phenotypic switch of the cell shape, speed, and mode of migration (7, 8) and is therefore considered a key stage that is re-quired for the transition into a new environment. However, the fac-tors that cause the cells to halt and drive the phenotypic switch remain poorly understood.
Among the signaling processes critical for neuronal migration, neuronal activity plays an important role (10, 11), in part, through downstream modulation of calcium concentrations (12, 13) that in-duce rearrangement of cytoskeletal elements (14). In addition to its direct role in the control of motility, neuronal activity also modu-lates gene expression (15, 16), thus providing a pathway by which external inputs can shape the molecular signature and hence the phenotype of neurons. Increased neuronal activity has been shown to induce transcriptional changes that act as a stop signal and lead to precocious maturation of migrating neurons (17, 18). The pause and compact organization of GnRH neurons at the nasal-forebrain junction (NFJ) prompted us to hypothesize that cell-cell communi-cation during the pause modulates GnRH neuronal activity, thus orchestrating a transition that allows GnRH cells to cross the cribri-form plate and make their way into the brain.
We therefore studied the behavior of GnRH neurons to gain insight into the processes that take place during the pause at the entrance to the brain. By using zebrafish as a vertebrate model, we performed longitudinal in vivo imaging studies of the migration of GnRH neurons in awake fish larvae along with real-time moni-toring of spontaneous calcium dynamics due to GnRH3 neuron excitability within their natural niche. We found that when NP- originating GnRH neurons locally colonize the brain border, they enter a 3-day pause in which they form an isolated circuit and
inter-act via N-methyl-d-aspartate (NMDA)–activated glutamatergic
synapses within two GnRH clusters, which are interconnected be-tween both hemispheres. Coordinated GnRH neuron activity ini-tially emerges from their synaptic connectivity. Following the pause, GnRH neurons undergo a marked morphological transition as they enter the brain. By manipulating their connectivity and activity, we show that establishment of a circuit-intrinsic process is critical for the ability of GnRH neurons to enter the brain toward their func-tional hypothalamic target.
RESULTS
In zebrafish, terminal nerve (TN) GnRH3 neurons are considered homologous to the hypophysiotropic GnRH1 neurons found in 1Institute of Functional Genomics, University of Montpellier, CNRS, INSERM, France.
2Institute of Animal Science, Agricultural Research Organization, P.O. Box 15159,
Rishon Letziyon, 7505101, Israel. 3Department of Molecular and Cellular Biology,
Center for Brain Science, Harvard University, Cambridge, MA, USA. 4BioCampus
Montpellier, University of Montpellier, CNRS, INSERM, F-34094 Montpellier, France.
5Department of Animal Sciences, The Robert H. Smith Faculty of Agriculture, Food,
and Environment, The Hebrew University of Jerusalem, Rehovot 76100, Israel.
6Laboratorio de Neuroendocrinología Comparada, Departamento de Ecología y
Recursos Naturales, Biología, Facultad de Ciencias, Universidad Nacional Autónoma de México, Ciudad Universitaria, 04510 México, DF, México.
*Corresponding author. Email: matan.golan@mail.huji.ac.il (M.G.) patrice.mollard@ igf.cnrs.fr (P.M.)
Copyright © 2021 The Authors, some rights reserved; exclusive licensee American Association for the Advancement of Science. No claim to original U.S. Government Works. Distributed under a Creative Commons Attribution NonCommercial License 4.0 (CC BY-NC). on May 31, 2021 http://advances.sciencemag.org/ Downloaded from
S C I E N C E A D V A N C E S
|
R E S E A R C H A R T I C L E
other vertebrates due to their birthplace in the NP (19), their migra-tory nature (20), and their hypophysiotropic projections (21). Func-tional homology is supported by the fact that GnRH3 neurons are key regulators of reproduction in zebrafish as evidenced by the re-productive dysfunction caused by the specific loss of these cells during development (22) or in adulthood (fig. S1). We therefore targeted GnRH3-expressing cells by using the zebrafish GnRH3 promoter (20) to drive expression of foreign proteins specifically in GnRH3 neurons (fig. S2, A and B).
The embryonic origin of the hypophysiotropic GnRH neurons in zebrafish has been under debate (23). While some groups have pointed to a hypothalamic origin (24, 25), others have identified the migratory population of GnRH3 neurons that are born in the NP as the one projecting toward the pituitary and controlling reproduction (19, 20). Some of the uncertainty may stem from early GnRH3 ex-pression in the hypothalamus where cell bodies are in close proximity to the pituitary, as can be observed in some transgenic lines (24). However, tracing the hypophysiotropic projections of GnRH3 neurons in the intact adult cleared brain (fig. S2, C to E) reveals that only the nasal-born, migratory GnRH3 subpopulations innervates the pituitary gland. Notably, it has been reported that GnRH3 knockout zebrafish remain fertile (26, 27). In these studies, GnRH3 knockout fish ex-hibited an increase of other reproductive neuropeptides in the brain that were thought to compensate for the loss of the GnRH3 peptide (28, 29). Ablation of GnRH3 neurons, either during development (22) or in adulthood (fig. S1), caused infertility in our fish experiments.
Migrating GnRH3 neurons make a 3-day pause at the entrance to the brain and undergo a marked morphological transition
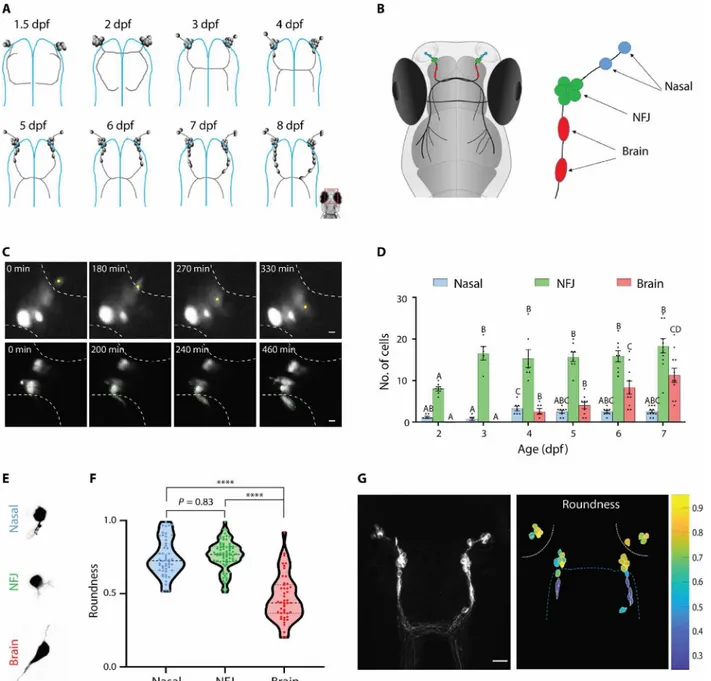
We first explored the real-time dynamics of GnRH3 neuronal mi-gration in vivo. In zebrafish, GnRH3 neurons are born in the NP at approximately 24 hours after fertilization and migrate to the brain along the axons of the TN during the course of development (Fig. 1A, fig. S3, and movie S1). We categorized the migrating GnRH3 popu-lation, according to their position, into three stages (Fig. 1B): (i) Na-sal GnRH cells are newborn neurons that are still located in the NP. These cells migrate toward the interface between the NP and the brain. Figure 1C (top) and movie S2 show an example of a mi-grating nasal GnRH cell. (ii) When GnRH3 cells reach the NFJ, they halt for several days and form a cluster-like aggregation. (iii) Brain GnRH cells have left the NFJ and entered the brain. Figure 1C (bot-tom) and movie S3 show an example of two migrating NFJ cells leaving the cluster. To follow the fate of the cells during several days, we expressed the photoconvertible protein Kaede in GnRH cells. Kaede can be converted from green to red using blue light (30). Photoconversion of kaede-expressing cells in the NFJ cluster at 3 days post fertilization (dpf) allowed us to follow their migration into the brain on subsequent days and provide further proof that brain GnRH cells originate from the NFJ cluster (fig. S4). Brain GnRH3 cells halt along their migration path, forming a continuum of cells from the NP to the hypothalamus (Fig. 1A), in a pattern that persists through to adulthood (fig. S2C and D). Starting at 3 dpf, the number of cells at the NFJ remains constant (16.5 ± 1.6 total NFJ cells,
n = 8), while the number of cells that have crossed into the brain
steadily increases, suggesting a constant flow of newborn cells into the system. Because GnRH3 neurons are born in the NP at ~1 dpf and first appear in the brain fraction at 4 dpf, we could establish that migrating GnRH neurons made an average pause of approximately
3 days at the NFJ before entering the brain (Fig. 1D), although we cannot rule out the possibility that some cells may have a longer or shorter residency at the NFJ. The existence of the NFJ cluster is transient and cannot be observed in mature fish (fig. S2C and D), indicating that most GnRH3 neurons (approximately 100 cells in the adult zebrafish) will finally make their way into the brain.
By measuring the morphometric parameters of cells in the dif-ferent compartments, we noticed that GnRH3 cells undergo a marked morphological transition upon entering the brain. The transition is evident in brain GnRH cells that exhibit an elongated shape that is markedly different from the largely circular shape of nasal or NFJ cells (Fig. 1, E to G). This morphological change takes place as the cells leave the NFJ (movie S3) and is retained in almost all the cells that have entered the brain.
Pausing GnRH3 cells form ensembles of co-active neurons
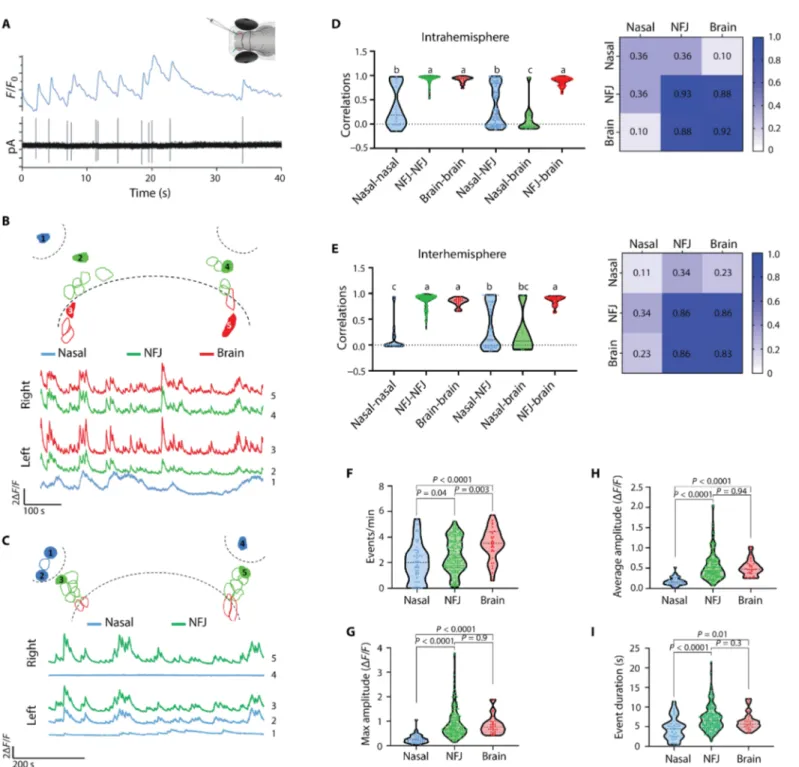
To study the behavior of GnRH3 neurons during their migration, we followed their spontaneous activity through in vivo calcium im-aging. Using two-photon microscopy, we imaged calcium dynamics in awake fish that express the genetically encoded calcium indicator GCaMP6s or R-CaMP2 in GnRH3 neurons [Tg(GnRH3:gal4ff; UAS:GcaMP6s) or Tg(GnRH3:R-CaMP2), respectively]. Sponta-neous calcium activity of GnRH3 neurons began at 2 dpf and was observed at least until 15 dpf (the latest stage tested in the current study). By combining in vivo calcium imaging and loose-patch re-cordings of NFJ GnRH3 neurons, we observed endogenous electri-cal events with each of them correlated with detectable electri-calcium transients (Fig. 2A), suggesting that monitoring calcium signals could be used as a reporter of electrical activity as reported for mammalian GnRH neurons (31). Comparing the calcium profile of cells in the different categories, we found that spontaneous calcium activity was highly synchronized within the GnRH3 population of both NFJ and brain but not nasal GnRH cells (Fig. 2, B and C; fig. S5; and movies S4 to S6). The high intra- and interhemisphere co-ordination persisted at least until 8 dpf (fig. S6).
Unexpectedly, calcium transients were highly synchronized not only between the cells of the same hemisphere, but also, to a slightly lesser degree, between the two hemispheres (Fig. 2, B and E, and fig S7A; intracluster correlation 0.93 ± 0.008 and 0.94 ± 0.006 in 3 and 6 dpf, respectively; intercluster correlation 0.86 ± 0.011 and 0.88 ± 0.01 in 3 and 6 dpf, respectively. n = 14 3-dfp fish and 15 6-dpf fish).
We then compared the level of coordination of cells in different positions along the migration pathway to generate a complete correla-tion matrix of the GnRH3 circuit. While brain GnRH neurons were highly synchronized with cells at the NFJ both within and between hemispheres, most nasal GnRH cells showed both a low cell-cell co-ordination within the NP and to GnRH cells at the NFJ or in the brain (Fig. 2, B to E; n = 55 nasal, 181 NFJ, and 31 brain GnRH neurons from 29 6-dpf fish. Also see fig. S5 and movies S4 to S6). In the cas-es where a nasal cell was coordinated with the NFJ cells (r > 0.5, 42.6% of cases), a neurite from the nasal cell could usually be ob-served projecting into the NFJ cluster (movie S7). Apart from their low level of coordination, nasal GnRH3 cells also exhibited a differ-ent calcium signature with slightly lower evdiffer-ent frequency, a mark-edly lower amplitude and a decreased transient duration. In addition, 14% of nasal GnRH cells were silent (n = 55 nasal, 181 NFJ, and 31 brain GnRH neurons from 29 6-dpf fish; Fig. 2, F to I, and fig. S7).
A morphological analysis of individual genetically labeled GnRH3 neurons (fig. S8) supports the existence of contralateral and ipsilateral
on May 31, 2021
http://advances.sciencemag.org/
projections within the GnRH3 circuit. Hence, our data suggest that new GnRH neurons migrating from the NP become coordinated with other GnRH neurons only when they contact NFJ GnRH neu-ronal clusters, while brain GnRH neurons remain coordinated with NFJ GnRH neurons.
The developing GnRH3 circuit is functionally isolated
To understand whether the observed coordination is a result of in-ternal connectivity, we used a combination of postsynaptic labeling, transsynaptic tracing, and functional calcium imaging. First, we fol-lowed the dendritic tree of GnRH neurons by sparsely transfecting
Fig. 1. Migrating GnRH neurons pause for 3 days at the entrance to the brain and change their morphology. (A) Schematic representation of the development of the zebrafish GnRH3 circuit during the first 8 days of development. Blue lines mark the boundary of the brain. (B) A schematic drawing of the migration path of GnRH3 neurons from the NP into the brain. An inset on the right describes the different location categories of the cells. (C) Snapshots from a 24-hour recording of a Tg(GnRH3: GFP) zebrafish larva showing the migration of a nasal GnRH cell (yellow dot, top) into the NFJ cluster and two NFJ GnRH cells (marked by green dashed lines, bottom) into the brain (see also movies S2 and S3, respectively). White dashed lines mark the border of the nasal (top) and brain (bottom) regions. Scale bars, 5 m. (D) Quantifi-cation of the migration process through the three different categories [n = 7, 5, 7, 8, 8, and 11 fish for 2 to 7 dpf, respectively. Comparisons between cell numbers per fish were made within categories using one-way analysis of variance (ANOVA), followed by Dunnett’s T3 multiple comparisons test. Different letters mark significantly differ-ent values (P < 0.05)]. (E) Typical cell morphologies of nasal (top), NFJ (middle), and brain (bottom) cells. (F) Quantification of the roundness of cells in the differdiffer-ent cate-gories (n = 52 nasal, 74 NFJ cells, and 47 brain cells; one-way ANOVA followed by Dunnett’s T3 multiple comparisons test) ****P < 0.0001. (G) An example of the morphological transition of GnRH3 cells. Left: A raw image of GnRH3 cells at 7 dpf [Tg(GnRH3:R-CaMP2)]. Scale bar, 20 m. Right: Individual cells traced and color-coded according to their roundness. White dashed lines mark the olfactory epithelium; blue dashed line marks the brain border.
on May 31, 2021
http://advances.sciencemag.org/
S C I E N C E A D V A N C E S
|
R E S E A R C H A R T I C L E
Fig. 2. Migrating GnRH3 neurons become functionally coordinated upon reaching the NFJ cluster. (A) Simultaneous calcium imaging [Tg(GnRH3:R-CaMP2)] and in vivo loose-patch recording of a GnRH3 neuron (3 dpf) reveal a strong correlation between electrical activity [picoamperes (pA), bottom trace] and calcium (top trace). (B and C) Example calcium traces of five cells from 6-dpf larvae (also see movies S4 and S5, respectively). Red traces are brain cells, green traces are NFJ cells, and blue traces are nasal cells. Top traces are cells on the right hemisphere; bottom traces are cells from the left hemisphere. A scheme above each trace depicts the imaged circuit, with dashed lines marking the nasal and brain borders. Numbered traces correspond to the cells marked in the scheme and in fig. S5 (A and B). Bars: 2F/F, 100 (B) or 200 s (C). (D) Left: Pairwise Pearson’s correlation of calcium traces from nasal, NFJ, and brain cells within the same hemisphere. Different letters indicate significantly different means (n = 55 nasal cells, 181 NFJ cells, and 31 brain cells from 15 6-dpf fish; one-way ANOVA followed by Dunnett’s T3 multiple comparisons test). Right: A correlation matrix of intrahemisphere correlations. Numbers indicate mean correlation value. (E) Interhemisphere correlations. Details as in (D). (F to I) Calcium activity parameters of nasal, NFJ, and brain GnRH neurons at 6 dpf. Statistics as in (D).
on May 31, 2021
http://advances.sciencemag.org/
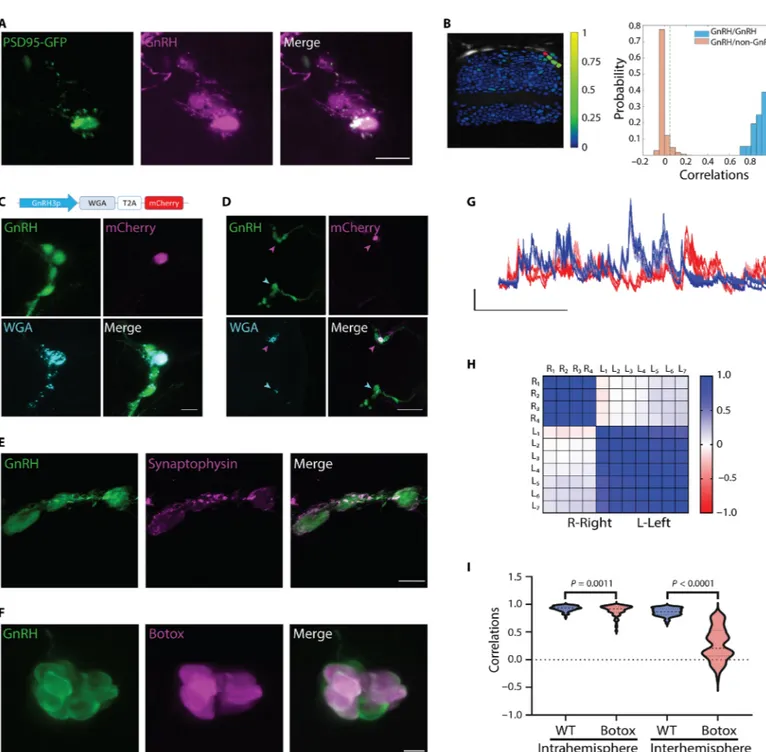
GnRH3 neurons with the postsynaptic density protein 95 (PSD-95) fused to green fluorescent protein (GFP) to label active postsynaptic sites (32). Although clustered NFJ GnRH3 neurons send long and branched projections into the brain (fig. S8), PSD-95 distribution was limited to a small area of the soma and to a short neurite that is usually contained within the NFJ cluster (Fig. 3A), implying an internal source of input. To identify possible synaptic partners, we expressed the transsynaptic tracer wheat germ agglutinin (WGA) (33) and GFP specifically in GnRH3 neurons [Tg(GnRH3:gal4ff; UAS:AcGFP- T2A-WGA)]. However, WGA staining was not found outside of the GnRH3 circuit in young (7 dpf) fish, suggesting the lack of func-tional communication between GnRH and non-GnRH cells at this developmental stage (fig. S9A). At the age of 14 dpf, a time when the first GnRH3 neurons send projections to the pituitary (21), we begin to observe WGA staining on non-GnRH cells within the olfactory lobes (fig. S9B) and in the subpallium, around the anterior commis-sure (fig. S9C). This pattern becomes more pronounced at later stages (fig. S9D). To further explore whether the circuit of migrat-ing GnRH neurons is functionally connected with non-GnRH neu-rons, we performed two-photon calcium imaging of large neuronal populations (expressing GCaMP5G under the control of the pan- neuronal HuC promoter) while simultaneously monitoring the ac-tivity of the NFJ and brain GnRH3 neurons (labeled red by R-CaMP2) at 6 to 8 dpf. Mapping the correlation levels onto the anatomical maps of the brain revealed a high level of coordinated activity be-tween NFJ and brain GnRH neurons compared to non-GnRH cells (Fig. 3B), which suggests that both NFJ clusters and brain GnRH neurons function during the first stages of development as an isolated, autonomous circuit of interconnected GnRH neurons.
GnRH3 neurons communicate synaptically through glutamatergic activation of NMDA receptors
We explored the nature of the connectivity between GnRH3 neurons by sparsely transfecting GnRH3 neurons with a bicistronic construct driving the expression of the transsynaptic tracer WGA (33) and mCherry (GnRH3:WGA-T2A-mCherry). Transfection of single cells, marked by the expression of mCherry, caused all the cells within the ipsilateral hemisphere to stain positive for WGA at 7 dpf (Fig. 3C). Moreover, transfection of single cells in one hemisphere also caused WGA transfer to cells in the contralateral hemisphere (Fig. 3D), in-dicating that GnRH3 cells both within and between the two hemi-spheres are connected by chemical synapses. The synaptic nature of the connectivity between GnRH neurons was further supported by immunohistochemical staining of GnRH3 varicosities juxtaposed onto other GnRH3 cells by the presynaptic marker synaptophysin (Fig. 3E and fig. S10). To specifically block synaptic transmission between GnRH3 neurons, we generated a transgenic line expressing botulinum toxin (botox) light chain in GnRH3 neurons [Tg(GnRH3:gal4ff; UAS:Botox)]. In this line, botox expression could be detected in 52.70 ± 7% of GnRH neurons (Fig. 3F). Calcium imaging of NFJ GnRH neurons in these fish showed a sharp decrease in coordina-tion between the two hemispheres and a slight decrease in the intra-hemisphere coordination levels (Fig. 3, G to I; n = 7 wild-type fish and 9 botox fish). This suggests that the low percentage of botox- expressing cells was not enough to completely block intrahemisphere communication between NFJ GnRH neurons but was sufficient to uncouple the weaker connection between the two hemispheres. Together, these results suggest that the coordination between GnRH neurons is driven through internal chemical synapses.
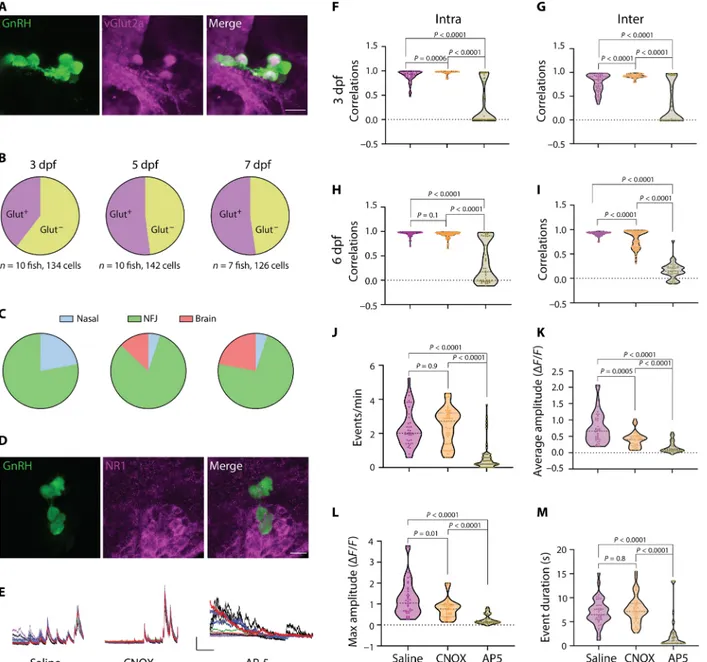
Since GABAergic and glutamatergic signaling have been report-ed in migrating GnRH neurons (5, 34), we crossreport-ed Tg(GnRH3:GFP) fish to fish expressing DsRed under the gad1b or the Vglut2A promoters to identify the neurotransmitter by which GnRH3 neu-rons communicate. We found no colabeling of gad1b in NFJ GnRH3 neurons nor did the -aminobutyric acid type A receptor antagonist picrotoxin affect their coordinated calcium activity (fig. S11). In contrast, GnRH3 neurons were found to express Vglut2A in 39 to 53% of the cells (Fig. 4, A to C, and fig. S12) as well as the NMDA receptor subunits NR1 and NR2D (Fig. 4D and fig. S13). NMDA receptors usually require an initial depolarizing step, pro-vided by AMPA receptors, to dislodge the magnesium ion from the channel. However, NMDA receptors that contain the NR2D sub-unit can operate at resting potential and therefore do not require this initial depolarization step (35, 36). To explore the functional role of the glutamatergic communication, we injected either the AMPA receptor antagonist 6-cyano-7-nitroquinoxaline-2,3-dione (CNQX) or the NMDA receptor antagonist 2-amino-5-phosphonopentanoic acid (AP-5) into the circulation of 3- or 6-dpf larvae and recorded calcium activity using GCaMP6s (Fig. 4E). CNQX slightly increased intra- and interhemisphere communication at 3 dpf (Fig. 4, F and G) and slightly decreased interhemisphere correlation levels at 6 dpf (Fig. 4, H and I). By contrast, injection of AP-5 had a profound effect on cell-cell communication between GnRH3 neurons (Fig. 4E), markedly decreasing both the intra- and interhemisphere coordina-tion levels (P < 0.0001; Fig. 4, F to I) at both ages (3 dpf: n = 6, 6, and 8 fish for saline, CNQX, and AP-5, respectively; 6 dpf: n = 7 fish for all treatments). The AP-5 treatment also significantly dampened the fre-quency, amplitude, and duration of calcium transients and complete-ly silenced 19 and 35% of the cells at 3 and 6 dpf, respectivecomplete-ly (Fig 4, J to M, and fig. S14). Notably, AP-5 treatment could suppress syn-chronized calcium transient firing in NFJ neurons, while it failed to alter asynchronous calcium signals in nasal cells (fig. S14). Together, these results suggest that both the initiation of neuronal firing and neuronal synchronization and the digital and amplitude coding of calcium transients within the circuit of NFJ GnRH neurons depend on glutamatergic activation of postsynaptic NMDA receptors.
GnRH3 neurons are reciprocally wired between the two NFJ clusters
The drastic effect of NMDA blockers on both the coupling of NFJ GnRH neurons and their calcium activity (Fig. 4, E to M) suggested to us that the two aspects were intermingled. Spontaneous activity as an emergent property of a network was already reported in other developing neurons where coincident integration of excitatory syn-aptic inputs initiates spike firing in randomly distributed neurons which then propagates throughout the population [so-called integrate- and-fire cell model (37–39)]. Such systems require strong reciprocal connections between the cells (40). Optogenetic control of mem-brane excitability in distinct neurons allowed us to probe the con-nectivity patterns in clusters of NFJ GnRH neurons in which light activation of depolarizing opsins was used to mimic coincident excitatory inputs. We therefore optogenetically stimulated single channelrhodopsin2 (ChR2)–expressing NFJ GnRH3 neurons using two-photon microscopy while recording the calcium response of neighboring cells using R-CaMP2 at 3 and 7 dpf (Fig. 5, A and B). Four stimulation events were applied in 30-s intervals. At the ipsilateral (ipsi) hemisphere level, sequential ChR2-driven depolarization of distinct NFJ GnRH neurons (71% of stimulated neurons) leads to neuron
on May 31, 2021
http://advances.sciencemag.org/
S C I E N C E A D V A N C E S
|
R E S E A R C H A R T I C L E
Fig. 3. GnRH3 neurons are functionally isolated and synaptically wired. (A) An example of the short dendritic tree of a single GnRH3 neuron marked by GFP-PSD95 (green), contained within the GnRH3 circuit (magenta). Scale bar, 10 m. (B) Left: Example activity correlation map of developing NFJ and brain GnRH neurons (7 dpf, circled in magenta) with other neurons of the telencephalon. Recording was performed on Tg(HuC:GCaMP5G) larvae that expressed GCaMP5G in all neurons. Right: Correlation distributions of GnRH neurons versus other GnRH neurons (blue) or versus non-GnRH neurons (brown). The null-model derived threshold (fig. S20) is depicted as a green dashed line (n = 5 fish, 6 to 8 dpf). (C) Sparse labeling of a 7-dpf Tg(GnRH3:GFP) fish (green) with GnRH3:WGA-T2A-mCherry construct results in transfection of a single neuron (magenta). WGA (cyan) can be observed in all other cells within the hemisphere. Scale bar, 10 m. A scheme of the construct used for sparse labeling. (D) Transfection of a single cell on the right hemisphere (magenta arrowheads) resulted in WGA transfer to the contralateral side (cyan arrowheads). Scale bar, 50 m. (E) Immunostaining of synaptophysin (magenta) shows GnRH3 neurons (green) forming multiple synapses upon each other. Scale bar, 10 m. (F) Expression of botox (magenta) in GnRH neurons (green). Note that not all GnRH cells express botox. Scale bar, 10 m. (G) Calcium traces recorded from GnRH neurons of a 3-dpf botox-positive larva show uncoupling of activity between the left (red traces) and right (blue traces) hemispheres. Bars: F/F, 200 s. (H) Correlation matrix of the cells from the same fish in (G). (I) Quantification of correlation of NFJ cells from botox and control fish shows a slight reduction in correlation within clusters and a sharp decrease in correla-tion between the two hemispheres (n = 7 wild-type fish and 9 botox fish, unpaired t test with Welch’s correccorrela-tion). WT, wild type.
on May 31, 2021
http://advances.sciencemag.org/
activation and coordinated calcium transients with GnRH neigh-bors (Fig. 5A, n = 35). Moreover, we observed no directionality in the activation patterns of the cells, suggesting that calcium tran-sients can be elicited from multiple neuronal entities within NFJ clusters. The two contralateral hemispheres were also reciprocally responsive to stimulation, although responses in the contralateral hemisphere were recorded only in 26% of the cases (Fig. 5B, n = 19), reflecting a lower strength of synaptic connectivity between the hemispheres than within a hemisphere (Fig. 3, F to I), probably re-sulting from the scarcity of intercluster projections (only 7%; fig.
S8). Electrical stimulation of GnRH3 neurons reproduced the re-sponses observed with photostimulation (fig. S15, n = 4 fish). Hence, these data strengthen the proposal that depolarizing events due to coincident glutamatergic inputs could lead to spike initiation that propagates throughout the GnRH circuit to generate synchro-nized calcium transients (schematized in Fig. 5, C and D).
To further address the importance of the interhemisphere con-nectivity, we laser ablated the NFJ cluster of one hemisphere while monitoring calcium signals in GnRH neurons of the contralateral hemisphere. Acute ablations caused a cessation of calcium activity
Fig. 4. Developing GnRH3 neurons communicate through glutamatergic transmission. (A) Crossing Tg(GnRH3:GFP) and Tg(vGlut2a:DsRed) fish reveals coexpression of vGlut2a in NFJ GnRH3 cells (7 dpf). Scale bar, 10 m. (B) Quantification of the percentage of DsRed-positive GnRH3 neurons for each age (n numbers are given on the figure). (C) The distribution of DsRed-positive GnRH3 cells within the different migration categories for each age. (D) Colocalization of NMDA receptor NR1 on GnRH neurons (3 dpf). Scale bar, 10 m. (E) Example calcium traces obtained from 6-dpf larva injected with saline, CNQX, or AP-5. Bars: 2ΔF/F0, 50 s. (F to I) Comparison of intra- (F and H)
and interhemisphere (G and I) pairwise Pearson’s correlations of the different treatments at 3 (F and G) and 6 (H and I) dpf (3 dpf: n = 39, 45, and 58 cells from = 6, 6, and 8 fish for saline, CNQX, and AP-5, respectively; 6 dpf: n = 52, 64, and 50 cells from 7 fish for each treatment; one-way ANOVA followed by Dunnett’s T3 multiple comparisons test). (J to M) Comparison of calcium activity parameters from 3-dpf larvae (n = 39, 45, and 58 cells from = 6, 6, and 8 fish for saline, CNQX, and AP-5, respectively).
on May 31, 2021
http://advances.sciencemag.org/
S C I E N C E A D V A N C E S
|
R E S E A R C H A R T I C L E
in the non-ablated NFJ cluster (fig. S16, A to C), further suggesting a role of interhemisphere synaptic connection in the connectivity and activity of NFJ GnRH cells. Such a loss of activity upon an acute disruption of a connection was reported in other self-organizing neural circuits (41, 42) and further underscores the codependence of connectivity and activity (see schema in Fig. 5, C and D). Howev-er, after 24 hours of recovery, non-ablated NFJ and brain GnRH
neurons resumed synchronized calcium transient activity (fig. S16, D to F; n = 10 fish ablated on each side), which was likely due to a rewiring of the non-ablated GnRH synaptic network (41, 42). Together, the reciprocal connection between the two hemispheres, as well as the ability of brain GnRH neurons to retain their activity when one NFJ cluster is ablated, suggests a significant participation of interhemisphere synaptic connection in the function of the
Fig. 5. GnRH3 neurons are reciprocally wired. (A) Left: Calcium transients, shown as z-scores, recorded during optogenetic stimulation of GnRH3 cells. Photostimulation events were applied every 30 s and are marked by dashed lines. Blue arrows indicate successful stimulation events (2 over previous 15 frames). Individual optogenetic stimulation of any of the three cells within the NFJ clusters elicits calcium responses in the other two cells. The three recordings were performed on the same fish (3 dpf). Lightning marks on the left side of each plot show which a cell was stimulated. Right: Percentages of successful and nonsuccessful intracluster stimulations of 3 and 6 dpf fish. (B) Left: Bidirectional activation of the contralateral cluster by optogenetic stimulation. Both recordings were done on the same fish (3 dpf). Lightning marks on the left describe which of the two sides was stimulated. Right: Percentages of successful and nonsuccessful intercluster stimulations of 3 and 6 dpf fish. (C) Schematic repre-sentation of wiring patterns (illustrated by arrows) within a hemisphere and inputs from the contralateral hemisphere (long horizontal arrow). Activity is driven by the glutamatergic cells (surrounded by blue rings). Calcium traces represent robust coordinated activity that is initiated by one glutamatergic neuron and is then propagated throughout the system. (D) Connectivity is reduced during the application of the NMDA receptor blocker AP-5, causing silencing or dampened calcium activity of GnRH cells.
on May 31, 2021
http://advances.sciencemag.org/
developing GnRH neuron circuit and highlights the plasticity and robustness of the circuit.
Circuit-intrinsic control of GnRH neuron migration
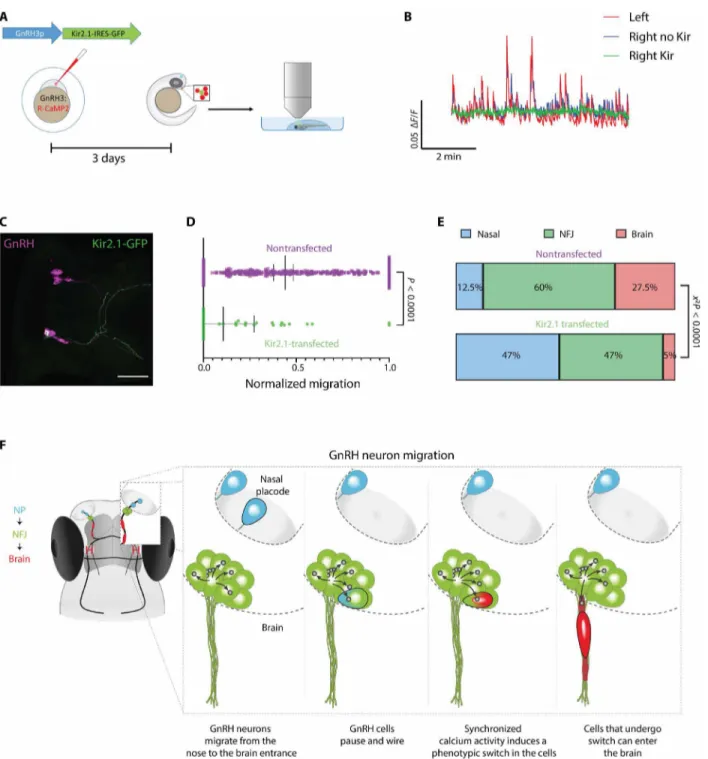
Last, we explored the functional role of neuronal activity and inter-connectivity on the migration of zebrafish GnRH3 neurons. Since GnRH neural activity is an emergent property of the network, we sought to simulate the activity-dampening effects of reduced con-nectivity in individual GnRH neurons and test the effect on their migration. To silence the cells, we sparsely expressed the inward- rectifying potassium channel Kir2.1 in GnRH3 neurons (Fig. 6A). Kir2.1 hyperpolarizes the cells, hence effectively silencing them (43). Calcium imaging confirmed effective silencing of Kir2.1-expressing cells while not affecting the activity of the nontransfected GnRH3 cells (Fig. 6B). Quantifying the migration after 7 days (Fig. 6C), we found that Kir2.1-expressing cells traveled a significantly shorter distance than their nontransfected counterparts, resulting in a skewed distribution along the migration path and a significantly lower number of cells entering the brain (35 transfected and 335 nontransfected cells from 22 fish; Kolmogorov-Smirnov test,
P < 0.0001; Fig. 6, D and E). These results indicate that the ability of
GnRH neurons to enter the brain depends on their electrical inte-gration into the NFJ clusters. Conversely, overexpression of a mu-tant, nonactive Kir2.1, did not affect migration (27 transfected and 180 nontransfected cells from 13 fish; Kolmogorov-Smirnov test,
P = 0.97; fig. S17). To perturb GnRH3 connectivity, we blocked
NMDA-mediated glutamatergic transmission using the NMDA an-tagonist MK-801. Since MK-801 can cross the blood-brain barrier, it can be applied in the rearing medium of the fish. MK-801 (50 M for 3 hours) decreased the coordination of calcium transients of GnRH3 neurons (fig. S18). When applied between 3 and 6 dpf, MK-801 caused a significant decrease in the number of GnRH cells entering the brain (fig. S18; n = 19, 16, 11, and 11 fish per treatment for 0, 20, 50, and 200 M, respectively). While the developing GnRH circuit is functionally isolated at these stages, we cannot rule out the possi-bility that part of the effects may be attributed to global effects of the prolonged drug treatments. Together, these results suggest that the connectivity-dependent activity of GnRH3 neurons is necessary for the cells to acquire the ability to leave the NFJ and enter the brain.
DISCUSSION
By combining live-imaging of migrating GnRH3 neurons in awake fish larvae together with monitoring and manipulating the dynam-ics of their calcium signals, we developed an approach to decipher why GnRH3 neurons pause at the entrance to the brain. A shift in the morphology of GnRH3 neurons upon entering the brain marks the pause as an important transition period for the cells. Our data suggest that connectivity and synchronized firing of NFJ GnRH neurons during the migrational pause drive the morphological transition of GnRH neurons that will leave the NFJ cluster. As GnRH3 cells pause at the entrance to the brain, they form intercon-nections between clusters located at the base of both hemispheres. These two NFJ GnRH clusters communicate via homotypic NMDA- driven synaptic contacts leading to both the emergence and propaga-tion of within-populapropaga-tion co-active, high-amplitude calcium transients that are scaled at the interhemisphere level with functional connec-tion with migrating brain GnRH neurons on both ipsi- and contra-lateral sides. Ultimately, the coordinated spontaneous activity acts
as a gatekeeper by mediating a critical transition in GnRH neurons, which enables them to enter the brain and migrate toward their hypothalamic destination (summarized in Fig. 6F).
The pause in migration and clustering of GnRH neurons at the cribriform plate were described in several tetrapods (4, 5, 44), yet without the in vivo context, the function of these neuron clusters remained unknown (45). Our live imaging approach reveals that the sojourn of GnRH neurons at the “waiting compartment” is accompanied by an emergence of synchronized, high-amplitude calcium transients. Blocking these transients by silencing the cells prevents them from going through the necessary transition that is required for entering the brain. In this context, it has been previously shown that calcium influx through NMDA receptors forms an im-portant bridge between the subsecond time scale of neural activity and the hours-long migration process by activating posttranslational modifications of proteins and affecting mRNA transcription (16, 46). Neuronal excitability and the ensuing fast calcium spikes have been reported to cause transcriptional modifications leading to morpho-logical changes and migration arrest (17, 18). In GnRH neurons, NMDA receptor signaling to the nucleus through the NSMF gene (47) is a possible candidate for linking neural activity and migration since mutations in this gene are implicated in GnRH migration de-fects and infertility in humans (48, 49). Moreover, coordinated ac-tivity of GnRH cells has been observed in mammalian GnRH cell lines as well as in organotypic cell cultures (50, 51), suggesting that coordinated calcium activity exists in migrating GnRH neurons of higher vertebrates and may be relevant for their migration (14). Al-though the full molecular details of the maturation process that GnRH cells undergo during their phenotypic switch remain un-known, we hypothesize that their connectivity and cooperativity may match with the combinatorial expression of guidance mole-cules that direct GnRH migration and ultimately underlie the deci-sion of individual cells to break away from the NFJ clusters.
Our discovery that the synchronized activity is mediated through chemical synaptic transmission is surprising since synaptogenesis is believed to take place only after migration is over, and the effects of neurotransmitters on migration (10, 11) are thought to be mediated through extrasynaptic receptors in a paracrine fashion (52). Yet re-cently, subplate neurons were shown to use transient chemical glu-tamatergic synapses to facilitate the multipolar-to-bipolar transition of migrating neocortical neurons (8). As in the case of the zebrafish GnRH3 neurons, subplate neurons use postsynaptic NMDA recep-tors to mediate the communication and drive the morphological transition (8). However, unlike subplate neurons, zebrafish GnRH3 neurons exert control over their own migration in a cell-autonomous manner. This cooperative and internal control of neuronal migra-tion supplements the tradimigra-tional view according to which migramigra-tion is mostly a consequence of the interplay between individual GnRH cells and external cues, which include adhesion molecules, growth factors, and neurotransmitters. By driving the phenotypic switch of GnRH neurons, the activity-dependent regulation of migration grants the developing circuit control over its own assembly. Therefore, its internal wiring patterns, synchronized activity, and functional iso-lation during the initial stages of the circuit assembly make the mi-grating GnRH3 system a bona fide self-organizing circuit.
We demonstrate that co-activity within the GnRH circuit de-pends on excitatory inputs, which emanate from multiple neuronal entities within the NFJ GnRH clusters. The almost complete cessa-tion of activity upon blocking postsynaptic transmission suggests
on May 31, 2021
http://advances.sciencemag.org/
S C I E N C E A D V A N C E S
|
R E S E A R C H A R T I C L E
Fig. 6. Control of GnRH neuron migration by their excitability. (A) Scheme of silencing strategy: Individual GnRH3 neurons were silenced by sparse expression of Kir2.1, followed by calcium imaging and quantification of migration. (B) Calcium imaging of a Kir2.1-overexpressing neuron (green) within the GnRH3 circuit (blue and red traces are nontransfected cells) at 3 dpf shows effective silencing of the Kir2.1-expressing cell. (C) A Kir2.1-transfected neuron (green) within the GnRH circuit (magenta) at 7 dpf. Scale bar, 50 m. (D) At 7 dpf, overexpression of Kir2.1 significantly reduces the distance migrated by GnRH3 cells (n = 35 transfected and 335 nontransfected cells from 22 fish; Mann-Whitney test, P < 0.0001; distance was normalized to maximal distance migrated by a GnRH cell in the same fish) and skews their distribution along the migration pathway (Kolmogorov- Smirnov test, P < 0.0001). (E) Relative frequency of Kir2.1-overexpressing cells and nontransfected cells within the three cell categories at 7 dpf. Kir2.1-overexpressing cells are less likely to become brain cells. Similarly, less Kir2.1-overexpressing nasal cells integrate the NFJ clusters [n numbers as in (D). 2 test
of distributions]. (F) A graphical model illustrating the migration of a single GnRH3 neuron (marked by black border) from the NP into the zebrafish brain. Nasal, NFJ, and brain GnRH neurons are pseudo-colored in blue, green, and red, respectively. The blue-green and green-red color codes illustrate the transition of the single GnRH3 neuron (marked by black border) as it becomes synaptically connected with other NFJ neurons (arrows, neurite connection; dot, glutamatergic synapse) and changes its morphology before leaving the NFJ cluster, respectively.
on May 31, 2021
http://advances.sciencemag.org/
that synaptic connection is at the core of localized spike initiation. The synaptic-dependent emergence of spontaneous and coordinated activity is a hallmark of developing neural networks. In these networks, there is no real need for pacemaker/leader neurons to drive the rest of the population as followers (37–39). We therefore propose that synaptic glutamatergic connections generate sub-threshold noise, which is accumulated and integrated to trigger a randomly localized cell, which then propagates toward neighboring GnRH neurons (37). In such “integrate-and-fire” networks, activity and coordination are difficult to dissociate, as synaptic connectivity is both necessary and sufficient to allow the emergence of sponta-neous synchronized activity (38, 39).
An added feature of such a reciprocal network structure with multiple activity drivers is increased robustness and redundancy since elimination of a single GnRH neuron, or even several neuro-nal entities, will not significantly affect the function of the system. This illustrates the robustness of the GnRH circuit, which is strong-ly internalstrong-ly wired and does not get interference from other neuron neighbors in the developing brain. Such a high level of robustness is likely necessary for a system that is responsible for the propagation of the species. Mammalian studies have shown that animals remain fertile even after a loss of up to 88 to 66% of GnRH neurons (53), suggesting an exceptionally high level of redundancy and robust-ness within the GnRH circuit. Our study reveals a similar trend during GnRH neuron development.
Together, our data unveil an interhemisphere, circuit-intrinsic control of GnRH neuron migration where synaptically driven syn-chronized activity mediates a phenotypic switch, which is mandato-ry for proper migration toward their final hypothalamic destination. We propose an updated model for GnRH neuronal migration, crit-ical for vertebrate reproduction and species survival, in which GnRH neurons function as a population rather than as individual units. By implementing recently reported methods of regionally specified human pluripotent stem cell–derived organoids (54), our findings provide a previously unidentified template for exploring the underlying forces controlling the assembly of the human GnRH circuit in health and disease.
MATERIALS AND METHODS
Experimental design
The aim of the current study was to investigate the role of cell-cell communication in the regulation of GnRH neuronal migration. To that end, we adopted a transgenic zebrafish model that uses the ze-brafish GnRH3 promoter to drive expression of foreign proteins specifically in GnRH3 cells. Our work was based mostly on non-invasive in vivo imaging of intact fish larvae using two-photon micros-copy. Zebrafish were chosen because of their external development, transparency, small size, and rich transgenic toolbox that make them particularly attractive for in vivo imaging of developmental processes. Part of the experiments were conducted on stable trans-genic lines, whereas others used sparse labeling of individual GnRH3 neurons or the combination of the two. All experiments were per-formed on larvae between 1 and 7 dpf, before the onset of external feeding. To increase larval transparency and to avoid the need to inhibit pigment formation by pharmacological means, all experi-ments were performed on nacre (mitfa−/−) background that lack melanocytes. Since work was conducted on larvae, sex cannot be de-termined for the subjects. Age of larvae is specified for each experiment
in the manuscript. Experimental units throughout the study were either individual larvae or GnRH cells, dependent on the particular experiment.
Sample size and replication
Since this was our first attempt at recording spontaneous calcium activity in zebrafish GnRH3 neurons, we relied on preliminary experiments to characterize the system and determine the correct sample size. For calcium imaging experiments, five fish were chosen as the minimum number of replicates used for analysis, and sample size was determined according to the number of GnRH cells in these fish. GnRH cells within a fish showed high uniformity in their activity patterns.
Data inclusion/exclusion criteria
Larvae were excluded from analysis if the fish showed no sponta-neous calcium activity (usually less than 5% of larvae tested) or if fish movements during the full recording session prevented reliable calcium readout. Data or samples were not excluded from analysis for other reasons.
All replication attempts were successful. Calcium patterns, num-ber and shape of cells, and treatment effects were consistent across the study period. For optogenetic stimulation, the percentages of successful versus nonsuccessful stimulation attempts are depicted in Fig. 5.
Randomization
Fish used for the experiments were randomly selected and randomly assigned to experimental groups. All GnRH cells that could be de-tected in the selected fish were used for analysis, and thus, there was no requirement for randomization of cell selection.
Blinding
During experimentation and data acquisition, blinding was not purposely introduced into the work scheme as a mean to ensure correct tractability of the samples. Quantifications of calcium data were performed using a computational pipeline applied equally to all samples.
Animals
All experiments were approved by the Animal Welfare and Ethical Review Body of Languedoc-Roussillon (APAFIS#745-2015060114396791 v3). Zebrafish were housed according to standard conditions. Fertilized eggs were incubated at 28.5°C in E3 medium. Transgenic lines generated for the current study are Tg(GnRH3:GFP), Tg(GnRH3:R-CaMP2), Tg(GnRH3:gal4ff), Tg(UAS:Botox), and Tg(GnRH3:ChR2-YPF). Transgenic line generation was described elsewhere (55). Other lines used were Tg(VGlut2A:DsRed), Tg(Gad1B:DsRed), Tg(UAS:Kaede), and Tg(HuC:GCaMP5G) (56). Line Tg(UAS:AcGFP-T2A-WGA) (57) was a gift from Y. Yoshihara (RIKEN Brain Science Institute, Japan). Line Tg(UAS:GCaMP6s) (58) was a gift from H. Baier (Max Planck institute of Neurobiology, Germany). Line Tg(UAS:NTR- mCherry) was a gift from G. Lutfalla (University of Montpellier, France).
Plasmid construction
All expression plasmids were generated using the Tol2kit (21) and Gateway system (Invitrogen). Briefly, entry clones were generated by addition of appropriate adaptors to DNA fragments via poly-merase chain reaction (PCR) amplification. Amplicons were then recombined into donor vectors using BP recombination. A 5′-entry clone (p5E), a middle entry clone (pME), and a 3′-entry clone (p3E) were then recombined through an LR reaction into an expression
on May 31, 2021
http://advances.sciencemag.org/
S C I E N C E A D V A N C E S
|
R E S E A R C H A R T I C L E
vector carrying tol2-recognition sequences and either an mCherry or a GFP heart marker. The GnRH3 promoter (20) was cloned from zebrafish genomic DNA and inserted into pDONRP4-P1R to generate p5′-GnRH3. R-CaMP2 (59) was a gift from H. Bito (University of Tokyo) and was cloned into pDONR221 to generate pME-R-CaMP2. The BoTxBLC open reading frame (ORF) was cloned from genomic DNA of BoTxBLC-GFP (60), a gift from C. Wyart (Institut du Cerveau, Paris, France), and inserted into pDONR221 to generate pME-botox. Codon-optimized Gal4ff was cloned from Gal4ff.zf1, plasmid number 61392, a gift from H. Burgess (61), and inserted into pDONR221 to generate pME-gal4ff. The Kir2.1 ORF was cloned from mouse heart cDNA and inserted into pDONR221 to generate pME-Kir2.1. To mutate the Kir2.1 sequence, we used PCR-based site-directed mutagenesis on the pME-Kir2.1 to generate pME-mutKir2.1 (GYG144-146AAA). The WGA ORF without the stop codon was cloned from genomic DNA extracted from Tg(UAS:AcGFP-T2A-WGA) and inserted into pDONR221 to generate pME-WGA. 14xUAS PSD95:GFP 5UAS:DSRedExpress, plasmid number 74315, was a gift from M. Meyer and S. Smith (32).
Immunohistochemistry
For whole-mount immunohistochemistry, larvae were fixed in 4% paraformaldehyde (PFA) in phosphate-buffered saline (PBS) over-night at 4°C. Larvae were then washed three times in PBS with 0.25% Triton X-100 (PBT) and permeabilized in 0.05% trypsin-EDTA on ice. After washing, samples were blocked with 2% donkey serum for 1 hour at room temperature and incubated overnight at 4°C with primary antibodies diluted in PBT + 1% bovine serum albu-min and 1% dimethyl sulfoxide. Larvae were then washed in PBT and incubated with secondary antibodies at room temperature for 2 to 4 hours. Primary antibodies used were rabbit anti–red fluorescent protein (1:500; 632496, Clontech), chicken anti-GFP (1:500; ab13970, Abcam), goat anti-WGA (1:500; AS-2024, Vector Labs), sheep anti–
Clostridium botulinum BoNT-B Light Chain antibody (1:500; AF5420,
R&D Systems), rabbit anti-NR1 (1:200; 114011, Synaptic Systems), and anti-synaptophysin [1:200; S5768, Sigma-Aldrich (62)]. After staining, the lower jaw was carefully removed under a dissecting microscope, and fish were mounted and imaged from the ventral side using a confocal microscope (Leica SP8-UV).
Calcium imaging
Nonanesthetized larvae (1 to 7 dpf) were embedded in a drop of 2% (w/v) low-melting agarose. Imaging experiments were performed on Tg(GnRH3:gal4ff; UAS:GCaMP6s) or Tg(GnRH3:R-CaMP2) larvae for single-color imaging or on Tg(HuC:GCaMP5G; GnRH3: R-CaMP2) for two-color imaging, all in nacre background (mitfa−/−) to avoid pigment interference during imaging. Fish over 4 dpf were immobilized using -tubocurarine (5 mM; Sigma-Aldrich), and re-cordings lasted for 5 to 20 min, in the absence of external sensory stimulation.
Single-color calcium imaging was performed using a FVMPE RS two-photon microscope (Olympus) setup with an InSight X3 femtosecond-pulsed infrared laser (Spectra-Physics) and a 25×, nu-merical aperture 1.05 water-immersion objective (XLPLN25XWMP2, Olympus). The laser wavelength was tuned to 940 nm for GCaMP6s or to 1040 nm for R-CaMP2. Calcium signals were recorded by time-lapse acquisition using galvanometric scanning mode and conventional raster scanning with a frequency up to 6 to 8 Hz. Two-color two-photon calcium imaging was performed as in Boulanger-Weill et al. (56).
Analysis of Ca2+ imaging data
Processing of the genetically encoded calcium indicator fluorescence was performed using the toolbox previously described (63). Important parameters are summarized below. To detect movement artifacts, all frames with large deviations in the cross-correlation between successive frames (z-score smaller than −2) were manually inspected. Frames with identified moving artifacts were discarded for subsequent analysis. For single-color imaging, regions of interest (ROIs) corresponding to each neuron in the imaged plane were manually drawn. For two-color imaging in Tg(HuC:GCaMP5G; GnRH3:R-CaMP2), ROIs corre-sponding to neurons were semi-automatically detected on a mor-phological basis using a watershed algorithm on time-averaged registered videos. ROIs were then manually curated, and GnRH3 cells were identified by their red-channel fluorescence. Significant transients were extracted from the green fluorescence fluctuations in an adaptive and unsupervised manner considering fluorescence noise and decay dynamics of the calcium reporter (64). We used a confidence threshold of 99% and a decay time of 1.1 s for GCaMP5G and 3.0 s for GCaMP6s (64). Nonsignificant portions of the F/F0 traces were then set equal to
0 in all subsequent analysis.
Analysis of the pairwise correlations between neurons
Pairwise correlations were computed from the temporal Pearson’s linear correlation P for all neuronal pairs as in Boulanger-Weill
et al. (56). Only neurons with at least one significant calcium
tran-sient were considered. Briefly, for a pair of neurons i and j, p(i,j) was computed using significant F/F0 values (see the previous section).
Significant correlations were extracted by thresholding correlation values. The threshold was calculated on the basis of a surrogate dataset where the spontaneous Ca2+ events time stamps were
ran-domly permuted. We then calculated the 99th percentile value of the distribution of the correlations, which was defined as the threshold for each recording (fig. S20).
Analysis of the activity parameters
Activity frequency was computed as the number of active frames per minute. For the other activity parameters, we detected Ca2+− events (trains of successive active frames) and computed the average length of events, average maximum amplitude of events, and onset and offset time duration (from the first active frame to the maximum and from the maximum to the last active frame, respectively).
Photostimulation
Larvae [Tg(GnRH3:ChR2-YFP; GnRH3:R-CaMP2), 3 to 7 dpf] were mounted as described for calcium imaging. Photostimulation experiments were performed on an FVMPE RS two-photon microscope (Olympus) combining two collimated lasers: an InSight X3 femtosecond-pulsed infrared laser (Spectra-Physics) and a Chameleon Ultra II femtosecond- pulsed infrared laser (Coherent) for imaging and photostimulation, respectively. ChR2-expressing neurons were photoactivated apply-ing four iterations of 200 ms, 13 mW, at 920 nm, usapply-ing tornado- scanning mode restricted to an ROI manually selected to target a single GnRH3 cell (for detecting intracluster connectivity) or a cluster (to study interhemisphere connectivity). For single-cell optogenetic stimulation, tornado (spiral-like) two-photon excitation of an optical slice with an estimate three-dimensional (3D) resolution (objective point spread function: 0.45 and 2.2 m in x/y and z axes, respectively) was routinely sufficient to trigger a calcium transient in the targeted ChR2-expressing GnRH neuron. The fact that in some neurons
on May 31, 2021
http://advances.sciencemag.org/
(29%) optogenetic stimulation leads to a calcium transient with no transmission to neuronal neighbors further supports the reliability of our single-cell stimulation protocol. Each photostimulation event was followed by 30 s of calcium imaging using R-CaMP2 at 1040 nm at a frequency of 5 to 7 Hz.
Laser photoablation
Tg(GnRH3:gal4ff;UAS:GCaMP6s) larvae (3 dpf) were mounted in 2% low-melt agarose and imaged under a two-photon microscope as described above. Five minutes of calcium imaging was performed (940 nm, 4 to 10 Hz) before ablation to record normal spontaneous activity. An ROI for photoablation was then manually drawn around a single GnRH3 NFJ cluster (one hemisphere). Thereafter, photoab-lation of GnRH3 cells was performed using 3-s pulses of high inten-sity laser irradiation (Chameleon Ultra II laser set to 910 nm and a power to 75% of laser transmittance, corresponding to 267 mW at the imaging plane) using the built-in “tornado” stimulation tool. The procedure was repeated until complete ablation was achieved. Calcium imaging (5 min) was conducted immediately after pho-toablation and once again after 24 hours (at 4 dpf).
Larva injection
Larvae (3 or 6 dpf) were mounted in 2% ultralow melt agarose and kept under tricaine anesthesia (0.016%, w/v). Under a dissecting stereomicroscope, 8 to 12 nl of drug was injected through a micro-capillary using a picospritzer into either the heart or the brain ven-tricle. Fish were then released from the agarose and allowed to recover in E3 medium until imaging. Substances injected were saline, CNQX (at 1 mM in saline), and AP-5 (at 5 mM in saline).
Kaede photoconversion
Larvae [Tg(GnRH3:gal4ff; UAS:Kaede), 3 dpf] were mounted in 2% ultralow melt agarose onto glass- bottom petri dishes and kept under tricaine anesthesia (0.016%, w/v). A confocal microscope (Leica SP8) equipped with a 405-nm laser was used to perform the photoconver-sion. The 405-nm laser was set to 20% power simultaneously with exci-tation at 488 and 561, and light was collected at both the green and red channels. Photoconversion was monitored by the disappearance of the green signal and increase of the signal in the red channel. Fish were then released and allowed to recover in E3 medium and imaged again using a FVMPE RS two photon microscope (Olympus) after 24 and 48 hours.
Electrophysiology
Whole zebrafish larvae (3 dpf) were immobilized by immersion in -bungarotoxin dissolved in E3 medium for 10 min. Paralyzed lar-vae were mounted in 1% agarose on a glass coverslip. Sample was fixed on the stage of an upright microscope (Axioskop FS2, Carl Zeiss) in artificial cerebrospinal fluid (ACSF). Borosilicate glass pi-pettes (6 to 8 megohm) were backfilled with ACSF and connected to the head stage of an EPC-10 amplifier (HEKA) to acquire and store data using Patchmaster 2x42 software. Patch pipette under positive pressure was introduced into the nostril of the larvae and gently positioned on a R-CaMP2–positive neuron within a NFJ cluster. GnRH neurons expressing R-CaMP2 were visualized using an EM-CCD camera (C9100, Hamamatsu). Neuronal activity was recorded in voltage-clamp mode, in a loose-patch configuration (30- to 150-megohm seal resistance) (65). For direct electrical stimulation, voltage steps (1 V during 1 s every 15 s) were applied by EPC-10 amplifier through the patch pipette (configuration loose patch).
Calcium activity was recorded at 5 to 10 Hz using HC Image Live software (Hamamatsu Photonics, Japan). Synchronization of both patch clamp and imaging recordings was performed through inter-nal triggering.
Sparse labeling and single-neuron tracing
Sparse labeling was achieved by injection of the expression plasmid (7 ng/l) and transposase mRNA (25 ng/l) into 4- to 8-cell embryos. This resulted in low number of transfected cells. Larvae were subse-quently screened under a fluorescent microscope at 3 dpf, and only those with very sparse expression (one to two cells) were chosen for imaging. Tracing and reconstruction of individual GnRH3:GFP- labeled neurons were performed on 3D confocal stacks using the Simple Neurite Tracer tool on ImageJ.
In situ hybridization
A fragment of the GnRH3 and NR2D genes was amplified from ze-brafish brain cDNA with the addition of T3 and T7 promoters on the antisense and sense orientations, respectively. These fragments were used to transcribe Digoxigenin (DIG)–labeled probes using the RNA DIG labeling kit (Roche Diagnostics). Whole-mount in situ hybridization was performed on 3- to 5-dpf Tg(GnRH3:GFP) larvae as described by Thisse and Thisse (66) with slight modifica-tions. These modifications were treatment of the embryos with hy-drogen peroxidase [2% (v/v) in methanol] for 30 min and the addition of 5% (v/v) dextran sulfate to the hybridization mix. Fluorescent signal was developed using the TSA amplification kit (PerkinElmer) for GnRH and Fast Red for NR2D. Larvae were then washed in PBS and immunostained using chicken anti-GFP antibodies and second-ary donkey anti- chicken Alexa Fluor 488 antibodies to visualize transgene expression. Double- labeled larvae were imaged on a confocal microscope (Leica SP8).
CUBIC
Dissected brains from adult Tg(GnRH3:GFP) fish were fixed overnight in 4% PFA in PBS. Fixed brains were washed and transferred to CUBIC-1 buffer (67) for 6 hours. Brains were then mounted in CUBIC-1 buffer and imaged using a confocal microscope (Leica SP8).
DiI retrograde labeling
Dissected heads from Tg(GnRH3:GFP) fish were fixed overnight in 4% PFA in PBS. Following fixation, the tissue was washed, and the pituitary was exposed from the ventral side by carefully removing the palate bone covering it. A single (1,1′-dioctadecyl-3,3,3′,3′- tetramethylindocarbocyanine perchlorate) DiI crystal was then im-planted into the pituitary tissue, and the preparation was incubated in 4% PFA in PBS for an additional 2 weeks in the dark at room temperature. Following the incubation, brains were dissected from the surrounding skull and imaged on a two-photon microscope.
Chemical ablation of GnRH3 cells
Chemical ablation was performed on Tg(GnRH3:gal4ff; UAS:NTR- mCherry). Adult females (transgenic and nontransgenic) were crossed to males in individual spawning tanks over 7 days. Only females that spawned (n = 6 per treatment) were chosen for the experi-ments. Eggs were collected and counted manually. Females were then treated overnight in 10 M metronidazole (in the dark) and allowed to recover in clean system water. One month after the treat-ment, the females were once more crossed to males, and spawning
on May 31, 2021
http://advances.sciencemag.org/