HAL Id: hal-00298243
https://hal.archives-ouvertes.fr/hal-00298243
Submitted on 24 Jul 2006HAL is a multi-disciplinary open access
archive for the deposit and dissemination of sci-entific research documents, whether they are pub-lished or not. The documents may come from teaching and research institutions in France or abroad, or from public or private research centers.
L’archive ouverte pluridisciplinaire HAL, est destinée au dépôt et à la diffusion de documents scientifiques de niveau recherche, publiés ou non, émanant des établissements d’enseignement et de recherche français ou étrangers, des laboratoires publics ou privés.
Stimulated infrared emission from rocks: assessing a
stress indicator
F. T. Freund, A. Takeuchi, B. W. S. Lau, A. Al-Manaseer, C. C. Fu, N. A.
Bryant, D. Ouzounov
To cite this version:
F. T. Freund, A. Takeuchi, B. W. S. Lau, A. Al-Manaseer, C. C. Fu, et al.. Stimulated infrared emission from rocks: assessing a stress indicator. eEarth Discussions, 2006, 1 (2), pp.97-121. �hal-00298243�
eED
1, 97–121, 2006
Stimulated infrared emission from rocks
F. Freund et al. Title Page Abstract Introduction Conclusions References Tables Figures J I J I Back Close Full Screen / Esc
Printer-friendly Version Interactive Discussion
EGU
eEarth Discuss., 1, 97–121, 2006
www.electronic-earth-discuss.net/1/97/2006/ © Author(s) 2006. This work is licensed under a Creative Commons License.
eEarth Discussions
eEarth Discussions is the access reviewed discussion forum of eEarth
Stimulated infrared emission from rocks:
assessing a stress indicator
F. T. Freund1,2,3, A. Takeuchi2,4, B. W. S. Lau2, A. Al-Manaseer5, C. C. Fu6, N. A. Bryant7, and D. Ouzounov8
1
Ecosystems Science and Technology Branch, Code SGE, NASA Ames Research Center, Moffett Field, 94035-1000, CA, USA
2
Department of Physics, San Jose State University, San Jose, 95192-0106 CA, USA 3
SETI Institute, Mountain View 94043, CA, USA 4
Department of Chemistry, Niigata University, Ikarashi-ninotyo, Niigata 950-2181, Japan 5
Department of Civil Engineering, San Jose State University, San Jose, 95192-008 CA, USA 6
Department of Civil Engineering, University of Maryland, College Park, 20742 MD, USA 7
Jet Propulsion Laboratory, Org. 3880, Pasadena, CA 91109-8099, USA 8
CEORS, George Mason University, Fairfax, VA 22030-4444, USA
Received: 16 May 2006 – Accepted: 3 July 2006 – Published: 24 July 2006 Correspondence to: F. Freund ([email protected])
eED
1, 97–121, 2006
Stimulated infrared emission from rocks
F. Freund et al. Title Page Abstract Introduction Conclusions References Tables Figures J I J I Back Close Full Screen / Esc
Printer-friendly Version Interactive Discussion
EGU
Abstract
To study the effect of stress-activated positive hole (p-hole) charge carriers on the infrared (IR) emission from rocks, we subjected a portion (∼10 vol.%) of a large (60×30×7.5 cm3) block of anorthosite, a nearly monomineralic (Ca-rich feldspar) ig-neous rock, to uniaxial deviatory stress up to failure. We measured the IR emission
5
from a flat surface ≈40 cm from the stressed rock volume over the 800–1300 cm−1(7.7– 12.5 µm) range. Upon loading, the intensity and spectrum of the IR emission change. Narrow bands near instantly appear at 930 cm−1 (10.75 µm), 880 cm−1 (11.36 µm), 820 cm−1(12.4 µm) plus additional bands in the 1000–1300 cm−1(10.0–7.7 µm) range. Upon further loading the bands broaden and shift. Their intensities increase but also
10
fluctuate. Near the emission maxima at 300 K, at 1150 cm−1 and 1030 cm−1 (8.7 and 9 µm), barely any intensity increase occurs suggesting that the temperature of the sur-face does not actually increase. We propose that the observed narrow IR emission bands arise from vibrationally excited O-O stretching modes which form when p-hole charge carriers (activated in the stressed rock) spread into the unstressed portion of the
15
rock to the surface, where they recombine and radiatively decay. The effect, stimulated IR emission due to hole-hole recombination, may help explain the enhanced IR emis-sion seen in night-time satellite images of the land surface before major earthquakes known as “thermal anomalies”.
eED
1, 97–121, 2006
Stimulated infrared emission from rocks
F. Freund et al. Title Page Abstract Introduction Conclusions References Tables Figures J I J I Back Close Full Screen / Esc
Printer-friendly Version Interactive Discussion
EGU
1 Introduction
Since the late 1980s and early 1990s, non-stationary areas of enhanced IR emission from the land surface have been recognized in night-time satellite images, which seem to be linked to impending earthquake activity and the build-up of stresses deep below (Gornyi et al., 1988; Qiang et al., 1991; Qiang et al., 1990; Srivastav et al., 1997). The
5
areas of enhanced IR emission are referred to as “thermal anomalies”. The reported excursions in the land surface temperature reach 2–4◦C, occasionally higher.
These thermal anomalies have remained enigmatic (Cui et al., 1999; Srivastav et al., 1997; Tronin, 2000; Tronin, 2002; Tronin et al., 2004). In most cases the increase in ra-diative temperature seems not to correlate to meteorological ground data. The rapidity
10
with which the temperature variations appear and disappear rules out that their cause is the flow of Joule heat from a source below. Several processes have been invoked to account for the apparent rise in temperature: (i) rising fluids that could lead to the emanation of warm gases (Gorny et al., 1998); (ii) rising well water levels and changing moisture contents in the soil (Chadha et al., 2003); (iii) diffuse CO2emanation causing
15
a “local greenhouse” effect (Quing et al., 1991; Tronin, 1999; Tronin, 2002); (iv) Near-ground air ionization due to enhanced radon emission leading to the condensation of water vapor from the atmosphere and, hence, to the release of latent heat (Pulinets et al., 2006). However, upon closer inspection, none of these explanations seems to be able to adequately account for the characteristic features of the “thermal anomalies”,
20
for the rapidity with which the large areas of enhanced IR emission appear and disap-pear, and for the often reported lack of correlation with ground-station meteorological data.
In this paper, we report on laboratory experiments conducted to test a fundamen-tally different hypothesis: that the enhanced IR emission from a rock surface may be
25
controlled by electronic charge carriers that are activated within the rock through the application of deviatory stress.
eED
1, 97–121, 2006
Stimulated infrared emission from rocks
F. Freund et al. Title Page Abstract Introduction Conclusions References Tables Figures J I J I Back Close Full Screen / Esc
Printer-friendly Version Interactive Discussion
EGU
2 Experimental part
We chose anorthosite, an essentially monomineralic feldspar rock composed of the Ca-rich plagioclase labradorite. Our sample, available under the trade name “Blue Pearl”, from Larvik, Norway, is very coarse-grained with crystals up to 2-4 cm in size. The density of the rock is 2.7 g/cm3and its compressive strength 181–187 MPa.
5
We uniaxially stressed a relatively small portion, 10–12 vol.%, of an air-dry anorthosite slab, 60×30×7.5 cm3, via a pair of pistons (11.25 cm diameter), electri-cally insulated from the rock through 0.8 mm thick sheets of high density polyethylene with a resistivity of >1014Ω cm. We applied the load off-center as sketched in Fig. 1, about four piston diameters (>40 cm) away from the IR-emitting surface. The off-center
10
loading concentrated the stresses in the back portion of the slab. Figure 1 displays the principal stress by finite element analysis. Under these conditions, the front face of the slab from where we record the IR emission remains essentially stress-free, especially during the early phase of loading when the absolute stress applied to the back part of the slab is still relatively small. We applied the load at a constant rate of 6.3 MPa/min
15
up to failure, using a hydraulic SATEC press, model RD 2000 kN.
Emission spectra were recorded from a flat, circular area, 5 cm diameter, off the front face of the rock, smooth “as received”, i.e. cut with a diamond saw. We used a Bomen MB-100 FT-IR spectroradiometer equipped with a Peltier-cooled HgCdTe detector and two integrated blackbody emitters for internal calibration, one at ambient temperature,
20
the other at 60◦C, collecting the IR radiation sequentially from the sample and the two blackbody emitters. This spectroradiometer has been used extensively in laboratory and field calibration for NASA’s MODIS spectrometer currently flying on the TERRA and AQUA satellites (Li et al., 1999; Wan et al., 1996). During our measurement, the laboratory was semi-darkened. The space between the rock and the
spectrora-25
diometer, about 1 m, was shielded from ambient light. During the run, the movement of people in the room was restricted to avoid changes in the reflected IR radiation field.
eED
1, 97–121, 2006
Stimulated infrared emission from rocks
F. Freund et al. Title Page Abstract Introduction Conclusions References Tables Figures J I J I Back Close Full Screen / Esc
Printer-friendly Version Interactive Discussion
EGU
14.25 µm) at 2 cm−1 steps. Each FT-IR file consists of 25 scans from the rock sur-face plus 5 scans from the ambient temperature and 5 scans from the 60◦C blackbody emitters for temperature calibration. Each file took 40 s to acquire and store. The radio-metric noise at the single scan level was about 100 mK, improving to about 50 mK upon averaging 25 scans for each file and to about 10 mK upon averaging 10 files. The run
5
lasted 2200 s (36 min 40 s), of which the first 400 s (6 min 40 s) were recorded without applying a load. The IR flux emitted from the rock surface was calculated in tempera-ture equivalents (energy equivalents kT) with reference to the built-in calibration emitter surfaces, using the same algorithm as for MODIS calibration runs.
3 Results
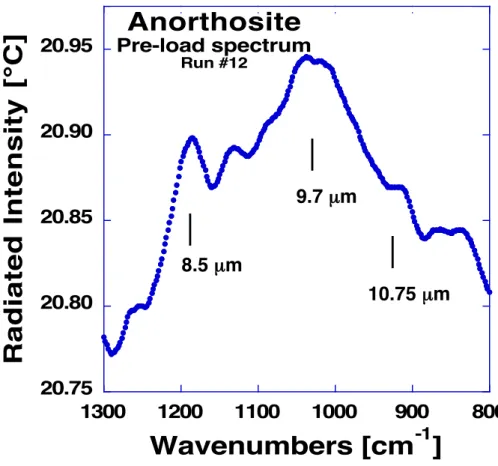
10
Figure 3 shows the pre-loading room temperature (300 K) IR emission spectrum of the anorthosite from 800 to 1300 cm−1 (7.7–12.5 µm) averaged from the 250 pre-loading scans. The 300 K spectrum has two maxima, around 1020 and 1190 cm−1 (9.8 and 8.4 µm respectively), plus a smaller emission peak around 1110 cm−1 (9.0 µm). The emission bands are characteristic of Si–O and Al–O stretching modes thermally
acti-15
vated at 300 K (Johnson, et al., 2002). The room temperature emission is primarily due to downward transitions from the thermally populated first vibrationally excited states, i.e. from quantum number n=1 to their ground states n=0.
Figure 4 shows a 3-D plot of the intensity variations over the 7.4–14.3 µm range (700 to 1350 cm−1) as recorded during this run as a function of time before loading
20
and during loading up to failure. The time axis is labeled in seconds. During the first 6 min 40 s, as we acquired 250 pre-load scans (10 files), the emitted IR intensity is constant. This is consistent with a stable ambient temperature environment in the laboratory. However, as soon as we applied the load, we see an overall increases in the emitted IR intensity. The increase is near-instant upon application of the load
25
and new emission bands appear. Upon further increases of the load, we see that the intensities fluctuate strongly. Such fluctuations had already been observed during
eED
1, 97–121, 2006
Stimulated infrared emission from rocks
F. Freund et al. Title Page Abstract Introduction Conclusions References Tables Figures J I J I Back Close Full Screen / Esc
Printer-friendly Version Interactive Discussion
EGU
earlier IR emission experiments (Freund et al., 2002b; Freund et al., 2003). The IR intensity fluctuations resemble current fluctuations seen during measurements of the “battery currents”, which flow out of a stressed rock volume through unstressed rock (Freund et al. 2006, 2004b).
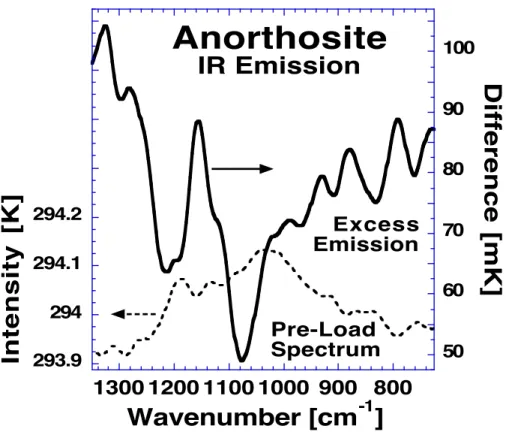
The difference spectra in Fig. 5 show the excess intensity emitted over the spectral
5
range as a function of load and time. The difference spectra were obtained by subtract-ing the average of the 10 pre-load files from each of the files acquired subsequently during loading up to failure. There are three outstanding features:
1. Narrow emission bands appear immediately upon loading, within 40 s, specifically three bands between 800–950 cm−1 (10.5–12.5 µm) plus a few narrow bands at
10
higher wavenumbers (shorter wavelengths).
2. The intensity fluctuations as a function of time are synchronous across the en-tire spectral range, though the fluctuations of different bands are not evenly dis-tributed.
3. The excess intensity emitted during loading is concentrated at wavelengths that
15
are different from those of the two emission maxima in the pre-load emission spectrum.
This last point is highlighted in Fig. 6 where we superpose onto the pre-load 300 K spectrum the excess IR intensity integrated over the entire run. The narrow emission bands are preserved even after integration, in particular the three diagnostically
signif-20
icant bands in the 800–950 cm−1 (10.5–12.5 µm) range and a prominent narrow band around 1150 cm−1 (8.7 µm). While the pre-load spectrum exhibits intensity maxima at 1080 cm−1 and 1210 cm−1 (9.7 and 8.5 µm), the excess emission has minima near these same wavenumbers/wavelengths.
During two earlier measurement sessions, we had the opportunity of record the IR
25
emission from the surface of a other blocks of rock stressed a distance away from the emitting surface. We observed similar spectral features, in particular narrow emission
eED
1, 97–121, 2006
Stimulated infrared emission from rocks
F. Freund et al. Title Page Abstract Introduction Conclusions References Tables Figures J I J I Back Close Full Screen / Esc
Printer-friendly Version Interactive Discussion
EGU
bands at the beginning of loading, which broadened with increasing stress (Freund et al., 2002a, 2003). For these earlier runs we had used both anorthosite and granite, a multi-mineralic rock with about 1/3 quartz, 1/3 plagioclase feldspar and 1/3 potassium feldspar. As reported excess IR was also emitted in these cases in narrow bands in the 800–950 cm−1 (10.5–12.5 µm) range plus some broader bands in the 1150 cm−1
5
(8.7 µm) range. The experiment presented here confirms these earlier observations, though the band positions were slightly different, probably due to the more complex mineralogy of the granite.
4 Discussion
Rock fracture experiments as described in the literature are typically performed under
10
conditions emulating ASTM C170-50 and DIN 52102 procedures, i.e. with cylindrical test samples loaded over their entire cross section (Brady and Rowell, 1986; Lockner, 1993; Rowell et al., 1981; Warwick et al., 1982; Yoshida and Ogawa, 2004). Loading over the entire cross section, however, causes stress gradients in the surface and subsurface region. It causes the surface to bulge leading to tensile stresses, which
15
cause microfracturing. Microfracturing leads to intense visible and IR emission over a broad spectral range (Brady and Rowell, 1986).
The experiment presented here is significantly different. It was designed from the beginning such that the stresses generated during loading would be confined to the back portion of the slab and would not extend to the front surface, from where the IR
20
emission was to be measured. Because of the large distance between this surface and the stressed rock volume, >40 cm, we can rule out that frictional heat produced in the stressed rock volume would have diffused to the emitting surface within a time as short as 40 s. Hence, whatever changes we would observe, we can be sure that they are not caused by a flow of Joule heat to the emitting surface. Instead, we have to consider
25
other processes capable of producing rapid changes in the IR emission characteristics upon loading the rock.
eED
1, 97–121, 2006
Stimulated infrared emission from rocks
F. Freund et al. Title Page Abstract Introduction Conclusions References Tables Figures J I J I Back Close Full Screen / Esc
Printer-friendly Version Interactive Discussion
EGU
The most likely candidates are highly mobile electronic charge carriers that have been shown to exist in igneous rocks such as granite, anorthosite and gabbro, albeit in a dormant, electrically inactive form (Freund, 2002; Freund et al., 2004a; 2006). In the following we briefly review what these charge carriers are and what is known about them.
5
It is widely assumed in the geoscience community that oxygen anions in naturally occurring minerals are fixed in their 2- valence state. However, it has been shown some time ago that a reaction exists by which oxygen anions can change their valence from 2- to 1- (Martens et al., 1976). The reaction involves hydroxyl pairs that are ubiquitous in all minerals, which crystallize in the presence of H2O, even those that are nominally
10
anhydrous. The hydroxyl pairs in the matrix of these nominally anhydrous minerals can split off H2while simultaneously converting their O2−to the 1– (peroxy) state.
A single O− in a matrix of O2− represents a defect electron, resident in the valence band of otherwise insulating materials, also known as a positive hole or p-hole for short. Normally O− form pairs, which we call positive hole pairs, PHP. In oxide materials the
15
PHPs form peroxy anions, O2−2 (Batllo et al., 1991; Freund et al., 1993). In silicate minerals they form peroxy links, O3X/OO\XO3 with X=Si4+, Al3+ etc., well-known in fused silica (Ricci et al., 2001) but believed to be prevalent in all minerals that have crystallized in the presence of H2O, incorporating some “water” in the form of hydroxyl and thus acquiring the capacity to convert hydroxyl pairs to peroxy links (Freund, 2003).
20
This makes all igneous and high-grade metamorphic rocks candidates for containing PHPs.
As long as the O−exist in the PHP or peroxy state, the p-holes are self-trapped and, hence, electrically inactive. When deviatory stresses are applied, the rocks begin to plastically deform through dislocations moving in large numbers through the mineral
25
grains (Miguel et al., 2001; Moore and Lockner, 1995; Ohnaka, 1995). When moving dislocations intersect the PHPs, they instantly cause them to break apart and to release p-hole charge carriers (Freund et al., 2006).
eED
1, 97–121, 2006
Stimulated infrared emission from rocks
F. Freund et al. Title Page Abstract Introduction Conclusions References Tables Figures J I J I Back Close Full Screen / Esc
Printer-friendly Version Interactive Discussion
EGU
the p-holes can move on the O 2sp-dominated levels close to the upper edge of the valence band by exchanging an electron with a neighboring O2−. Theoretically, the speed with which the p-holes could travel is on the order of 300 m/s, consistent with the group velocities in the range of 100–300 m/s measured experimentally (Freund, 2002). Because the valence band forms an energetic continuum, the p-holes can jump
5
grain boundaries. In experiments such as described here where we stress a portion of a large slab of rock the p-holes can flow out of the stressed volume and into unstressed rock (Freund et al., 2006). When they reach the surface, they form a positive charge layer (Freund et al., 1993; King and Freund, 1984). Typical surface potentials measured under open circuit conditions are+1.5 V to +1.75 V. The corresponding charge
densi-10
ties are 10−5 Coulomb/m2 or 1013–1014 p-holes/m2 (Takeuchi et al., 2006; Takeuchi and Nagahama, 2002b). These values give an estimate, by order of magnitude, of the number of p-hole charge carriers that arrive at the rock surface.
Of special interest to the IR emission is the fact that it costs energy to break a peroxy bond or PHP. This energy is spent during the mechanical work that is put into the
15
system during plastic deformation. If the p-holes recombine at the surface to restitute the peroxy bond or PHP, some of this energy will be regained. In the primary step this recombination energy will be deposited into the newly formed O−-O− bonds, causing them to be “born” in a vibrationally highly excited state. In order to estimate the energies involved we need to know, at least approximately, the O-O bond energy.
20
In order to photodissociate a peroxy link in fused silica a relatively high energy is needed, 9.4 eV (Nishikawa et al., 1990). From measurements of the electrical con-ductivity as a function of temperature, the energy needed to thermally dissociate the peroxy bond and release p-hole charge carriers is much lower. In MgO single crys-tals the activation energy is on the order of 2.4 eV (Freund et al., 1993). We expect
25
similar activation energies for the break-up of peroxy links in silicate minerals and, by extension, in rocks (Freund, 2003). Furthermore it is probably correct to expect that the energy needed for the break-up of PHPs during mechanical deformation is not drastically different. Hence, we can adopt a value around 2.4 eV as being maximally
eED
1, 97–121, 2006
Stimulated infrared emission from rocks
F. Freund et al. Title Page Abstract Introduction Conclusions References Tables Figures J I J I Back Close Full Screen / Esc
Printer-friendly Version Interactive Discussion
EGU
available during recombination of p-holes to form PHPs.
In Fig. 7 we represent the surface by three corner-linked SiO4 tetrahedra, two of which terminate at the surface with non-bonded oxygens. On the left, two p-holes are shown to arrive at the surface and to settle on these two adjacent oxygen anions changing them from O2−to O−. On the right, the two O−are shown to snap together to
5
form the short O−-O− bond characteristic of the peroxy link or PHP (Ricci et al., 2001). If approximately 2.4 eV are released during p-hole recombination, the new O−-O− bond will be “born” in a vibrationally highly excited state. To dissipate this excess energy two decay channels are available: (i) a radiative decay by emitting photons at the characteristic energies of the O-O vibrational manifold or (ii) a non-radiative decay
10
by channeling energy into neighboring Si-O and Al-O bonds, which in turn become excited and emit at their characteristic vibrational frequencies.
The 300 K emission spectrum in Fig. 3 arises from downward transitions of vibra-tional modes that are thermally excited at 300 K. The probability to populate the excited levels Enabove the ground state E0is given by exp[–(En–E0)/kT], where k is the
Boltz-15
mann constant and T the absolute temperature. We are interested in the IR region around 1000 cm−1or 10 µm, i.e. in energy levels separated by ≈100 meV. At 300 K, the mean thermal energy, kT300K, is ≈25 meV. Hence, the probability to populate the first excited level n=1, is e−4≈2×10⁻² or ≈2%. To populate the second excited level, n=2, ≈200 meV above E0, the probability drops to e−8≈ 10−4or ≈0.02% etc. Therefore, for
20
the 10–12 µm region, levels above n=1 are sparsely populated at 300 K and nearly all IR intensity emitted at this temperature comes from downward transitions from the n=1 level to the n=0 ground level. Emission bands arising from transitions between higher excited levels, or instance from n=2 to n=1 or from n=3 to n=2, are called “hot bands”. The difference spectra in Fig. 5 emphasize the narrow emission bands that are
ob-25
served from the very on-set of loading, in particular three narrow bands on the right. The band at 930 cm−1 (10.75 µm) is consistent with the fundamental stretching mode of the O−-O− bond, corresponding to an n=1 to n=0 transition. For the peroxy link O3Si/OO\SiO3 in amorphous SiO2 the energy for this mode has been obtained from
eED
1, 97–121, 2006
Stimulated infrared emission from rocks
F. Freund et al. Title Page Abstract Introduction Conclusions References Tables Figures J I J I Back Close Full Screen / Esc
Printer-friendly Version Interactive Discussion
EGU
quantum-mechanical calculations to be 920–930 cm−1(10.75–10.87 µm) (Ricci, et al., 2001). The energies of “hot” transitions for the O-O bond, from n=2 to n=1 and from n=3 to n=2, are unknown. However, as a result of the asymmetry of the bond po-tential, these transitions must occur at slightly lower energies, i.e. lower wavenumbers and longer wavelengths. The two narrow bands at 870 cm−1(11.5 µm), and 810 cm−1
5
(12.35 µm) are consistent with O-O “hot” bands arising from the n=2 to n=1 and n=3 to n=2 transitions respectively. In other words, these bands arise from a non-thermal emission process.
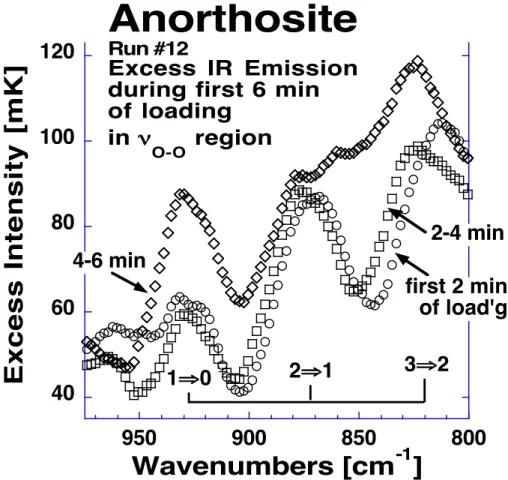
The intensity evolution of the three bands at 930 cm−1(10.75 µm), 870 cm−1(11.5 µm), and 810 cm−1(12.35 µm) is replotted in Fig. 8 for the first
10
three 2 min intervals after beginning of loading. The bands at 810 cm−1(12.35 µm) and 870 cm−1(11.5 µm), which we assign to hot transitions, exhibit higher intensities in the beginning. Later, the fundamental at 930 cm−1 (10.75 µm) gains intensity, while the hot bands loose their narrow character.
The narrow bands in the 1000–1200 cm−1 (8.3–10 µm) range in Fig. 5 display a
15
similar intensity evolution as a function of time and load. They are consistent with the concept shown in Fig. 7 which depicts (on the right) that the vibrationally highly excited O−-O− bond channels energy onto its Si-O and Al-O neighbors, thereby exciting their characteristic vibrational modes.
The excess intensity emitted integrated over the entire course, from the beginning
20
of loading to the failure of the rock, exhibits maxima around 1150 and 1300 cm−1 (8.7 and 7.7 µm respectively) but minima close to where the 300 K spectrum has its emis-sion maxima. This suggests that the energy gained by p-hole recombination at the surface is primarily used for non-thermal emission processes, but much less to excite the pool of lattice modes, i.e. to “heat” the rock surface. This implies that most of the
25
excess energy of the newly formed O−-O− bonds is radiated as discrete IR photons at 930 cm−1 (10.75 µm), 870 cm−1 (11.5 µm), and 810 cm−1(12.35 µm) or used to excite neighboring Si-O and Al-O bonds. As a result, the anorthosite surface does not heat up. The observations presented here therefore support our proposition that the
emis-eED
1, 97–121, 2006
Stimulated infrared emission from rocks
F. Freund et al. Title Page Abstract Introduction Conclusions References Tables Figures J I J I Back Close Full Screen / Esc
Printer-friendly Version Interactive Discussion
EGU
sion spectrum of the anorthosite rock observed during stressing is non-thermal, arising primarily from stimulated IR luminescence due to p-hole recombination.
To estimate how much energy can be radiated from the surface during p-hole recom-bination, we need to know (i) how many p-holes arrive at the surface and (ii) how much energy is released per p-hole recombination event.
5
(i) For a flat surface across a dielectric contrast from ε=10 to ε=1, theory predicts surface potential on the order of +0.4 V (King and Freund, 1984). Experimentally, steady state surface potentials in the range from+0.1 V to +1.5 V have been recorded (Freund, 2002; Freund, et al., 2006; Takeuchi, et al., 2006; Takeuchi and Nagahama, 2002a), though pulse-like values as high as+12 V to +17 V have been observed during
10
cracking (Enomoto, et al., 1993; Freund, et al., 2004a). A surface potential of +1 V requires a charge density of ≈10−5 Coulomb m−2, equivalent to ≈1013m−2 (Takeuchi and Nagahama, 2002b).
(ii) We can estimate how many p-hole recombination events are needed to produce a 0.15 K increase of radiation temperature. To break a peroxy bond an activation energy
15
around 2.4 eV is needed (Freund, 2003). If this energy were to be fully regained during p-hole recombination, each recombination event would release 2.4 eV, equivalent in terms of thermal energy kT to ≈28 000 K. In this case, 2×10⁵ recombination events over a surface area of 20 cm2 would suffice to increase its radiative temperature by 0.15 K.
20
A surface of 20 cm2 contains ≈1016 O2− anions. Taking the charge carrier density derived above, ≈10−5 Coulomb m−2or ≈1013 charges m−2 (Takeuchi and Nagahama, 2002b), a surface of 20 cm2 can achieve 1 V surface potential by acquiring ≈1010 p-holes. However, assuming full recovery of the activation energy dispensed during the breaking of the peroxy bonds, only 2×10⁵recombination events per unit time would be
25
needed to increase the radiative temperature by 0.15 K. This suggests that only a small fraction of the p-holes, which reach the surface, need to participate at any time in the IR emission process.
mech-eED
1, 97–121, 2006
Stimulated infrared emission from rocks
F. Freund et al. Title Page Abstract Introduction Conclusions References Tables Figures J I J I Back Close Full Screen / Esc
Printer-friendly Version Interactive Discussion
EGU
anism for the observed increase in radiative temperature lies within the limit of our basic assumptions. We note that, in our experiment, the rock surface, which emits the IR radiation, was smooth. If it had been rougher by a geometric factor of about 10, the radiative IR flux would probably have increased by the same factor to an equiv-alent temperature around 1.5 K, closer to the 2–4◦C apparent temperature increases
5
reported for the “thermal anomalies” before major earthquakes. Further experiments will be needed to address this and many other questions raised by this study.
5 Conclusions
When we apply stress 40 m cm away from the emitting rock surface and observe rapid changes in the IR intensity and spectrum, within 40 s or less, we can say with some
10
degree of confidence that this is consistent with the flow of p-hole charge carriers from the stressed rock volume to the emitting surface. The rock surface that emits the IR radiation is clearly too far from the stressed rock volume, over 40 cm, for frictional heat to reach the surface within such a short time. The IR emission is consistent with an exothermal recombination of the p-holes to form positive hole pairs, PHP. It is also
15
consistent with a radiative decay of the vibrationally excited O-O bonds and with the channeling of some of their excess energy into neighboring Si-O and Al-O bonds.
It is still too early to say whether or not the “thermal anomalies” seen in night-time satellite images prior to major seismic activity are caused by p-holes recombining at the surface of the Earth. The experiment described here and its interpretation, however,
20
suggest that p-hole recombination provides a physically plausible mechanism, which could explain the increased IR flux from the surface of a rock subjected to deviatory stress far from the emitting surface.
The flow of p-holes from the stressed rock volume to the surface as proposed here represents a new mechanism for transporting energy rapidly over macroscopic
dis-25
tances.
Zheng-eED
1, 97–121, 2006
Stimulated infrared emission from rocks
F. Freund et al. Title Page Abstract Introduction Conclusions References Tables Figures J I J I Back Close Full Screen / Esc
Printer-friendly Version Interactive Discussion
EGU
ming Wan and his coworkers Y. Zhang and Q. Zhang, ICESS, University of California at Santa Barbara, who brought their BOMEN radiospectrometer and other radiometric equipment three times to our laboratory. They helped us perform the experiments but do not necessarily sub-scribe to our interpretation of the results. We thank M. Jhabvala, NASA Goddard Space Flight Center, for encouraging us and helping us during the early phase of this project. We thank
5
G. Pacchioni, Milano, Italy for performing additional calculations for the O-O vibrational energy in the feldspar structure. We acknowledge financial support by grants from the NASA Ames Research Center Director’s Discretionary Fund. B.W.S.L. was supported by a grant from the National Geospatial Agency (NGA). A.T. acknowledges support from the Japan Society for the Promotion of Science (JSPS) for Young Scientists.
10
References
Batllo, F., LeRoy, R. C., Parvin, K. et al.: Positive hole centers in MgO – correlation between magnetic susceptibility, dielectric anomalies and electric conductivity., J. Appl. Phys., 69, 6031–6033, 1991.
Brady, B. T. and Rowell, G. A. : Laboratory investigation of the electrodynamics of rock fracture,
15
Nature, 321, 488–492, 1986.
Chadha, R. K., Pandey, A. P., and Kuempel, H. J.: Search for earthquake precursors in well water levels in a localized seismically active area of reservoir triggered earthquakes in India, Geophy. Res. Lett., 30, 69–71, 2003.
Cui, C., Liu, Q., Luo, Z. et al.: Monitoring the thermal IR anomaly of Zhangbei earthquake
20
precursor by satellite Remote sensing technique, paper presented at ACRS, 1999.
Enomoto, Y., Hashimoto, H., Mori, S. et al.: Exoelectron emission: Possible relation to seismic geo-electromagnetic activities as a microscopic aspect in geotribology, Wear, 168, 135–142, 1993.
Freund, F.: Charge generation and propagation in rocks, J. Geodynamics, 33, 545–572, 2002.
25
Freund, F., Freund, M. M., and Batllo, F.: Critical review of electrical conductivity measurements and charge distribution analysis of magnesium oxide, J. Geophys. Res.,98, 22 209–22 229, 1993.
de-eED
1, 97–121, 2006
Stimulated infrared emission from rocks
F. Freund et al. Title Page Abstract Introduction Conclusions References Tables Figures J I J I Back Close Full Screen / Esc
Printer-friendly Version Interactive Discussion
EGU
formation, paper presented at Spring Meeting, Amer. Geophys. Union, Washington, DC., Abstract T22B-03, 2002a.
Freund, F., Ouzounov, D., Freund, M. M. et al.: Mid-Infrared radiation, electric charges and acoustic emission during rock deformation, paper presented at Fall Meeting, Amer. Geophys. Union, Washington, DC., Abstract MR52A-0999, 2002b.
5
Freund, F. T.: On the electrical conductivity structure of the stable continental crust, J. Geody-namics, 35, 353–388, 2003.
Freund, F. T., Ouzounov, D., Wan, Z. et al.: Stimulated IR emission from the surface of rocks during deformation, paper presented at American Geophysical Union, Fall Meeting 2003, AGU, San Francisco, CA., Abstract T51E-0200, 2003.
10
Freund, F. T., Takeuchi, A., Lau, B. et al.: Stress-induced changes in the electrical conductivity of igneous rocks and the generation of ground currents, Terrestrial, Atmospheric and Oceanic Sciences (TAO), 15, 437–468, 2004a.
Freund, F. T., Takeuchi, A., and Lau, B. W. S.: Electric Currents Streaming out of Stressed Igneous Rocks – A Step Towards Understanding Pre-Earthquake Low Frequency EM
Emis-15
sions, Phys. Chem. Earth.,31, 389–396, 2006.
Freund, F. T., Takeuchi, A., Lau, B. W. S., and Hall, C. G. : Positive holes and their role dur-ing the build-up of stress prior to the Chi-Chi earthquake, paper presented at International Conference in Commemoration of 5th Anniversary of the 1999 Chi-Chi Earthquake, Taiwan, Taipei, Taiwan, 2004b.
20
Gornyi, V. I., Salman, A. G., Tronin, A. A., and Shilin, B. B.: The Earth’s outgoing IR radiation as an indicator of seismic activity, Proc. Acad. Sci. USSR, 301,67–69, 1988.
Johnson, J. R., H ¨orz, F., Lucey, P. G., and Christensen, P. R.: Thermal infrared spectroscopy of experimentally shocked anorthosite and pyroxenite: Implications for remote sensing of Mars, J. Geophys. Res., 107, 5076–5086, 2002.
25
King, B. V. and Freund, F.: Surface charges and subsurface space charge distribution in mag-nesium oxide containing dissolved traces of water, Phys. Rev., B29, 5814–5824, 1984. Li, Z.-L., Becker, F., Stoll, M. P. et al.: Channel selection for soil spectrum reconstruction in
8–13 µm region, J. Geophys. Res., 104, 22 271–22 286, 1999.
Lockner, D.: The role of acoustic emission in the study of rock fracture, Int. J. Rock Mechanics
30
& Minind Sci., 30, 883–899, 1993.
Martens, R., Gentsch, H., and Freund, F.: Hydrogen release during the thermal decomposition of magnesium hydroxide to magnesium oxide, J. Catalysis, 44, 366–372, 1976.
eED
1, 97–121, 2006
Stimulated infrared emission from rocks
F. Freund et al. Title Page Abstract Introduction Conclusions References Tables Figures J I J I Back Close Full Screen / Esc
Printer-friendly Version Interactive Discussion
EGU
Miguel, M. C., Vespignani, A., Zapperi, S. et al.: Intermittent dislocation flow in viscoplastic deformation, Nature, 410, 667–671, 2001.
Moore, D. E. and Lockner, D. A.: The role of microcracking in shear-fracture propagation in granite, J. Struct. Geol., 17, 95–114, 1995.
Ohnaka, M.: A shear failure strength law of rock in the brittle-plastic transition regime, Geophys.
5
Res. Lett., 22, 25–28, 1995.
Pulinets, S., Ouzounov, D., and Karelin, A. V: The physical nature of thermal anomalies ob-served before strong earthquakes, Phys. Chem. Earth, 31, 143–153, 2006.
Qiang, Z.-J., Xu, X.-D., and Dian, C.-D.: Thermal infrared anomaly – precursor of impending earthquakes, Chinese Sci. Bull., 36, 319–323, 1991.
10
Qiang, Z. J., Xu, X. D., and Dian, C. G.: Abnormal infrared thermal of satellite-forewarning of earthquakes, Chinese Sci. Bull., 35, 1324–1327, 1990.
Quing, Z., Xiu-Deng, X., and Chang-Gong, D.: Thermal infrared anomaly-precursor of impend-ing earthquakes, Chinese Sci. Bullet., 36, 319–323, 1991.
Ricci, D., Pacchioni, G., Szymanski, M. A. et al.: Modeling disorder in amorphous silica with
em-15
bedded clusters: The peroxy bridge defect center, Physical Review B, 64, 224 104–22 4101– 224 104–224 108, 2001.
Rowell, G. A., Brady, B. T., Yoder, L. P., and Hanson, D. R. : Precursors of laboratory rock failure, in: Fracture Mechnanics for Ceramics, Rocks, and Concrete, edited by: Freiman, S. W. and Fuller, E. R. 196–220, ASTM, Philadelphia, PA, 1981.
20
Srivastav, S. K., Dangwal, M., Bhattachary, A. and Reddy, P. R.: Satellite data reveals pre-earthquake thermal anomalies in Killari area, Maharashtra, Current Science, 72, 880–884, 1997.
Takeuchi, A., Lau, B. W. S., and Freund, F. T.: Current and surface potential induced by stress-activated positive holes in igneous rocks, Phys. Chem. Earth, to be published, 2006.
25
Takeuchi, A. and Nagahama ,H.: Interpretation of charging on fracture or frictional slip surface of rocks, Phys. Earth Planet. Inter., 130, 285–291, 2002a.
Takeuchi, A. and Nagahama, H.: Surface charging mechanism and scaling law related to earth-quakes, J. Atmospheric Electricity, 22, 183–190, 2002b.
Tronin, A. A. (Ed.): Satellite thermal survey application for earthquake prediction, Terra Sci.
30
Publ., Tokyo, Japan, 717–746, 1999.
Tronin, A. A.: Thermal satellite data for earthquake research, paper presented at IGARSS 2000; IEEE 2000 international geoscience and remote sensing symposium. Taking the pulse of the
eED
1, 97–121, 2006
Stimulated infrared emission from rocks
F. Freund et al. Title Page Abstract Introduction Conclusions References Tables Figures J I J I Back Close Full Screen / Esc
Printer-friendly Version Interactive Discussion
EGU
planet: the role of remote sensing in managing the environment, IEEE, Honolulu, HI, 2000. Tronin, A. A.: Atmosphere-lithosphere coupling: Thermal anomalies on the Earth surface in
seismic process, in Seismo-Electromagnetics: Lithosphere-Atmosphere-Ionosphere Cou-pling, edited by: Hayakawa, M. and Molchanov, O. A., Terra Scientific Publ., Tokyo, 173–176, 2002.
5
Tronin, A. A., Molchanov, O. A., and Biagi, P. F.: Thermal anomalies and well observations in Kamchatka, International J. Remote Sensing, 25, 2649–2655, 2004.
Wan, Z., Snyder, W., and Zhang Y.: Validation of land-surface temperature retrieval from space, paper presented at IGARSS ’96: Remote Sensing for a Sustainable Future, Geoscience and Remote Sensing Symposium, IGARSS, Lincoln, NE, 1996.
10
Warwick, J. W., Stoker, C., and Meyer, T. R.: Radio emission associated with rock fracture: Possible application to the great Chilean earthquake of 22 May 1960, J. Geophys. Res., 87, 2851–2859, 1982.
Yoshida, S. and Ogawa, T.: Electromagnetic emissions from dry and wet granite associated with acoustic emissions, J. Geophys, Res., 109, doi:10.1029/2004JB003092, 2004.
eED
1, 97–121, 2006
Stimulated infrared emission from rocks
F. Freund et al. Title Page Abstract Introduction Conclusions References Tables Figures J I J I Back Close Full Screen / Esc
Printer-friendly Version Interactive Discussion EGU
60 cm
Rock
11.5 cm Ø
Piston
Piston
electrical insulation
30 cm
BOMEM
Spectrometer
~ 1 m
Rock
Fig. 1. Schematic of the set-up used to measure the IR emission from the flat front face of a
eED
1, 97–121, 2006
Stimulated infrared emission from rocks
F. Freund et al. Title Page Abstract Introduction Conclusions References Tables Figures J I J I Back Close Full Screen / Esc
Printer-friendly Version Interactive Discussion
EGU
Fig. 2. Finite analysis representation, using a variable grid size, of the stress and strain
distribution in the anorthosite block during asymmetric loading. The 20 cm2surface from where the IR emission is measured is on the hidden surface on the left.
eED
1, 97–121, 2006
Stimulated infrared emission from rocks
F. Freund et al. Title Page Abstract Introduction Conclusions References Tables Figures J I J I Back Close Full Screen / Esc
Printer-friendly Version Interactive Discussion EGU
20.75
20.80
20.85
20.90
20.95
800
900
1000
1100
1200
1300
R
a
d
ia
te
d
I
n
te
n
s
it
y
[
°C
]
Wavenumbers [cm
-1]
9.7 µm
8.5 µm
10.75 µm
Anorthosite
Pre-load spectrum
Run #12Fig. 3. IR emission spectrum at room temperature (average of 10 files of 25 scans each) from
eED
1, 97–121, 2006
Stimulated infrared emission from rocks
F. Freund et al. Title Page Abstract Introduction Conclusions References Tables Figures J I J I Back Close Full Screen / Esc
Printer-friendly Version Interactive Discussion
EGU
Fig. 4. 3-D plot of the intensity evolution and spectral changes of the IR emission between
700–1350 cm−1 (7.37–14.3 µm) from the front face of the anorthosite block before and during loading up to failure, plotted as a function of time during loading (for details see text).
eED
1, 97–121, 2006
Stimulated infrared emission from rocks
F. Freund et al. Title Page Abstract Introduction Conclusions References Tables Figures J I J I Back Close Full Screen / Esc
Printer-friendly Version Interactive Discussion
EGU
Fig. 5. Difference plot of the intensity evolution and spectral changes of the IR emission from
the front face of the anorthosite block obtained by subtracting each file recorded during loading from the average of the pre-load files.
eED
1, 97–121, 2006
Stimulated infrared emission from rocks
F. Freund et al. Title Page Abstract Introduction Conclusions References Tables Figures J I J I Back Close Full Screen / Esc
Printer-friendly Version Interactive Discussion EGU
293.9
294
294.1
294.2
294.2
294.3
294.4
294.5
50
60
70
80
90
100
800
900
1000
1100
1200
1300
In
te
n
s
it
y
[
K
]
D
if
fe
re
n
c
e
[
m
K
]
Wavenumber [cm
-1]
Anorthosite
IR Emission
Pre-Load
Spectrum
Excess
Emission
Fig. 6. Total excess intensity emitted over the 7.37–14.7 µm range from the front face of the
eED
1, 97–121, 2006
Stimulated infrared emission from rocks
F. Freund et al. Title Page Abstract Introduction Conclusions References Tables Figures J I J I Back Close Full Screen / Esc
Printer-friendly Version Interactive Discussion EGU h• h• oxygen silicon hot peroxylink
Fig. 7. Schematic representation of a mineral surface to illustrate the processes that may take
place when p-holes arrive at the surface (left). When the two p-holes recombine, recombination energy is released, leading to a vibrationally highly excited O-O bond, which can de-excite radiatively by emitting IR photons characteristic of transitions the energy levels of the O-O bond, and non-radiatively by channeling energy into neighboring bonds (right).
eED
1, 97–121, 2006
Stimulated infrared emission from rocks
F. Freund et al. Title Page Abstract Introduction Conclusions References Tables Figures J I J I Back Close Full Screen / Esc
Printer-friendly Version Interactive Discussion EGU
40
60
80
100
120
800
850
900
950
E
x
c
e
s
s
I
n
te
n
s
it
y
[
m
K
]
Wavenumbers [cm
-1]
first 2 min
of load'g
2!1
1!0
3!2
2-4 min
Anorthosite
Run #12
Excess IR Emission
during first 6 min
of loading
in "
O-O
region
4-6 min
Fig. 8. Evolution of the IR emission bands in the spectral range expected to contain the O-O