Copyright © 1989 Cambridge University Press 0952-5238/89 $5.00 + .00
Changing distribution of GABA-like immunoreactivity
in pigeon visual areas during the early posthatching
period and effects of retinal removal on tectal
GABAergic systems
PAOLA BAGNOLI,1 GIGLIOLA FONTANESI,1 PETER STREIT,2 LUCIANO DOMENICI,3
AND ROBERTO ALESCI1
'Department of Physiology and Biochemistry, University of Pisa, Via S.Zeno 31, 56100 Pisa, Italy
2
Brain Research Institute, University of Zurich August-Forel-Strasse 1, CH-8029 Zurich, Switzerland 'institute of Neurophysiology CNR, Via S.Zeno 51, 56100 Pisa, Italy
(RECEIVED January 6, 1989, ACCEPTED September 12, 1989)
Abstract
The distribution of GABA-like immunoreactivity in the pigeon visual system was studied during the first 9 days after hatching using a mouse monoclonal antibody, mAb 3A12, to glutaraldehyde linked GABA (Matute & Streit, 1986). GABA-like immunoreactivity was seen in cell bodies as well as in neuropil at the level of both the retina and central visual regions at any posthatching age. However, the distribution of putative GABAergic cells and processes varied with age reaching the adult pattern at around 9 days. As a general observation, almost no cell bodies in the retina (except for some perikarya in the ganglion cell layer) were labeled at hatching but densely packed immunostained processes were present in the inner plexiform layer. During the next few days, GABA-immunoreactive amacrine and horizontal cells appeared and the adult distribution of GABA-like immunoreactivity was reached at around 9 days. In the other visual regions examined, the general trend in the variation of GABA-like immunoreactivity included: (1) a progressive decrease in the density of immunostained cell bodies and (2) an almost parallel increase in the concentration of stained neuropil. Since in pigeons the adult organization of visual pathways and the final distribution of putative GABAergic systems are reached at around the same age, we suggest the possibility that incoming ganglion cell axons play a role in regulating the distribution of GABA-like immunoreactivity in visual areas. This hypothesis is supported by the fact that the distribution of GABA-like immunoreactivity in the superficial layers of the optic tectum was altered following ablation of the contralateral retina immediately after hatching.
Keywords: GABA immunohistochemistry, Maturation, Retinal ablation, Plasticity, Avian visual system
Introduction
Gamma-aminobutyric acid (GABA) is the best described inhib-itory transmitter in the vertebrate brain. Methods for micro-scopical localization of GABA and related substances have been developed and include local uptake of [3H]-GABA (Kelly & Dick, 1976; Kisvarday et al., 1986; Neale et al., 1983; Ottersen et al., 1987; Storm-Mathisen, 1975), retrograde labeling of cell bodies using [3H]-GABA injections into their terminal fields (Cuenod et al., 1982; Cuenod & Streit, 1983; Somogyi et al., 1984), as well as immunohistochemical localization of glutamic acid decarboxylase (GAD) (Mugnaini & Oertel, 1985; Oertel et al., 1981; Oertel et al., 1983) or GABA (Seguela et al., 1984;
Reprint requests to: P. Bagnoli, Department of Physiology and Bio-chemistry, University of Pisa, via S.Zeno 31, 56100 Pisa, Italy.
Somogyi et al., 1985; Storm-Mathisen et al., 1983). Recently, a mouse monoclonal antibody (mAb) to glutaraldehyde-linked GABA has been developed (mAb 3A12) (Matute & Streit, 1986) and utilized to study the distribution of GABA-like immuno-reactivity (GABA-LI) in insect optic lobes (Meyer et al., 1986), pigeon brain (Domenici et al., 1988), rat cerebral cortex (Celio, 1986), cerebellar cortex, olfactory bulb, and hippocampal for-mation (Liu et al., 1989).
Although a number of studies have been aimed at elucidat-ing the distribution of GABAergic systems in the adult brain, relatively little is known about the maturation of GABAergic cells and processes. Nonetheless, anatomical and biochemical studies in mammals demonstrated that GABAergic systems ap-pear early in development (Coyle & Enna, 1976; Hatten et al., 1984; Lauder et al., 1986; Wolff et al., 1984). In addition, GAD immunoreactivity has been found in growth cones of GABAer-491
gic neurons in the developing cerebellum (McLaughin et al., 1975). This early appearance suggests the possibility that, apart from being an inhibitory neurotransmitter, GABA may play a role in synaptogenesis (Wolff, 1981).
Less is known about the maturation of GABAergic systems in the avian brain. Recently, the ontogeny of GABA receptor complex (Tehrani & Barnes, 1986) and GABAergic neurons (Jong et al., 1986) has been studied in the brain of chick em-bryos. In addition, development of GABA-LI in chick hyper-striatum ventrale and cerebellum has been investigated (Curtis & Stewart, 1986).
With respect to studies concerning maturation and plastic-ity of the brain, the pigeon visual system serves as a useful model among nonmammalian species. Indeed, its maturation is not completed at hatching and continues to take place dur-ing the early period after hatchdur-ing (Bagnoli et al., 1985; Bag-noli et al., 1987; Porciatti et al., 1985). In addition, removal of one retina at hatching has been shown to induce an abnormal maturation of primary visual pathways which persists in the adult stage (Bagnoli et al., 1989a).
In the present study, we have used mAb 3A12 to describe the location of putative GABAergic cells and processes in the ret-ina and some central visual areas of pigeons during the first 9 days after hatching. In addition, in order to investigate the pos-sible role of incoming retinal axons on the distribution of GABA-immunoreactive (GABAir, i.e. containing GABA-LI) cells and processes, we have also studied the pattern of GABA-LI in the optic tectum (TeO) of adult pigeons which had under-gone unilateral retinal removal immediately after hatching (i.e. when axonal invasion of tectal layers was not yet completed; see Bagnoli et al., 1987).
Methods Materials
Materials used were as follows: Chloral hydrate (Codex, C. Erba, Milano, Italy), goat anti-mouse IgG (H+L; Kirkegaard and Perry, Gaithesburg, MD), mouse peroxidase-antiperoxi-dase (PAP) complex (Sternberg-Meyer, Jarrettsville, MD), and mouse monoclonal anti-GABA antibody, mAb 3A12, as de-scribed by Matute and Streit (1986).
returned to their nest. The completeness of retinal ablation was examined at the time when the brains were removed from the skull. In two pigeons, the operated eyes were dissected from the skull, incised in the equatorial plane, placed in 10% formalin, processed for paraffin embedding, and serially sectioned in the transverse plane at 8 /*m. Sections were then mounted on plastic-coated glass slides and alternately stained with Bodian and toluidine blue. Examination under microscopic view re-vealed no residual retinal tissue.
All pigeons were deeply anesthetized with chloral hydrate (20% in physiological solution, 0.25 ml/100 g body weight) and transcardially perfused with a 6% Rheomacrodex solution fol-lowed by the fixative.
Various fixatives were applied, namely: glutaraldehyde alone; glutaraldehyde in combination with formaldehyde; form-aldehyde alone. Table 1 shows which fixatives were applied at which stages of development.
The removed brains were postfixed in the same solution used for the perfusion (3-5 h) and then stored in phosphate-buffered saline (PBS) at 4°C. Brains were enclosed in 20% gelatin and coronally cut on a vibratome (Oxford, Model E) at 30 /tm. Floating vibratome sections at every 90 jtm were processed for immunohistochemistry. Sections adjacent to those processed for immunocytochemistry were stained with cresyl violet.
Retinal tissue was rapidly removed from perfused pigeons and postfixed overnight at 4°C. To remove the retina, the eyes were enucleated and hemisected at the level of the ora serrata to remove cornea, iris, and lens. The vitreous humor was care-fully aspirated in a Petri dish containing fixative solution, and the retina was peeled from the choroid. After cutting the pec-ten at its base, the retina was separated from the pigment layer by a fine brush. The apex of the pecten was taken as a land-mark to identify the laterally located fovea centralis which was investigated immunohistochemically at all developmental stages indicated above. Retinal specimens were dehydrated in 2,2-dimethoxypropane (Muller & Jacks, 1975) and embedded flat in Epon 812. Semithin (1 /un) sections were mounted on gela-tinized slides. Some of these sections were stained with toluidine blue. For immunohistochemistry, sections were etched for 7 min in a mixture of methanol, propylene oxide, and potassium hydroxide (Maxwell, 1978) and washed in methanol, metha-nol/PBS, and PBS.
Animals, retinal removal, fixation procedures
Twenty eight pigeons (Columba livia) ranging in age from 6 h to 9 days were used in this study. Since differences in GABA-LI were found to depend not only on the posthatching age but also on the duration of the incubation in ovo, we used animals which had an incubation period of 18-20 days, unless otherwise stated. Eight adult pigeons were used, four of which had been subjected to the removal of the left retina immediately after hatching. In addition, two pigeons aged 3 weeks were also used. Of these two pigeons, one was normal and the other had the left retina removed immediately after hatching. Retinal removal was performed following a procedure previously described (Bagnoli et al., 1989a). Briefly, after local infiltration of Novocain in the orbital tissue, a thin glass cannula was inserted through the corneal surface and the optical media as well as the underlying retina were aspirated under microscopic control. The eye was then stuffed with a small cotton-wool ball, and the pigeons were
Table 1. Experimental parameters: number of animals, stages, and fixation procedures"
Fixation 5% GAb 2.5% GA 2.5% GA + 2.5% FAC 4% FA 6 hours 1 1 3 1 Number of animals 3 days 1 1 3 1 4 days 2 6 days 1 1 3 1 at each 9 days 1 1 3 1 stage 21 days 2 180 days 8 a
All fixatives were diluted in phosphate buffer 0.1 M, pH 7.4. The time of hatching was defined with a precision of ±2 h.
b
GA = glutaraldehyde.
C
Tissue processing
The immunohistochemical staining procedure was similar to that applied in an investigation of adult pigeon brains (Domenici et al., 1988). Thus, in all experiments, three washes of 5 min each followed the incubation with antibodies. Antibodies were diluted in a solution containing 10% normal bovine serum in PBS. This solution was also used prior to the application of an-tibodies. Briefly, the following incubations were performed on vibratome and semithin sections (at room temperature unless otherwise stated): overnight at 4°C in mAb 3A12 diluted 1:8000 for vibratome sections and 1:1000 for semithin sections; 1 h in goat anti-mouse IgG antibody diluted 1:50 for vibratome sections and 1:20 for semithin sections; and 1 h in mouse per-oxidase-antiperoxidase (PAP) complex diluted 1:100. The pro-duction and characterization of the "anti-GABA" antibody, mAb 3A12, used in the present study had been described else-where (Matute & Streit, 1986). Briefly, the immunological prop-erties of mAb 3A12 were determined in an enzyme-linked immunosorbent assay (ELISA). The antibody showed a high degree of preference of GABA amongst a series of amino acids conjugated to bovine serum albumin (BSA) by means of glutar-aldehyde. Furthermore, mAb 3A12 revealed patterns of im-munoreactivity in rat brain tissue which were consistent with available information on the localization of neurons using GABA as neurotransmitter (Matute & Streit, 1986).
To reveal the sites of immunoreactivity, sections were treated with 0.05% 3,3'-diaminobenzidine tetrahydrochloride (Sigma, St. Louis, MO) and 0.01% H2O2 in 0.05 M Tris buffer (pH 7.6) for 4-6 min. Sections were then washed in PBS and rinsed in water. Floating vibratome sections were mounted on gela-tinized slides. All sections were dehydrated and coverslipped with Eukitt. To increase the penetration of the primary anti-body, alternate vibratome sections were incubated in a solution in which 0.1% Triton X-100 had been added to the primary an-tibody.
In several experiments, the specificity of the immunostain-ing was tested usimmunostain-ing different procedures, namely: (1) mAb 3A12 containing ascitic fluid diluted 1:1000 was preincubated with GABA-BSA-glutaraldehyde complex (6-6000 jig/ml) for 2 h at room temperature and then applied to the sections to test for inhibition of immunostaining; (2) 4% formaldehyde alone was used in order to test whether mAb 3A12 reacted with anti-genic sites on molecules fixed by formaldehyde; and (3) in all experiments some sections were incubated with 10% normal bo-vine serum in PBS instead of the primary antibody and then processed as described above.
Quantitative analysis
Quantitative evaluations were performed from coronal sections of the different visual regions at corresponding anterior-poste-rior levels of brains from different age groups. Retina coronal sections were also used. Sections were examined with a Zeiss mi-croscope equipped with 5x (n.a. = 0.08) and 80x (n.a. = 0.65) (plan) objectives, respectively, and with lOx (plan) oculars. A video camera (MW-V3E Panasonic, Osaka, Japan) was at-tached to the microscope and interfaced with the computer-assisted image analyzer. The images were automatically digitized, and a digitizing tablet supplied with a pen to manipu-late a screen sensor was used to manually determine the bound-aries of the analysis field as well as to mark, trace, and count
the cells. According to the microscope objectives, spatial mea-surements were calibrated to any scale (e.g. /xm, mm) with one simple command and the system read directly in the calibration units. The size of visual nuclei was determined by measuring their rostrocaudal axis and volume. The rostral and caudal borders of the visual regions were assessed by determining the sections in which the first and the last labeled cells were pres-ent. The volume of visual regions was determined by integrat-ing their area measurements from sections that contained labeled cells. The number of sections ranged from 7-11 per an-imal, according to the different areas. Ten area measurements in the same section on consecutive days revealed a measuring error of 1.57% (S.E.M. expressed as percentage of the mean value). Both the soma size (expressed as cross-sectional area in square micrometers) and the shape factor for labeled cells was determined. The shape factor is a two-dimensional index which is indicative of round shaped cell bodies when approaching 1. Fifty cells that had at least one nucleolus were measured in each region to obtain the soma size and shape factor for each animal. In addition, the number of cells (either labeled or unlabeled) per cubic millimeter of tissue (numerical density, Nv) was deter-mined by using stereological methods (O'Kusky & Colonnier, 1982; Weibel & Bolender, 1973; Weibel & Gomez, 1962). Six to nine sections for each region were used to obtain JVV for each animal. The percentage of labeled cells was calculated by mea-suring the ratio of labeled cell Nv to total cell Nv. Total cell Nv was obtained from cresyl-violet stained sections.
In the retinal ganglion cell layer, the soma size of labeled and unlabeled cells as well as shape factor and Nv of labeled cells were also determined.
Statistical analysis
Statistical analysis was performed by using Crunch Statistical Package (Crunch Software Corp., Oakland, CA). The effect of the independent variable (age) on dependent variables was as-sessed using the analysis of variance (ANOVA). The Student-Newman-Keuls (SNK) multiple range test (0.05 level of significance) was used to identify difference between age groups for each variable in each visual region.
Abbreviations
For the abbreviations used in the photomicrographs of transverse sections of the pigeon brain the reader should refer to the stereotaxic atlas of Karten and Hodos (1967). Denomi-nation of tectal layers are taken from Cowan et al., 1961.
FRL = formatio reticularis lateralis mesencephali GLv = n.geniculatus lateralis, pars ventralis
Imc = n.isthmi, pars magnocellularis Ipc = n.isthmi, pars parvocellularis LA = n.lateralis anterior thalami nBOR = n.basal optic root
PT = n.pretectalis
QF = tractus quinto frontalis Rt = n.rotundus
SAC = stratum album centrale SGC = stratum griseum centrale SOP = stratum opticum centrale
TeO = optic tectum TrO = tractus opticus
Results
Specificity of antibodies
According to Domenici et al., 1988, no patterns of immunore-activity could be detected in formaldehyde-fixed tissue. Prein-cubation of mAb 3A12 with increasing amount of GABA-BSA (6-30 jig/ml) before its application to sections gradually diminished the immunostaining and made it to disappear com-pletely at 30 /xg/ml, as previously reported (Domenici et al., 1988). There were no indications of immunostained cell bodies and processes in control sections in which the primary antibody had been omitted. Moreover, addition of 0.1% Triton X-100 to the solution containing the primary antibody consistently caused a decrease in immunostaining in cell bodies and an in-crease in the number of stained processes as compared to those obtained in sections incubated without this detergent.
Distribution of GABA-LI during the early posthatching period
Comparable patterns of immunoreactivity were found in brain material treated with different percentages of glutaraldehyde as
well as glutaraldehyde added to formaldehyde. In this material, a similar distribution of GABA-LI was obtained in the visual areas of animals belonging to the same age group independently of the fixative used. According to previous studies (Domenici et al., 1988; Matute & Streit, 1986), brain materials fixed with either 2.5% or 5% glutaraldehyde did not show nonspecific staining at the antibody dilution used in this study. Tissue sec-tions for brains fixed with glutaraldehyde added to formalde-hyde consistently displayed lower levels of background staining. Thus, results reported below refer to glutaraldehyde-formalde-hyde fixed materials.
Retina
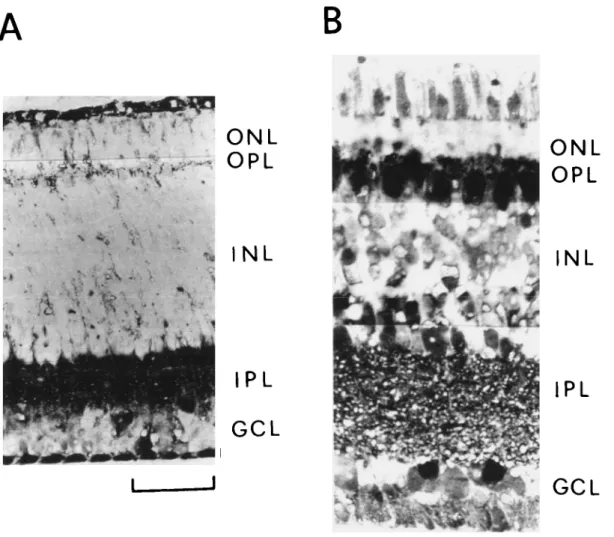
The inner plexiform layer (IPL) of newly hatched pigeons con-tained densely packed GABAir processes which occupied most of this area (Fig. 1A). Labeling in IPL was rather uniform and did not display any lamination. Weakly immunopositive terminal-like elements were also present in both the innermost portion of the inner nuclear layer (INL) and the outer plexiform layer (OPL). Except for some GABAir perikarya which were consistently present in the ganglion cell layer (GCL), no labeled cell bodies could be observed. Prominent staining of ovoid
pro-B
PL
GCL
Fig. 1. GABA immunohistochemistry of pigeon retina at two stages after hatching. A, at hatching and B, at 6 days. Stained processes appear throughout the inner plexiform layer (IPL) in both cases. No stained cells are present at hatching except for some GABAir cell bodies in the ganglion cell layer (GCL). Numerous GABAir amacrine cells in the inner nuclear layer (INL) and presumed horizontal cells which lie along the outer margin of INL are additionally present at 6 days. ONL: outer nuclear layer; and OPL: outer plexiform layer. Scale bar = 25 |im.
files at the inner limiting membrane might be tentatively related to internal feet of Miiller cells.
The retinal pattern of GABA-LI did not change significantly in the period to the third day after hatching, when GABAir cells began to appear in INL. Thus, at around 6-9 days (Fig. IB), the pattern of GABA-LI was almost comparable to that observed in adult pigeons. Amacrine cell bodies situated in the innermost portion of INL as well as horizontal cells along the outer mar-gin of INL were found to contain immunoreactivity. In addi-tion, GABA-LI was associated with cells in GCL but not with photoreceptors nor with Muller cells. Some labeled terminal-like elements were observed in OPL and the innermost portion of INL. Dense GABA-LI was also present in IPL where clearly de-finable bands of immunoreactivity became evident at the adult stage. The pattern of GABA-LI in the adult retina was compa-rable to that previously shown (Agardh et al., 1987; Karten & Brecha, 1983; Osborne, 1987).
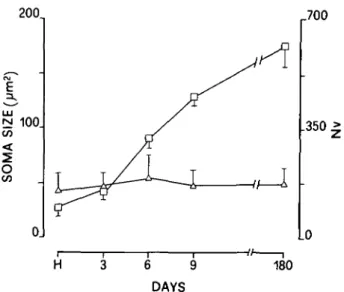
At the retinal level, the analysis of variance showed a signifi-cant effect of age (P < 0.05) on Nv of labeled cells in GCL. No significant effect on soma size and shape factor was found. As shown in Fig. 2, Nv gradually increased from hatching to the adult stage (+85%; P < 0.001), whereas no significant changes were observed in the soma size which was similar to that of un-labeled cells.
Central visual areas
The main primary visual regions at diencephalic and mesence-phalic levels as well as the nucleus pretectalis (PT) and the nu-cleus isthmi, pars parvocellularis (Ipc), were examined for possible changes in the distribution of GABA-LI during the first 9 days after hatching. In all these regions, GABAir perikarya and processes could be observed immediately after hatching, and their distribution changed during the following 9 days when the adult pattern was reached. In general, numerous GABAir
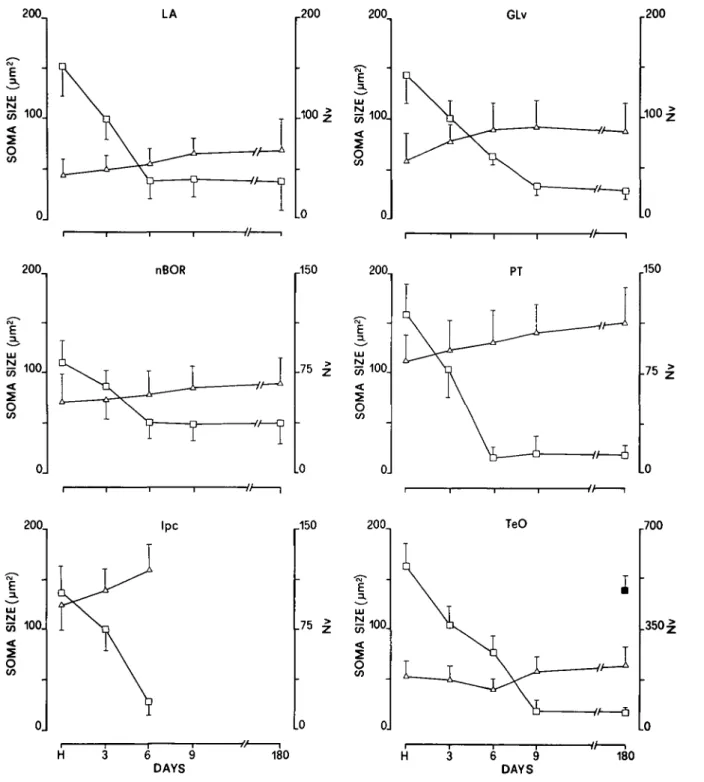
200., UJ 2 100. CO < O CO 0J ,.700 . 3 5 0 ^ .0 6 9 DAYS 180
Fig. 2. Size (cross-sectional area in square micrometers, open triangles) and numerical density Nv (number of cells x lOVmm3 of tissue, open squares) of labeled cell bodies in the retinal ganglion cell layers at different stages. Each point represents the mean ± S.D. Five pigeons from hatching to 9 days and four 180-day-old pigeons were used. H: hatching.
round-shaped cells were present at hatching. Their density decreased progressively with a parallel increase in neuropil im-munostaining. Cell size generally increased whereas cell mor-phology did not appear to change significantly except in P T where round-shaped cells found at hatching became ovoid dur-ing the followdur-ing days.
For most regions examined critical alterations occurred be-tween 3-4 and 6 days. Indeed, the distribution of GABA-LI did not change from hatching to 3-4 days and from 6-9 days when the adult pattern was reached. Since no discernible differences in the distribution of GABA-LI were found between 3- and 4-day-old pigeons, only the pattern of GABA-LI obtained at 3 days of age will be described.
In the rostro-dorsal thalamus, at hatching, the nucleus later-alis anterior thalami (LA) displayed numerous small stained cells (Fig. 3A). During the following week, neuropil labeling in-creased whereas the density of labeled cell bodies was found to be reduced (Fig. 3B). Similar temporal changes were also ob-served in other visual thalamic nuclei, such as the nucleus dor-solateralis anterior thalami, pars magnocellularis (DLAmc), and the nucleus dorsolateralis anterior thalami (DLL). In contrast,
Fig. 3. GABA-LI in the rostro-dorsal thalamus showing the nucleus lateralis anterior thalami (LA). Note the increased neuropil labeling from hatching (A) to 6 days (B). Labeled cells reduce their density from hatching to 6 days. Scale bar = 100 urn.
the nucleus rotundus (Rt) was free of labeled perikarya and neu-ropil. . .
In the ventro-medial thalamus, at hatching, small, weakly la-beled cell bodies together with faintly stained neuropil were
•v;'
Fig. 4. GABA-LI in the ventro-medial thalamus showing the nucleus geniculatus lateralis, pars ventralis (GLv). Note changing distribution of GABA-LI from hatching (A) to 6 days (B) when heavily labeled cells appear in the central portion of the nucleus and a general increase in neuropil labeling can be seen. VLT = n. ventrolateralis thalami; QF: tractus quinto frontalis; and TrO: tractus opticus. Scale bar = 100 pm.
present within the internal region of the nucleus geniculatus lateralis, pars ventralis (GLv). In contrast, the external region of GLv displayed many densely labeled cells together with numerous GABAir processes (Fig. 4A). At 6 days, heavily la-beled small cells were seen scattered throughout GLv and a gen-eral increase in neuropil labeling could be observed (Fig. 4B). A further increase in neuropil labeling and a decrease in GABAir cell density was found at 9 days when the adult cytoar-chitecture was reached. At the level of the thalamus, neither the optic tract nor the optic nerve showed GABA immunoreactiv-ity at any age.
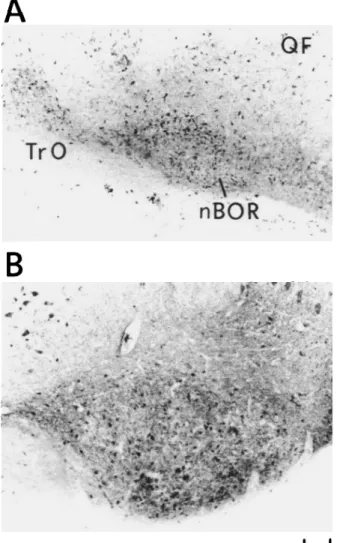
At the level of the mesencephalon, the main nuclei receiving direct retinal input showed GABAir cells and processes immedi-ately after hatching. In general, GABA-LI varied during the first 9 days with a decreased density of stained cells and an in-creased neuropil labeling. This tendency is typically shown by the nucleus of the basal optic root (nBOR) presented in Fig. 5. A similar tendency with respect to changes in perikaryal and neuropil labeling was observed in secondary visual regions of
TrO
B
•* r
Fig. S. GABA-LI of the mesencephalon showing the nucleus of the basal optic root (nBOR). At hatching, numerous labeled cells are pres-ent (A), whereas at 9 days they appear sparsely distributed (B). Addi-tionally, an increase in the density of labeled neuropil can be observed. QF: tractus quinto frontalis; and TrO: tractus opticus. Scale bar = 100
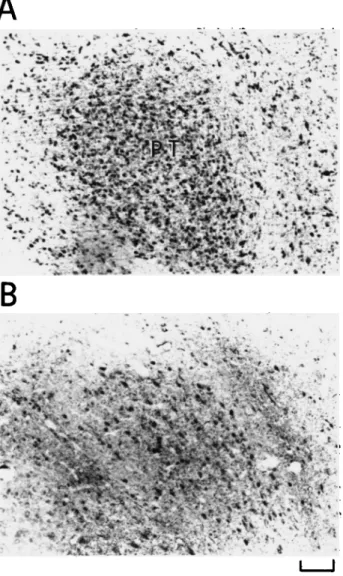
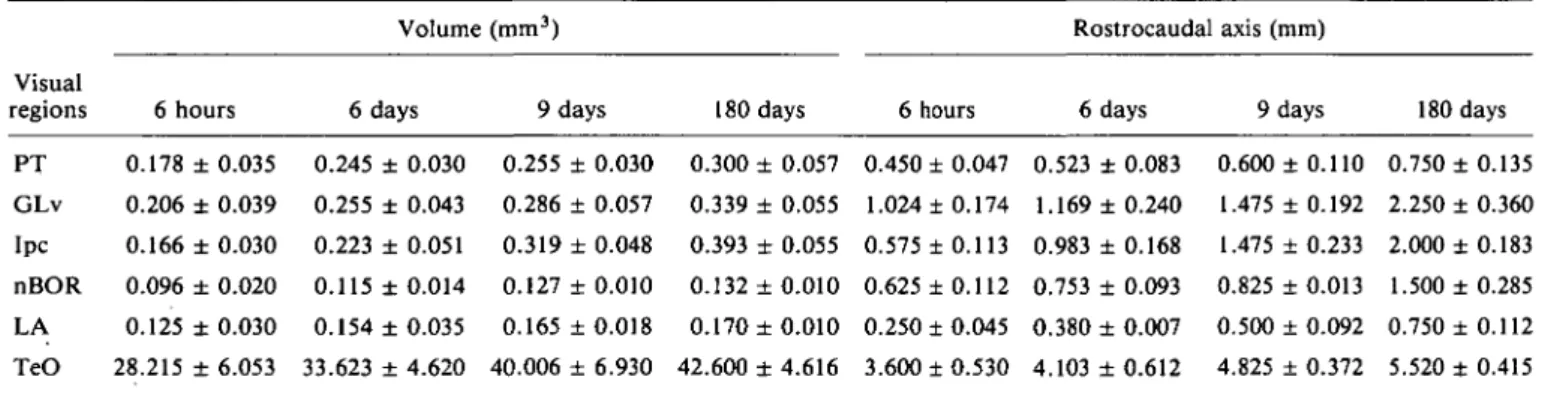
the mesencephalon, namely, in PT (Fig. 6) and Ipc (Figs. 7 and 8) which have been shown to be reciprocally connected with the optic tectum (TeO) (Hunt et al., 1977; Reiner & Karten, 1982). In particular, many stained cells could be observed at hatching in Ipc, which appeared surrounded laterally by numer-ous stained fibers of the stratum album centralis (SAC) of TeO (Fig. 7A). The density of stained cells appeared to have de-creased at 6 days mainly in the rostral division of Ipc (Fig. 7B and Fig. 8A). As shown in Fig. 8B at 9 days, no staining of neu-ronal perikarya was found anymore.
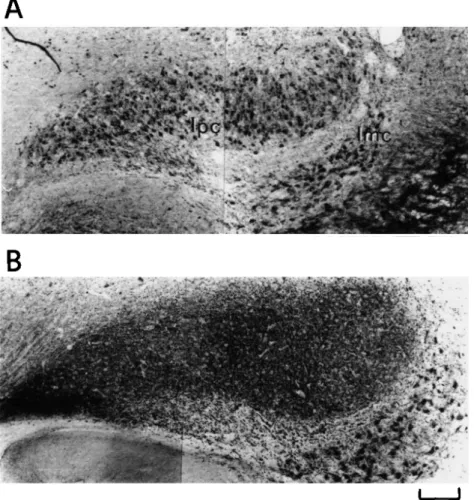
In TeO, GABA-LI was observed in cell bodies and neuropil at all posthatching stages, but both the distribution of GABAir cells and the density of staining in the neuropil were found to vary with age, reaching the adult pattern at around 9 days (Fig. 9). Changes in the distribution of GABA-LI were partic-ularly evident in the tectal layers above lamina Hi as well as in layer III. The distribution of GABAir cells and processes in layers Hi and Hj was, at all ages, similar to that found in the adult pigeon. In particular, many stained cell bodies giving off
B
**••". *
Fig. 6. GABA-LI of the mesencephalon showing the nucleus pretec-talis (PT). Again, a progressive decrease in density of labeled cells with a parallel increase of stained neuropil can be observed from hatching (A) to 9 days (B). Scale bar = 100 ^m.
radially oriented processes could be observed in layer Hi. These processes could be more readily demonstrated in sections incu-bated with a solution containing the primary antibody and Tri-ton X-100. From hatching to 9 days, three major changes in the pattern of GABA-LI occurred in the tectal layers above lamina Hi:
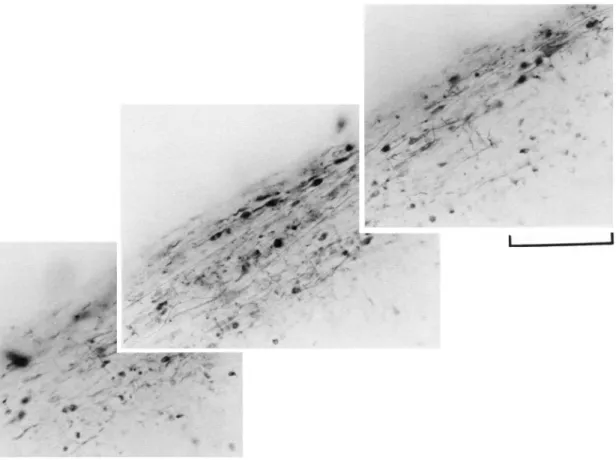
1. A progressive disappearance of stained cell bodies in that layer designated as L, in Fig. 9A, which at 9 days was found to be occupied by unstained optic fibers (layer I in Fig. 9B). GABAir cell bodies of layer L, could be more readily dem-onstrated in pigeons whose incubation period had been one week shorter than normal. As shown in Fig. 10, numerous labeled cells with associated horizontal processes embedded within a network of tangentially and radially running fibers were observed in the superficial TeO.
2. An increase in the density of neuropil labeling in the most su-perficial layers (designated as L2 in Fig. 9A), which by the age of 9 days have developed into sublayers Ila-c (Fig. 9B). 3. A progressive decrease in the density of labeled cell bodies in lower layers. Decrease in cell density was particularly evi-dent in those layers (designated as L3 in Fig. 9A), which at 9 days presumably corresponded to lamina lid (Fig. 9B) as well as in laminae Ile-h. At 9 days, laminae Ild-h showed few immunoreactive cells (Fig. 9B). In layer III, a progres-sive decrease in density of GABAir cells was evident from hatching to 9 days when few labeled cell bodies were de-tectable.
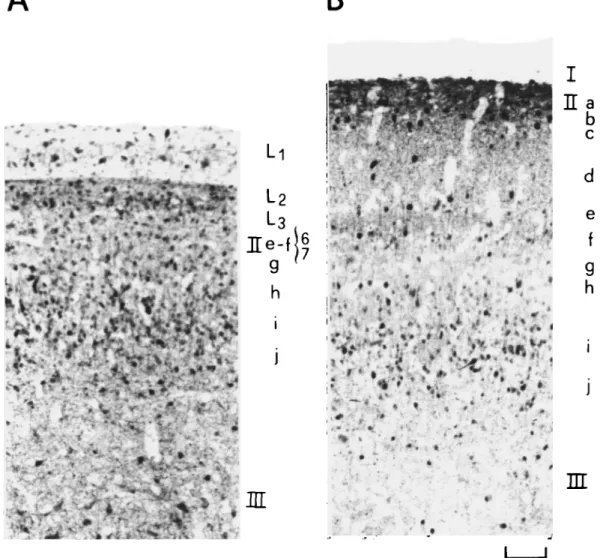
In Fig. 11, the adult distribution of GABA-LI is shown at the level of the same structures examined during the first 9 days after hatching. Their cytoarchitecture was comparable to that found at 6-9 days and is in agreement with that previously de-scribed by Domenici et al., 1988.
In the central visual regions examined, the analysis of vari-ance showed a significant effect of age (P < 0.05) on most de-pendent variables, i.e. rostrocaudal axis, volume, Nv, soma size, and percentage of stained cells. As to the shape factor of stained cell bodies, the effect of age was significant only in PT (P < 0.05).
As shown in Table 2, rostrocaudal axis and volume gradu-ally increased from hatching to the adult stage. The maximum increase in volume was shown by Ipc (+135%; difference be-tween hatching and adult stage: P < 0.005). Comparable differ-ences between hatching and adult stage were observed in the other regions (PT: +68%; GLv: +64%; nBOR: +38%; LA: +36%; TeO: +68%; P < 0.01). The maximum increase in ros-trocaudal axis was observed in Ipc (+248%; difference between hatching and adult stage: P< 0.001), whereas the minimum in-crease was shown by PT (+66%; P < 0.01).
As shown in Fig. 12 in all regions examined, stained cell size gradually increased from hatching to 6-9 days. Soma-size in-crease ranged between a value of +20% found in TeO (differ-ence between hatching and 9 days: P < 0.01) and a value of +35% measured in LA (difference between hatching and 9 days: P < 0.001). Generally, the number of labeled cells (Table 3) and Nv (Fig. 12) drastically decreased from hatching to 6 days when the adult value was reached. A further decrease both in the number of labeled cells and Nv was observed in TeO and GLv between 6 and 9 days {P < 0.05). The highest decrease (differ-ence between hatching and 6 days: P < 0.05) in the number of
Fig. 7. Distribution of GABA-LI at the level of another mesencephalic nucleus, namely, the nucleus isthmi, pars parvocellularis (Ipc). Note that from hatching (A) to 6 days (B), stained cells appear to decrease in density mainly in the rostral part of the nucleus which is surrounded by numerous GABAir fibers of the tectal stratum album centralis (SAC). FRL: formatio reticularis lateralis mesencephali. Scale bar = 200 /»m.
Table 2. Volume and rostrocaudal axis of the central visual regions at different stages"
Volume (mm3) Rostrocaudal axis (mm)
Visual
regions 6 hours 6 days 9 days 180 days 6 hours 6 days 9 days 180 days
PT GLv Ipc nBOR LA TeO 0.178 ± 0.035 0.245 ± 0.030 0.255 ± 0.030 0.300 ± 0.057 0.450 ± 0.047 0.523 ± 0.083 0.600 ±0.110 0.750 ± 0.135 0.206 ±0.039 0.255 ±0.043 0.286 ± 0.057 0.339 ± 0.055 1.024 ±0.174 1.169 ± 0.240 1.475 ± 0.192 2.250 ± 0.360 0.166 ±0.030 0.223 ±0.051 0.319 ± 0.048 0.393 ± 0.055 0.575 ±0.113 0.983 ± 0.168 1.475 ± 0.233 2.000 ± 0.183 0.096 ± 0.020 0.115 ±0.014 0.127 ± 0.010 0.132 ± 0.010 0.625 ±0.112 0.753 ± 0.093 0.825 ± 0.013 1.500 ±0.285 0.125 ± 0.030 0.154 ±0.035 0.165 ± 0.018 0.170 ± 0.010 0.250 ± 0.045 0.380 ± 0.007 0.500 ± 0.092 0.750 ±0.112 28.215 ± 6.053 33.623 ± 4.620 40.006 ± 6.930 42.600 ± 4.616 3.600 ± 0.530 4.103 ± 0.612 4.825 ± 0.372 5.520 ± 0.415 a
Values are expressed as mean ±S.D. Five 6-hour-, 6-day-, 9-day-old pigeons, and four 180-day-old pigeons were used.
Table 3. Number of labeled cells (xJO3) in central visual regions at different stages" Visual regions P T GLv Ipc nBOR LA TeO 6 hours 21.360 ± 0.360 30.488 ± 5.772 20.750 ± 3.750 8.832 ± 1.840 19.000 ± 4.560 16,026.120 ± 3,438.104 6 days 2.940 ± 0.360 15.300 ± 2.580 4.125 ± 0.943 4.312 ± 1.525 6.468 ± 1.470 8,809.226 ± 1,210.440 9 days 2.860 ± 0.494 8.580 ± 1.710 0 4.700 ± 0.112 6.600 ± 0.792 2,400.360 ± 415.800 180 days 2.400 ± 0.456 8.475 ± 1.375 0 4.880 ± 0.370 6.800 ± 0.400 2,470.800 ± 267.728 a
Values are expressed as mean ±S.D. Four pigeons for each age were used. Number of labeled cells was calculated by multiplying labeled cell Nv by visual region volumes reported in Table 2.
Fig. 8. GABA immunohistochemistry of the nucleus isthmi, pars parvocellularis (Ipc) at 6 (A) and 9 (B) days after hatching (at a different level as compared to that shown in Fig. 7). (At this level, stained cells of the nucleus isthmi, pars magnocellularis (Imc) can also be seen.) At 9 days, stained cells of Ipc are no longer present, whereas many labeled terminal-like dots can be observed. The density of labeled cells in Imc does not appear to change significantly. Scale bar = 200 nm.
labeled cells and Nv was found in PT ( - 8 6 % ) and TeO ( - 8 9 % ) , respectively. The lowest decrease (difference between hatching and 6 days: P < 0.01) was found in TeO ( - 4 5 % ) for the number of labeled cells and in nBOR ( - 5 4 % ) for Nv.
As shown in Fig. 13, percentage of labeled cells as com-pared to total cell number generally decreased from hatching to 6 days. The maximum decrease was observed in PT. Compara-ble decreases were observed in GLv, LA, and TeO. No changes were found in nBOR and Ipc.
The shape factor generally did not significantly change ex-cept for PT where it decreased from hatching to the adult stage (P < 0.001).
Distribution of GABA-LI in the optic tectum of adult pigeons with early unilateral retinal removal
Pigeons which had the left retina removed on the day of hatch-ing were examined at the adult stage in order to determine the distribution of GABA-LI in the TeO contralateral to the operated eye and to compare it to that observed in the TeO contralateral to the persisting retina. The latter was almost indistinguishable from that found in normal animals of the same age (Fig. 11). Differences in distribution of GABA-LI in the TeO contra-lateral to the removed retina were mainly evident in the tectal
layers above lamina Hi. As shown in Fig. 14, the main differ-ences can be summarized as follows:
1. A very weak neuropil labeling and a presence of numerous small labeled cells in superficial layers (designated as L2 in Fig. 14A) which on the other side of the brain showed dense neuropil labeling and few labeled cells (laminae Ila-c in Fig. 14B).
2. A large number of GABA-positive cells in those layers (L3 and laminae Ile-h in Fig. 14A) which on the other side of the brain showed few immunoreactive cells (laminae Ild-h in Fig. 14B). No major changes could be observed in layers Hi, IIj and III.
A similar distribution of GABA-LI was also observed after a shorter survival time, namely, in one pigeon which survived 3 weeks after retina ablation at hatching.
No significant differences in quantitative indices were found between the TeO contralateral to the persisting retina and the normal adult TeO. At the level of superficial tectal layers (from L, to Ilg in Fig. 14) contralateral to the operated eye, either the soma size or Nv (expressed by the filled square in Fig. 12) of la-beled cells were similar to those found in the normal TeO at
B
Fig. 9. Distribution of GABA-LI in corresponding regions of the dorsolateral optic tectum (TeO) at hatching (A) and at 9 days after hatching (B). Main changes occur in the superficial tectal layers, namely: (1) disappearance of stained cells in that layer (L, in A) which at 9 days is occupied by unstained optic fibers (layer I in B); (2) decrease in density of GABAir cell bodies in the tectal layers above lamina Hi; and (3) increase of the density of neuropil labeling in the most superficial laminae below layer I. Note that the pattern of GABA-LI at 9 days is similar to that found in adult pigeons. Scale bar = 50 jtm.
hatching. In Table 4, quantitative results from analysis of layers L,, L2, L3, Ile-f, and Ilg of the TeO contralateral to the re-moved retina as compared to the corresponding layers of the normal TeO at hatching are reported. For each layer, no signifi-cant differences in soma size and Nv were found between the TeO contralateral to the operated eye and TeO at hatching. Discussion
GABA-LI was observed in cell bodies as well as in neuropil and certain fiber tracts with a selective pattern of distribution which has been found to vary with posthatching ages. Main changes occur between 3 and 6-9 days when the adult pattern is reached. It generally corresponds to that previously described in corre-sponding areas of the adult pigeon brain (Domenici et al., 1988).
Before discussing in detail changes in GABA-LI distribution observed in visual areas during posthatching development,
cer-tain methodological aspects should be considered. With the an-tibody used in the present study, i.e. mAb 3A12, selective staining patterns had also been obtained in rats (Matute & Streit, 1986), insects (Meyer et al., 1986), and adult pigeons (Domenici et al., 1988). As shown by the present study, mAb 3A12 was able to reveal GABAir neurons in glutaraldehyde-fixed pigeon brains during posthatching development. Although information about the sensitivity to fixative during development are not presently available, the similar patterns of GABA-LI distribution obtained using either different percentages of glu-taraldehyde or different fixatives at each stage seems to rule out the possibility that observed changes could be attributed to dif-ferential fixation sensitivity of GABA-like material.
According to previous results (Domenici et al., 1988), differ-ent patterns of immunoreactivity obtained following addition of Triton X-100 to the primary antibody might depend on either an increased permeability of the tissue or the loss of immuno-reactive material, i.e. a decreased immunostaining in cell bodies.
• *
Fig. 10. GABAir cells with horizontally oriented processes in the superficial optic tectum (TeO) of a pigeon hatched after an incubation period of 12 days in ovo. Scale bar = 100 /im.
Retina
Relative densities of GABAir cell bodies and terminal-like ele-ments differ strikingly according to the posthatching stage. The adult distribution of GABA-LI in the pigeon retina is reached in about 1 week after hatching. As shown by previous results (Bagnoli et al., 1985; Porciatti et al., 1985) over the same pe-riod, the pigeon retina completes its maturation, i.e. receptor outer segments as well as synapses in OPL reach their adult form and first retinal responses to light can be recorded.
The adult distribution of GABA-LI obtained in this study generally agrees with that previously described in either pigeons or other nonmammalian species with immunohistochemical methods (Agardh et al., 1987; Brandon, 1985; Brecha, 1983; Karten & Brecha, 1983; Mosinger et al., 1986; Osborne, 1987) as well as local uptake following [3H]-GABA application (Marshall & Voaden, 1974; Pourcho et al., 1984; Yazulla et al., 1986; Watt etal., 1984).
As shown by our results, numerous GABAir perikarya are present in GCL and their density increase from hatching to
Table 4. Soma size and numerical density Nv of GABAir cells in tectal layers at hatching and in the TeO contralateral to early unilateral retina removal"
TeO at hatching
Tectal layers Soma size Nv
TeO contralateral to retinal removal
Soma size Nv L, L2 L-3 Ile-f Hg 37.10 ± 7.10 25.28 ± 8.36 33.90 ± 4.95 33.86 ± 5.09 22.79 ± 6.57 590.5 ± 14.5 925.3 ± 141.1 1069.9 ± 76.7 1008.2 ± 144.4 440.8 ± 145.2 40.91 ± 8.20 25.04 ± 8.02 29.63 ± 3.08 38.95 ± 6.50 30.32 ± 7.83 517.4 ± 77.6 1115.3 ± 287.9 1248.3 ± 206.7 1368.6 ± 253.6 273.7 ± 36.9 a
VaIues are expressed as mean ± S . D . Soma size was determined by measuring the cross-sectional area (/im2) of 50 cell bodies in each layer. Nv, expressed as number of cells x l O3/ m m3 of tissue, was determined in five 6-hour-old pigeons. Nv was also determined in four 180-day-old pigeons
LA
GLv
nBOR
TeO
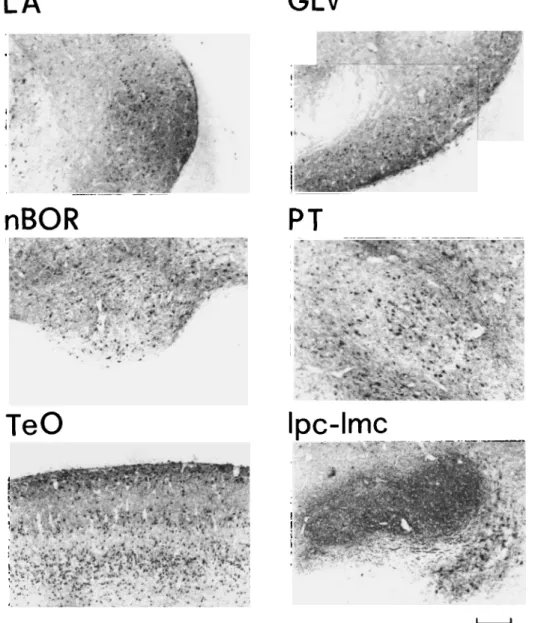
Ipc-lmc
Fig. 11. Patterns of GABA-LI in different visual regions at the adult stage. GLv: n. geniculatus lateralis, pars ventralis; Ipc: n. isthmi, pars parvocellularis; Imc: n. isthmi, pars magnocellularis; LA: n. lateralis anterior thalami; nBOR: n. basal optic root; PT: n. pretectalis; and TeO: optic tectum. Scale bar for Ipc = 300 urn, and for the other reigons, scale bar = 170 /im.
adult stage. Based on an absence of immunostaining observed in the optic fiber layer onto the tectal surface and the optic tract, GABAir somas found in GCL can be tentatively desig-nated as those of displaced amacrine cells. In this regard, no GADir cells have been demonstrated in GCL (Brecha, 1983) of pigeon retina and unilateral enucleation has no effects on GAD activity of the contralateral TeO (Henke & Fonnum, 1976). In addition, GABA-LI is not observed in the rat, rabbit, pigeon, and goldfish optic nerve (Osborne et al., 1986). Moreover, rat retinae from optic nerve sectioned eyes still reveal the presence of GABA-positive cells in GCL (Osborne, 1987). However, the presence of GAD and GABAir ganglion cells has been sug-gested in the retina of rabbits, monkeys (Mosinger & Yazulla, 1985; Mosinger & Yazulla, 1987; Nishimura et al., 1985; Yu et al., 1988), and larval salamanders (Yang & Yazulla, 1988). In addition, previous electrophysiological results suggest the
exis-tence of a direct inhibitory retino-tectal pathway in pigeons (Leresche et al., 1986). Therefore, it is evident that more defini-tive studies possibly combining GABA or GAD immunocyto-chemistry with the back-fill labelling of ganglion cells in the same retina are required to determine whether some GABAir ganglion cells are present in the pigeon retina.
Central visual regions
From hatching to 9 days, the size of GABAir cells gradually in-creases whereas their morphology does not change significantly except for PT where the round-shaped cells found at hatching become ovoid during the following days.
Interestingly, a reorganization of GABAir cell bodies and processes has been found after hatching and, in particular, dur-ing the first 9 days, simultaneously with changdur-ing size and shape
20a LA E <
I
0. ^200 200 Lioo Lo E a. £IOOJ <o
CO oJ GLv r2 0 0 " - • 9 .100Lo
200^ LU S100J nBOR r150 200^ .75 E £ 100. O CO oJ r150 Lo 200, E a. <o
CO 0. Ipc r150 200^ E 3. 75 I ^100. O CO Lo 0J TeO r700 v/—a .350 -• H 3 6 9 DAYS 180 3 6 9 DAYS 180Fig. 12. Size (cross-sectional area in square micrometers, open triangles) and numerical density Nv (number of cells x 103/mm3 of tissue, open squares) of labeled cell bodies in visual regions at different stages. In F, the filled square refers to Nv of labeled cells in TeO of adult pigeons with early unilateral retina removal. Each point represents the mean ± S.D. Five pigeons from hatching to 9 days, four 180-day-old pigeons, and four pigeons with early retina removal were used. H: hatching.
of the examined nuclei, changes in the density of GABA-posi-tive cells and processes occur. As shown by previous results over the same period, the pigeon visual system completes its matu-ration and primary visual areas are invaded by retinofugal ax-ons (Bagnoli et al., 1987).
The prominent variation of GABA-LI distribution consists of a progressive decrease in the density of immunostained peri-karya with an increase in the density of stained neuropil which
parallels the maturation of presumptive GABAergic cell bod-ies. Loss of GABAir cells is independent of the increased vol-ume of visual regions since we found a decreased Nv which is generally considered as a good index of the relative neuronal packing density. On the other hand, the decrease in the percen-tage of GABAir cells we have observed after hatching seems to indicate a loss of antigenicity at increasing ages.
50. Oj LA 100, 50. Oj GLv
Fig. 13. Percentage of labeled cells in visual regions at different stages. Values were calculated as ratio of mean values of labeled cell Nv to corresponding mean value of total cell Nv. H: hatching.
in the ventral hyperstriatum and the cerebellum of chicks (Cur-tis & Stewart, 1986) might be attributed to either cell death and/or phenotypic plasticity. Indeed, a complete disappearance of perikaryal labeling and a massive increase in immunostained terminal-like elements is found in Ipc. Similar results have been obtained with anti-GAD antibodies which show patterns of im-munoreactivity similar to those obtained in this study (Bagnoli et al., 19896). These results suggest the possibility that Ipc neu-rons which produce GABA during the early maturational stages may subsequently contain another neurotransmitter. Indeed, most Ipc cells of adult pigeons have been proposed to use
gly-cine as a neurotransmitter (Hunt et al., 1977; Streit et al., 1980; Wolfensberger et al., 1981). In addition, the presence of cho-linergic neurons evidentiated with antibodies to choline acetyl-transferase has been widely recognized in Ipc of fishes, amphibians, reptiles, and chickens (Brantley & Bass, 1988; Brauth et al., 1985; Desan et al., 1987; Ekstrom, 1987; Soren-son et al., 1989; Zottoli et al., 1988) as well as in Ipc of devel-oping pigeons (Bagnoli et al., 19896). The persisting GABA-LI staining of terminal-like dots can be tentatively derived from GABAir cells of Imc and/or deep tectal layers.
B
Li
f
g
h
nr
c d e f g hFig. 14. Distribution of GABA-LI in corresponding regions of the dorsolateral optic tectum (TeO) of an adult pigeon with unilateral retinal removal at hatching. GABA-LI in TeO contralateral to the removed retina (A) strikingly differs from that in TeO contralateral to the persisting retina (B). Main differences include a very weak neuropil staining as well as a persist-ence of numerous stained cells in the superficial tectal layers (L2, L3, and laminae Ile-h in A as compared to laminae Ila-h
in B). The pattern of GABA-LI in deafferented TeO is similar to that found in normal animals immediately after hatching. Scale bar = 50 jtm.
and processes reach the adult pattern around the time when the anatomical and functional maturation of the retino-tectal sys-tem is completed (Bagnoli et al., 1987). The fact that the dis-tribution of GABAir perikarya and processes in the superficial tectal layers is modified during the early period after hatching suggests a role of incoming ganglion cell axons on the matura-tion of putative GABAergic systems. From hatching to 9 days not only do GABAir cells decrease in density but also a popu-lation of GABAir cell bodies that is present at hatching in layer I disappears and is replaced at about 6-9 days by superficial ret-inal fibers. This transient population is composed of cells with processes that are most clearly seen in animals with shorter in-cubation period in ovo. In the developing cerebral cortex of cats, transient cells containing peptide immunoreactivity have been described and they have been shown to disappear while the white matter emerges (see Parnavelas & Cavanagh, 1988). On the other hand, glial cells, which are known to possess a high-affinity transport system for GABA, have been demonstrated
at hatching in the stratum opticum of the chicken TeO (Van-selow et al., 1989).
A correlation between invasion by retinal afferents and ar-rangements of putative GABAergic systems is supported by the effects induced by early retinal removal on the adult distribu-tion of GABA-LI in the contralateral TeO. As shown in a pre-vious study, retina removal has marked effects on tectal organization in pigeons (Bagnoli et al., 1989a). If performed immediately after hatching, this procedure results in a dramatic tectal shrinkage consequent to a reduction of the superficial neuropil with an associated decrease in cell number. These ef-fects on tectal organization are secondary to the complete loss of retinal ganglion cell projections upon the superficial tectal layer.
Results from this study indicate that retinal deafferentation has marked effects on the normal pattern of GABA-LI within the superficial tectal layers. In fact, retinal ablation results in an increased density of GABAir cells in the adult TeO which
shows a pattern of GABA-LI comparable to that found in the normal TeO at the early stages. A similar distribution of GABA-LI was also observed shortly following retina removal, thus excluding the possibility of a long-term progressive atro-phy. Modifications of GABA-LI pattern found at the level of the superficial tectal layers can be explained on hypothetical grounds by advocating the possibility that incoming retinal fibers may play a role in regulating the laminar distribution of GABAir cells which retain their immature organization and density when the contralateral retina is early removed. Observed changes are likely to reflect an abnormal maturation of puta-tive GABAergic systems induced by removing the retina before ganglion cell axons completely invade the superficial tectal layers (Bagnoli et al., 1987). In mammals, early retinal ablation has been shown to interfere with the normal development of GABAergic neurons in the visual cortex causing a reduction in number of GABAir cells (Hendry & Jones, 1986) and axon ter-minals (Ribak & Robertson, 1986). On the other hand, tran-synaptic phenomena may also explain changes in distribution of GABA-LI following retinal deafferentation, especially given the lack of convincing evidence of a retinal GABAergic contri-bution. Examples of transynaptic modifications in peptide-like immunoreactivity have been previously reported in SNC (Kess-ler et al., 1981; Lewis et al., 1981; Schutzberg et al., 1978). Moreover, transneuronal effects of early eye removal on rat geniculo-cortical projection cells have been shown (Jeffery e t a l . , 1984).
Acknowledgments
The authors wish to thank A. Bertini, B. Margheritti, C. Pucci, and M. Vaglini for excellent technical assistance. Our thanks are also due to Dr. V.P. Bingman for revising the manuscript and to Professor W. Hodos for critical comments. This work was supported by Consiglio Nazionale delle Ricerche (Grant Ctr. 88.02050.04) and Ministero della Pubblica Istruzione (40% and 60%, 1987-1988). Software modules for the quantitative image analysis were elaborated by Dr. C. Murari, Dr. P. Lugli, and C. Orsini — supported in part by a special research project on "Biotechnology and Bioinstrumentation" of the Consiglio Nazionale delle Ricerche (Grant Ctr. 89.00131.70).
References
AGARDH, E., BRUUN, A., EHINGER, B., EKSTROM, P., VAN VEEN, T. &
Wu, J.Y. (1987). Gamma aminobutyric acid and glutamic acid decarboxylase immunoreactive neurons in the retina of different ver-tebrates. Journal of Comparative Neurology 258, 622-630.
BAGNOLI, P., CASINI, G., FONTANESI, G. & SEBASTIANI, L. (1989).
Re-organization of visual pathways following posthatching removal of one retina in pigeons. Journal of Comparative Neurology 288, 512-527.
BAGNOLI, P., PORCIATTI, V., FONTANESI, G. & SEBASTIANI, L. (1987).
Morphological and functional changes in the retinotectal system of the pigeon during the early posthatching period. Journal of Com-parative Neurology 256, 400-411.
BAGNOLI, P., ERICHSEN, J.T., FONTANESI, G. & ALESCI, R. (19896).
Modifications in the distribution of neuroactive substances in devel-oping visual structures of the pigeon brain. Society for Neuroscience Abstracts 15, 1213.
BAGNOLI, P., PORCIATTI, V., LANFRANCHI, A. & BEDINI, C. (1985).
De-veloping pigeon retina: light evoked responses and ultrastructure of outer segments and synapses. Journal of Comparative Neurology 235, 384-394.
BRANDON, C. (1985). Retinal GABA neurons: localization in vertebrate
species using an antiserum to rabbit brain glutamate decarboxylase. Brain Research 344, 286-295.
BRANTLEY, R.K. & BASS, A.H. (1988). Cholinergic neurons in the brain of a teleost fish (Ponchthys notatus) located with a monoclonal an-tibody to choline acetyltransferase. Journal of Comparative Neu-rology 275, 87-105.
BRAUTH, S.E., KITT, C.A., PRICE, D.L. & WAINER, B.H. (1985).
Cho-linergic neurons in the telencephalon of the reptile Caiman crocodi-lus. Neuroscience Letters 58, 235-240.
BRECHA, N. (1983). A review of retinal neurotransmitters: histochem-ical and biochemhistochem-ical studies. In Neurochemhistochem-ical Anatomy, ed. EM-SON, P.C., pp. 85-129. New York: Raven Press.
CELIO, M. (1986). Parvalbumin in most -y-aminobutyric acid contain-ing neurons in the rat cerebral cortex. Science 231, 995-997.
COWAN, W.M., ADAMSON, L. & POWELL, T.P.S. (1961). An
experimen-tal study of the avian visual system. Journal of Anatomy 95, 545-563.
COYLE, J.T. & ENNA, S. J. (1976). Neurochemical aspects of the onto-genesis of GABAergic neurons and the rat brain. Brain Research 111, 119-133.
CUENOD, M., BAGNOLI, P., BEAUDET, A., RUSTIONI, A., WIKLUND, L.
& STREIT, P. (1982). Transmitter-specific retrograde labeling of neu-rons. In Cytochemical Methods in Neuroanatomy, ed. PALAY, V.C. & PALAY, S.L., pp. 17-44. New York: A.R. Liss.
CUENOD, M. & STREIT, P. (1983). Neuronal tracing using retrograde migration of labeled transmitter-related compounds. In Methods in
Chemical Neuroanatomy, ed. BJORKLUND, A. & HOKFELT, T., pp.
365-397. Amsterdam: Elsevier.
CURTIS, E.M. & STEWART, M.G. (1986). Development of 7-amino-butyric acid immunoreactivity in chick hyperstriatum ventral and cerebellum: light and electron microscopical observations. Develop-mental Brain Research 30, 189-199.
DESAN, P.H., GRUBERG, E., GREWELL, K. & ECKENSTEIN, F. (1987).
Cholinergic innervation of the optic tectum in the frog (Rana pipiens). Brain Research 413, 344-349.
DOMENICI, L., WALDVOGEL, H. J., MATUTE, C. & STREIT, P. (1988).
Dis-tribution of GABA-like immunoreactivity in the pigeon brain. Neu-roscience 25, 931-950.
EKSTROM, P. (1987). Distribution of choline acetyltransferase-immuno-reactive neurons in the brain of a cyprinid teleost (Phoxinus phox-inus L.). Journal of Comparative Neurology 256, 494-515.
HATTEN, M.E., FRANCOIS, A.M., NAPOLITANO, E. & ROFFLER-TARLOV,
S. (1984). Embryonic cerebellar neurons accumulate [3
H]-7-ami-nobutyric acid: visualization of developing 7-amiH]-7-ami-nobutyric acid uti-lizing neurons in vitro and in vivo. Journal of Neuroscience 4,
1343-1353.
HENDRY, S.H.C. & JONES, E.G. (1986). Reduction in number of immu-nostained GABAergic neurons in deprived-eye dominance columns of monkey area 17. Nature 320, 750-753.
HENKE, H. & FONNUM, F. (1976). Topographical and subcellular dis-tribution of choline acetyltransferase and glutamate decarboxylase in pigeon optic tectum. Journal of Neurochemistry 27, 387-391.
HUNT, S.P., STREIT, P., KUNZLE, H. & CUENOD, M. (1977).
Character-ization of the pigeon isthmotectal pathway by selective uptake and retrograde movement of radioactive compounds and by Golgi-like horseradish peroxidase labeling. Brain Research 129, 197-212. JEFFERY, G. (1984). Transneuronal effects of early eye removal on
geniculo-cortical projection cells. Developmental Brain Research 13, 257-263.
JONG, Y.J., THAMPY, K.G. & BARNES, E.M., JR. (1986). Ontogeny of
GABAergic neurons in chick brain: studies in vivo and in vitro. De-velopmental Brain Research 25, 83-90.
KARTEN, H.J. & BRECHA, N. (1983). Localization of neuroactive sub-stances in the vertebrate retina: evidence for lamination in the in-ner plexiform layer. Vision Research 23, 1197-1205.
KARTEN, H.J. & HODOS, W.A. (1967). A Stereotaxic Atlas of the Brain of the Pigeon. Baltimore: Johns Hopkins University Press. KELLY, J.S. & DICK, F. (1976). Differential labeling of glial cells and
GABA-inhibitory interneurons and nerve terminals following the mi-croinjection of [/3-3H]-alanine, [3H]-DABA, and [3H]-GABA into single folia of the cerebellum. In Cold Spring Harbor Symposia on Quantitative Biology, Vol. XL. The Synapse. Cold Spring Harbor, New York, Cold Spring Harbor Laboratory, pp. 93-106.
Sub-stance P in principal sympathetic neurons: regulation by impulse ac-tivity. Science 214, 335-336.
KlSVARDAY, Z . F . , COWEY, A . , HODGSON, A . J . & SOMOGYI, P . (1986).
The relationship between GABA immunoreactivity and labeling by local uptake [3H]-GABA in the striate cortex of the monkey.
Ex-perimental Brain Research 62, 89-98.
LAUDER, J . M . , H A N , V.K.M., HENDERSON, P . , VERDOORN, T. &
TOWIE, A.C. (1986). Prenatal ontogeny of the GABAergic system in the rat brain: an immunocytochemical study. Neuroscience 19, 465-493.
LERESCHE, N., HARDY, O., AUDINAT, E. & JASSK-GERSCHENFELD, D.
(1986). Synaptic organization of inhibitory circuits in the pigeon's optic tectum. Brain Research 365, 383-387.
LEWIS, R.V., STERN, A.S., KILPATRJCK, D.L., GELBER, L.D., ROSSIER,
J., STEW, S. & UDENFRIEN, S. (1981). Marked increase in large en-kephalin-containing polypeptides in rat adrenal gland following de-nervation. Journal of Neuroscience 1, 80-82.
Lru, C , GRANDES, P., MATUTE, C , CUENOD, M. & STREIT, P. (1989).
Glutamate-like immunoreactivity revealed in rat olfactory bulb, hip-pocampus, and cerebellum by monoclonal antibody and sensitive staining method. Histochemistry 90, 427-445.
MARSHALL, J. & VOADEN, M. (1974). An autoradiographic study of the cells accumulating [3H]-GABA in the isolated retinas of pigeons
and chickens. Investigative Ophthalmology 13, 602-607. MATUTE, C. & STREIT, P. (1986). Monoclonal antibodies
demonstrat-ing GABA-like immunoreactivity. Histochemistry 86, 147-157. MAXWELL, M.H. (1978). Two rapid and simple methods used for the
removal of resins from 1.0-/im-thick epoxy sections. Journal of
Mi-croscopy 112, 253-255.
MCLAUGHLIN, B.J., WOOD, J.G., SAITO, K., ROBERTS, E. & Wu, J.-Y.
(1975). The fine structural localization of glutamate decarboxylase in developing axonal processes and presynaptic terminals of rodent cerebellum. Brain Research 85, 355-371.
MEYER, E.P., MATUTE, C , STREIT, P. & NASSEL, D.R. (1986). Insect
optic lobe neurons identifiable with monoclonal antibodies to GABA. Histochemistry 84, 207-216.
MOSINGER, J., STUDHOLME, K. & YAZULLA, S. (1986).
Immunocyto-chemical localization of GABA in the retina: a species comparison.
Experimental Brain Research 42, 631-644.
MOSINGER, J.L. & YAZULLA, S. (1985). Colocalization of GAD-like im-munoreactivity and [3H]-GABA uptake in amacrine cells of rabbit retina. Journal of Comparative Neurology 240, 396-406. MOSINGER, J.L. & YAZULLA, S. (1987). Double-label analysis of
GAD-and GABA-like immunoreactivity in the rabbit retina. Vision
Re-search 27, 23-30.
MUGNAINI, E. & OERTEL, W.H. (1985). An atlas of the distribution of GABAergic neurons and terminals in the rat CNS as revealed by GAD immunohistochemistry. In Handbook of Chemical
Neuro-anatomy: GABA and Neuropeptides in the CNS, ed. BJORKLUND,
A. & HOKFELT, T., pp. 436-608. Amsterdam: Elsevier.
MULLER, L.L. & JACKS, T.J. (1975). Rapid chemical dehydratation of samples for electron-microscopic examinations. Journal of
Histo-chemistry and CytoHisto-chemistry 23, 107-110.
NEALE, E.A., OERTEL, W.H., BOWERS, L.M. & WEISE, V.K. (1983).
Glutamate decarboxylase immunoreactivity and [3H]-GABA accu-mulation within the same neurons in dissociated cell cultures of ce-rebral cortex. Journal of Neuroscience 3, 376-382.
NISHIMURA, Y., SCHWARTZ, M.L. & RAKIC, P. (1985). Localization of
7-aminobutyric acid and glutamic acid decarboxylase in rhesus mon-key retina. Brain Research 359, 351-355.
OERTEL, W.H., SCHMECHEL, D.E. & MUGNATNI, E. (1983). Glutamic
acid decarboxylase (GAD): purification, antiserum production, im-munocytochemistry. In Current Methods in Cellular Neurobiology, ed. BARKER, J.L. & MCKELVY, J.F., pp. 63-110. New York: John Wiley.
OERTEL, W.H., SCHMECHEL, D.E., TAPPAZ, M.L. & KOPIN, I.J. (1981).
Production of a specific antiserum to rat brain glutamic acid decar-boxylase by injection of an antigen-antibody complex. Neuroscience 6, 2689-2700.
O'KUSKY, J. & COLONNIER, M. (1982). A laminar analysis of the num-ber of neurons, glia, and synapses in the visual cortex (area 17) of adult macaque monkeys. Journal of Comparative Neurology 210, 278-290.
OSBORNE, N.N. (1987). Neurone-glia relationship in the retina:
local-ization of GABA uptake and endogenous GFAP and GABA immu-noreactivities. In Glial-Neuronal Communication in Development and Regeneration, ed. ALTHANS, H.H. & SCEFERT, W., pp. 118-129. Berlin: NATO ASI Series, Springer-Verlag.
OSBORNE, N . N . , PATEL, S., BEATON, D.W. & NEUHOFF, V. (1986).
GABA neurons in retinas of different species and their postnatal de-velopment in situ and in culture in the rabbit retina. Cell and
Tis-sue Research 243, 117-123.
OTTERSEN, O.P., DAVANGER, S. & STORM-MATHISEN, J. (1987).
Glycine-like immunoreactivity in the cerebellum of rat and senegalese baboon
(Papio papio): a comparison with the distribution of GABA-like
immunoreactivity and with [3H]-glycine and [3H]-GABA uptake. Experimental Brain Research 66, 211-221.
PARNAVELAS, J.G. & CAVANAGH, M.E. (1988). Transient expression of neurotransmitters in the developing neocortex. Trends in
Neurosci-ence 11, 92-93.
PORCIATTI, V., BAGNOLI, P., LANFRANCHI, A. & BEDINI, C. (1985).
In-teraction between photoreceptors and pigment epithelium in devel-oping pigeon retina: an electrophysiological and ultrastructural study. Documenta of Ophthalmology 60, 413-419.
POURCHO, R.G., GOEBEL, D.J. & MCREYNOLDS, J . S . (1984).
Autora-diographic studies of [3H]-glycine, [3H]-GABA, and [3H]-muscimol uptake in the mudpuppy retina. Experimental Brain Research 39, 69-81.
REINER, A. & KARTEN, H.J. (1982). Laminar distribution of the cells of origin of the descending tectofugal pathways in the pigeon
(Columba livia). Journal of Comparative Neurology 204, 165-187.
RIBAK, C.E. & ROBERTSON, R.T. (1986). Effects of neonatal monocu-lar enucleation on the number of GAD-positive puncta in rat visual cortex. Experimental Brain Research 62, 203-206.
SCHUTZBERG, M . , LUNDBERG, J . M . , HOKFELT, T . , TERENIUS, L . , BRANDT, J., ELDE, R.P. & GOLDSTEIN, M. (1978). Enkephalin-like
immunoreactivity in gland cells and nerve terminals of the adrenal medulla. Neuroscience 3, 1169-1186.
SEGUELA, P., GEFFARD, M., BUUS, R.M. & L E MOAL, M. (1984).
An-tibodies against 7-aminobutyric acid: specificity studies and im-munocytochemical results. Proceedings of the National Academy of
Sciences of the U.S.A. 81, 3888-3892.
SOMOGYI, P., HODGSON, A.J., CHUBBIAN, W., PENIKE, B. & ERDEI, A .
(1985). Antisera to •y-aminobutyric acid, II: Immunocytochemical application to the central nervous system. Journal of
Histochemis-try and CytochemisHistochemis-try 33, 240-248.
SOMOGYI, P., KISVARDAY, Z.F., FREUD, T.F. & COWEY, A. (1984).
Char-acterization by Golgi impregnation of neurons that accumulate [3H]-GABA in the visual cortex of monkey. Experimental Brain Research 52, 295-303.
SORENSON, E.M., PARKINSON, D., DAHL, J . L . & CHIAPPINELLI, V.A.
(1989). Immunohistochemical localization of choline acetyltransfer-ase in the chicken mesencephalon. Journal of Comparative
Neurol-ogy 281, 641-657.
STORM-MATHISEN, J. (1975). High-affinity uptake of GABA in pre-sumed GABAergic nerve endings in rat brain. Brain Research 84, 409-427.
STORM-MATHISEN, J., LEKNES, A . L . , BORE, A.T., VAALAND, J.L.,
EDMINSON, P., HAUG, F.M.S. & OTTERSEN, O.P. (1983). First visu-alization of glutamate and GABAir neurons by immunocytochem-istry. Nature 301, 517-520.
STREIT, P., KNECHT, E. & CUENOD, M. (1980). Transmitter-related
retrograde labeling in the pigeon optic lobe; a high resolution auto-radiographic study. Brain Research 187, 59-67.
TEHRANI, M.H.J. & BARNES, E.M., J R . (1986). Ontogeny of GABA-receptor complex in chick brain: studies in vivo and in vitro.
De-velopmental Brain Research 25, 91-98.
VANSELOW, J., THANOS, S., GODEMENT, P., H E N K E - F A H L E , S. &
BON-HOEFFER, F. (1989). Spatial arrangement of radial glia and ingrowing retinal axons in the chick optic tectum during development.
Develop-mental Brain Research 45, 15-27.
WATT, C.B., Su, Y.T. & MAN-KIT LAM, D. (1984). Interactions between enkephalin and GABA in avian retina. Nature 311, 761-763. WEIBEL, E.R. & BOLENDER, P. (1973). Stereological techniques for
electron-microscopic morphometry. In Principles and Techniques of
Electron Microscopy, ed. HAYAT, M.A., pp. 237-296. New York:
Van Nostrand Reinhold.
structures on random sections. Journal Applied Physiology 17, 343-348.
WOLFENSBERGER, M . , REUBI, J . - C , C A N Z E K , V., REDWEK, U . , CURTIUS,
H . C H . & CUENOD, M. (1981). Mass-fragmentographic determina-tion of endogenous glycine and glutamic acid released in vivo from the pigeon optic tectum. Effect of electric stimulation of a midbrain nucleus. Brain Research 224, 327-336.
WOLFF, J.R. (1981). Evidence for a dual role of GABA as a synaptic transmitter and a promoter of synaptogenesis. In Amino-Acid
Neu-rotransmitters, ed. DEFEUDIS, F.V. & MANDEL, P., pp. 459-466. New
York: Raven Press.
WOLFF, J.R., BOTTCHER, H., ZETZSCHE, T , OERTEL, W.H. &
CHRON-WALL, B.M. (1984). Development of GABAergic neurons in rat visual cortex as identified by glutamate decarboxylase-like immuno-reactivity. Neuroscience Letters 47, 207-212.
YANG, C.-Y. & YAZULLA, S. (1988). Localization of putative GABAergic
neurons in the larval tiger salamander retina by immunocytochem-ical and autoradiographic methods. Journal of Comparative Neu-rology 277, 96-108.
YAZULLA, S., STUDHOLME, K.M. & Wu, J.Y. (1986). Comparative
dis-tribution of [3H]-GABA uptake and GAD immunoreactivity in goldfish retinal amacrine cells: a double-label analysis. Journal of Comparative Neurology 244, 149-162.
Yu, B.C.-Y., WATT, C.B., LAM, D.M.K. & FRY, K.R. (1988). GABA-ergic ganglion cells in the rabbit retina. Brain Research 439, 376-382.
ZOTTOLI, S.J., RHODES, K.J., CORRODI, J.G. & MUFSON, E.J. (1988).
Putative cholinergic projections from the nucleus isthmi and the nu-cleus reticularis mesencephali to the optic tectum in the goldfish (Carassius auratus): a combined horseradish peroxidase transport and choline acetyltransferase immunohistochemical analysis. Journal of Comparative Neurology 273, 385-398.