Adaptive and Reversible Resistance to
Kras Inhibition in Pancreatic Cancer Cells
The MIT Faculty has made this article openly available.
Please share
how this access benefits you. Your story matters.
Citation
Chen, Pan-Yu et al. "Adaptive and Reversible Resistance to Kras
Inhibition in Pancreatic Cancer Cells." Cancer Research 78, 4
(February 2018) © 2017 American Association for Cancer Research.
As Published
http://dx.doi.org/10.1158/0008-5472.can-17-2129
Publisher
American Association for Cancer Research (AACR)
Version
Author's final manuscript
Citable link
https://hdl.handle.net/1721.1/124410
Terms of Use
Creative Commons Attribution-Noncommercial-Share Alike
Adaptive and reversible resistance to Kras inhibition in
pancreatic cancer cells
Pan-Yu Chena,b,g,*, Mandar Deepak Muzumdara,c,d,h,*, Kimberly Judith Doransa, Rebecca
Robbinsa, Arjun Bhutkara, Amanda del Rosarioa, Philipp Mertinse,i, Jana Qiaoe, Anette Claudia Schafera, Frank Gertlera,b, Steven Carre, and Tyler Jacksa,b,f,1
aDavid H. Koch Institute for Integrative Cancer Research, Massachusetts Institute of Technology,
500 Main Street, Cambridge, MA 02139, USA
bDepartment of Biology, Massachusetts Institute of Technology, 77 Massachusetts Avenue,
Cambridge, MA 02139, USA
cHarvard Medical School, 25 Shattuck Street, Boston, MA 02115, USA
dDana-Farber Cancer Institute, 450 Brookline Avenue, Boston, MA 02115, USA
eProteomics Platform, Broad Institute of MIT and Harvard, 415 Main Street, Cambridge, MA
02142, USA
fHoward Hughes Medical Institute, Massachusetts Institute of Technology, Cambridge, MA 02139,
USA
gUniversity of California, San Francisco, Helen Diller Family Cancer Research Building, 1450
Third Street, San Francisco, CA 94158, USA
hDepartment of Genetics, Yale University School of Medicine, 333 Cedar Street, New Haven, CT
06510, USA
iProteomics Platform, Max Delbrück Center for Molecular Medicine in the Hemholtz Society and
Berlin Institute of Health, 13125 Berlin, Germany
Abstract
Activating mutations in KRAS are the hallmark genetic alterations in pancreatic ductal
adenocarcinoma (PDAC) and the key drivers of its initiation and progression. Longstanding efforts to develop novel KRAS inhibitors have been based on the assumption that PDAC cells are
addicted to activated KRAS, but this assumption remains controversial. In this study, we analyzed the requirement of endogenous Kras to maintain survival of murine PDAC cells, using an
inducible shRNA-based system that enables temporal control of Kras expression. We found that the majority of murine PDAC cells analyzed tolerated acute and sustained Kras silencing by adapting to a reversible cell state characterized by differences in cell morphology, proliferative kinetics, and tumor-initiating capacity. While we observed no significant mutational or
1To whom correspondence may be addressed. tjacks@mit.edu. Mailing address: 76-453, 500 Main Street, Cambridge, MA 02139,
HHS Public Access
Author manuscript
Cancer Res
. Author manuscript; available in PMC 2019 February 15. Published in final edited form as:Cancer Res. 2018 February 15; 78(4): 985–1002. doi:10.1158/0008-5472.CAN-17-2129.
A
uthor Man
uscr
ipt
A
uthor Man
uscr
ipt
A
uthor Man
uscr
ipt
A
uthor Man
uscr
ipt
transcriptional changes in the Kras-inhibited state, global phosphoproteomic profiling revealed significant alterations in cell signaling, including increased phosphorylation of focal adhesion pathway components. Accordingly, Kras-inhibited cells displayed prominent focal adhesion plaque structures, enhanced adherence properties, and increased dependency on adhesion for viability in vitro. Overall, our results call into question the degree to which PDAC cells are addicted to activated KRAS, by illustrating adaptive non-genetic and non-transcriptional
mechanisms of resistance to Kras blockade. However, by identifying these mechanisms, our work also provides mechanistic directions to develop combination strategies that can help enforce the efficacy of KRAS inhibitors.
Keywords
Pancreatic cancer; cell adhesion; cell signaling; protein tyrosine kinases; animal models of cancer; gene expression profiling; oncogenes; tumor suppressor genes; gene products as targets for therapy; novel mechanisms
INTRODUCTION
Pancreatic cancer, of which 85% is pancreatic ductal adenocarcinoma (PDAC), is an aggressive disease that is largely refractory to frontline therapy (1). Although recent advances in multi-agent chemotherapy have increased median survival in advanced disease, the 5-year survival rate for PDAC patients remains low at 8% (2–4), making PDAC the third leading cause of cancer death in the United States (2) and underscoring an urgent need for novel therapies with improved efficacy and reduced toxicity.
Genomic studies revealed that KRAS mutations are the hallmark genetic feature of PDAC (5–7). KRAS encodes a GTPase that regulates diverse cellular processes, including proliferation and survival. In cancer cells, somatic missense mutations render KRAS insensitive to GTPase-activating proteins, resulting in the accumulation of GTP-bound KRAS and hyperactive effector signaling (8). As oncogenic KRAS signaling potentially contributes to multiple facets of malignant transformation, its precise biological functions in cancer appear context-dependent and remain to be fully elucidated (9–12).
The high frequency of activating KRAS mutations implies that oncogenic KRAS may drive PDAC initiation and progression. Mouse models have demonstrated that mutant Kras expression in the mouse pancreas leads to the development of precursor pancreatic intraepithelial neoplasia (PanINs) and PDAC, confirming the role of oncogenic Kras in tumor initiation (9,13,14). In contrast, the requirement of KRAS for PDAC maintenance remains unresolved. RNA interference-mediated knockdown of endogenous KRAS in human cell lines demonstrated variable dependency of PDAC cells on KRAS for survival (15). Accordingly, gene expression profiling of human PDAC tumors revealed distinct molecular subtypes associated with varying KRAS dependencies (16). In established Kras-driven mouse PDAC tumors, the withdrawal of oncogenic Kras transgene expression resulted in rapid tumor regression, suggesting that sustained oncogenic Kras expression is essential for maintenance (9,11). Although the removal of oncogenic Kras is initially
A
uthor Man
uscr
ipt
A
uthor Man
uscr
ipt
A
uthor Man
uscr
ipt
A
uthor Man
uscr
ipt
detrimental, tumor relapse via doxycycline-independent expression of the oncogenic Kras transgene and Kras-independent bypass mechanisms was observed (17,18).
Since at least a subset of PDAC cells and tumors exhibit KRAS oncogene addiction, KRAS inhibition is a compelling therapeutic approach. Unfortunately, effective pharmacological KRAS inhibitors have not yet been developed (8). A deeper understanding of the essentiality of KRAS for tumor maintenance and the degree of KRAS inhibition required to impair PDAC cell survival could provide insights into the role of KRAS in PDAC and facilitate the development of KRAS-directed therapies. Given that resistance against single-agent targeted therapies frequently emerges after prolonged treatment (19,20), it is critical to preemptively strategize treatment methods to circumvent resistance. Studies of cancer therapy resistance have led to the general conception that resistance often arises from the selection of pre-existing rare cells that have acquired resistance-conferring genetic alterations (20–22). In this case, combined inhibition of multiple nodes of a single pathway or simultaneous targeting of distinct pathways can be effective. However, recent studies have suggested that non-mutational mechanisms of drug resistance are also possible (19,20,23,24), for which intermittent dosing of the same inhibitor could induce a re-treatment response (25,26). We assessed the requirement of oncogenic KRAS for PDAC maintenance and potential resistance mechanisms to KRAS inhibition by analyzing the consequence of acute and sustained Kras knockdown in murine PDAC cells in vitro and in vivo. Additionally, we conducted global gene expression and phosphoproteomic profiling of PDAC cells before and after Kras knockdown to decipher mechanisms that mediate escape from Kras oncogene addiction. Through these analyses, we defined an adaptive and reversible state of Kras inhibition marked by prominent alterations in cell morphology, proliferative kinetics, and cell signaling. Importantly, our work revealed candidate targets for rational combination therapies with novel KRAS inhibitors in PDAC patients.
MATERIALS AND METHODS
Cell lines and culture conditionsA, B, and D parental cells were derived from three distinct primary pancreatic tumors from ; Pdx1-CreER; KrasLSL-G12D/+; p53flox/flox mice treated with tamoxifen (Sigma) to induce oncogenic KrasG12D activation and biallelic p53 inactivation in the pancreas (13).
Established human PDAC cell lines were obtained from the Broad Institute Cancer Cell Line Encyclopedia, sourced from DSMZ-Germany (8988T) American Type Culture Collection (ATCC) (PANC-1). Identity was authenticated by DNA fingerprinting by the Broad Institute. All cell lines were maintained in DMEM (Corning Cellgro) supplemented with 10% fetal bovine serum (Hyclone) and penicillin/streptomycin and tested negative for mycoplasma by PCR testing.
For inducible-shRNA experiments, doxycycline (DOX, Sigma) was used at 1 μg/mL in culture media and replaced every 2-3 days. Cell viability was analyzed after 4-5 days of DOX treatment using the CellTiter-Glo luminescence assay (Promega), which measures cellular ATP levels as a surrogate for cell number and growth. Luminescence was read on a Tecan M2000 Infinite Pro plate reader. Cells were imaged with a Nikon Eclipse TE2000-U
A
uthor Man
uscr
ipt
A
uthor Man
uscr
ipt
A
uthor Man
uscr
ipt
A
uthor Man
uscr
ipt
light microscope and SPOT RT3 camera. For iTRAQ, cells were grown on 15-cm plates and harvested when 70-80% confluent for lysis. For SILAC labeling, cells were passaged in heavy, medium, or light media for 7-8 population doublings, and carefully maintained at optimal confluence (70-80%) during passaging before lysis.
Inducible shRNA retroviral constructs
A, B, and D cell lines were sequentially transduced with retroviral constructs for rtTA3 (MSCV-rtTA3-hygro; Fig. 1A) and constructs for inducible shKras (27) and shLuc
expression, adapted from the TGMP (TRE-GFP-miR30-PGK-PuroR) inducible knockdown system previously described by G. Hannon, S. Lowe, and colleagues (28). 8988T and PANC-1 cells were transduced with an all-in-one (contains rtTA and TRE-shRNA) inducible knockdown lentiviral vectors (pLKO-Tet-ON) containing shLACZ.1650 and shKRAS.407 hairpins, which were previously validated (29) and generously provided by Dr. William Hahn. For double knockdown experiments, shFAK and shGpr56 were cloned into a TGMB (TRE-GFP-miR30-PGK-BlastR) vector. mir30-based shRNA 97-mers were synthesized (Life Technologies) for cloning. The individual shRNAs were cloned into the TGMP and TGMB vectors using XhoI and EcoRI restriction enzyme sites. High-fidelity restriction enzymes and T4 ligase (New England BioLabs) were used in recommended buffers. The sequences of the shRNA 22-mers and primers used for shRNA cloning are listed in Supplementary Table 1. MSCV-IRES-GFP and MSCV-KrasG12D-IRES-GFP retroviral vectors were used for overexpression studies to confirm on-target Kras knockdown.
Retroviral and lentiviral production and transduction
For retroviral infections, retroviral backbone and pCL-Eco (for mouse cells) were
transfected into 293T cells with TransIT-LT1 (Mirus Bio). For lentiviral infections, lentiviral backbone, packaging vector (delta8.2 or psPAX2), and envelope (VSV-G) were transfected. Supernatant was collected at 48 and 72 hours and applied to target cells with 8 μg/mL polybrene for transduction. Transduced cells were treated with 2 μg/mL puromycin (Life Technologies), 400 μg/mL hygromycin B (Roche), or 10 μg/mL blasticidin S (Life Technologies) for 3-7 days, as appropriate, for antibiotic selection. To generate single cell clones from the transduced cells, we sorted one cell per well into 96-well plates using a FACSAria II (Becton Dickinson) FACS sorter.
In vitro growth and adherence assays
For growth curves, 250-1000 cells were plated on day 0 and grown for five days in culture. 4-5 replicates for each cell line per day were assessed for cell viability by CellTiter-Glo (Promega). Cell viability results were normalized to luminescence at day 0. For growth curves measured in cell number rather than luminescence, 10,000 cells per well were plated in 6-well plates on day 0 in three replicates, and cells were trypsinized and counted every day. Low-density colony forming assays were performed by plating 1000 cells into 6-well plates in triplicate and staining with 0.5% crystal violet 7-10 days after plating. Cells for clonal efficiency assay were grown in 96-well dishes for 21 days with media
supplementation with or without DOX every 2-3 days. Clones were stained with crystal violet and absorbance at 540 nm quantified following solubilization with Sorensen’s buffer (0.1M sodium citrate, 50% ethanol, pH 4.2). 3D cultures were established by plating
A
uthor Man
uscr
ipt
A
uthor Man
uscr
ipt
A
uthor Man
uscr
ipt
A
uthor Man
uscr
ipt
250-500 cells onto a growth factor-reduced matrigel (Corning) layer, allowing cell migration into matrigel for 4-6 hours. Cells were grown in complete media for 12 days prior to analysis. For adherence assay, single cell suspensions were generated and 5000-10,000 cells were plated in 100 uL media into 96-well plates. After one hour, media was aspirated, and cell viability of remaining adhered cells was analyzed by CellTiter-Glo and compared to cell viability of suspension cells immediately at time of plating. To disrupt actin cytoskeleton, cells were treated with latrunculin B (632 nM) for 1 hour prior to imaging. For anoikis assay, cells were grown as single cell suspension for 48 hours on poly-HEMA (Sigma) coated plates or commercial low-adherence plates (Corning) prior to protein collection for immunoblotting. To determine response to matrigel, suspension cells were assessed for cell viability using CellTiter-Glo.
Immunoblotting
Cells were lysed with ice-cold RIPA buffer (Pierce), supplemented with 0.5 μM EDTA and Halt protease and phosphatase inhibitors (Thermo Scientific), rotated at 4°C for 15-30 minutes to mix, and centrifuged at maximum speed for 15 minutes to collect whole cell lysates. For total pY analysis, cells were lysed by freezing the cell pellet in RIPA buffer (with EDTA and inhibitors) at −80°C overnight to best preserve phosphorylation. Protein concentration was measured with the BCA protein assay (Pierce). 30 μg of total protein per sample was loaded into 4-12% Bis-Tris gradient gels (Life Technologies) and separated by SDS-PAGE. Proteins were transferred to nitrocellulose (for fluorescence detection) or PVDF (for chemiluminescent detection) membranes. The following antibodies were used for immunoblotting: mouse anti-HSP90 (BD #610418, 1:10,000), rabbit anti-β-tubulin (CST 2128, 1:1000), mouse anti-KRAS (SCBT sc-30, 1:200), mouse anti-phosphotyrosine (Millipore 4G10, 1:1000), mouse anti-paxillin (BD #610052, 1:1000), mouse anti-vinculin (Sigma-Aldrich V9131, 1:800), rabbit anti-FAK (Millipore 06-543, 1:1000), rabbit anti-FAK pY397 (Invitrogen 44-624G, 1:1000), rabbit anti-pERK1/2(T202/Y204) (CST 4370, 1:1000), mouse anti-ERK1/2 (CST 9107, 1:1000), rabbit anti-CC3(Asp175) (CST 9664, 1:1000), and rabbit anti-cleaved PARP(Asp214) (CST 9541, 1:1000). HSP90 and β-tubulin were used as loading controls. Primary antibodies were detected with fluorescent-conjugated (LI-COR) or HRP-conjugated (BioRad) secondary antibodies for fluorescent (LI-COR) or chemiluminescent detection (Amersham), respectively. For the phospho-RTK array, 500 μg protein in 250 μl lysis buffer for each sample was incubated with the membrane, and experiment was performed following the protocol provided (R&D Systems mouse proteome profiler phospho-RTK array kit #ARY014).
Immunofluorescence
For immunofluorescent staining of focal adhesion structures, 50,000 (for D line) or 100,000 (for B line) cells were plated on cover slips in 6-well plates, and were grown for 2 days before paraformaldehyde fixation. The fixed cells were then stained with mouse anti-paxillin (BD #610052, 1:500) or mouse anti-vinculin (Sigma-Aldrich V9131, 1:800), along with DAPI (Life Technologies) and Alexa Fluor 555 Phalloidin (ThermoFisher Scientific). The secondary antibody used was donkey anti-mouse IgG (H+L) Alexa Fluor 647 conjugate (ThermoFisher Scientific, 1:250). The stained cells were imagined with Applied Precision
A
uthor Man
uscr
ipt
A
uthor Man
uscr
ipt
A
uthor Man
uscr
ipt
A
uthor Man
uscr
ipt
DeltaVision Spectris Imaging microscope, and images were deconvoluted with the Softworx deconvolution software.
Focal adhesion analysis and quantitation
Cover slips were coated with 0.1 mg/ml rat tail Collagen I (Corning) diluted in PBS for 1 hour at 37°C followed by 20 μg/ml Fibronectin (Sigma) diluted in PBS for 1 hour at 37°C. Cells were seeded in a density of 60,000 cells per cover slip. Cells were fixed 24 hours after seeding with 4% PFA in PBS and washed twice in 30mM Glycine/PBS for 5 minutes. Cells were permeabilized using 0.2% Triton/PBS for 5 minutes and subsequently washed with TBST followed by blocking in 5% milk powder/TBST for 1 hour at room temperature. Primary antibodies (anti-Vinculin, clone hVin-1, Sigma or anti-Paxillin, clone 349/Paxillin, BD Biosciences) were diluted 1:200 in blocking solution and incubated for 45 minutes at 37°C. Afterwards, the cells were washed 3× for 5 min with blocking solution and then incubated with secondary antibodies (anti-mouse Alexa594 or anti-rabbit Alexa647, Invitrogen) diluted 1:200 and Hoechst diluted 1:1000 in blocking solution for 45 minutes at 37°C. Next, the cells were washed 3× for 5 min in TBST, 2× in PBS and once in MilliQ water before mounting. Cells were imaged with an inverted Microscope (TE2000, Nikon) with a 60× Plan Apo 1.40 oil objective and a Photometric Coolsnap HQ camera.
Focal adhesion analysis was performed using ImageJ (Wayne Rasband, National Institutes of Health, Bethesda, MD). Briefly, images were background subtracted using the rolling ball method and then thresholded to generate a binary image. Cell areas without focal adhesions were masked manually and the focal adhesions were analyzed using the “Analyze Particles” tool and uploaded into the ROI manager. ROIs were overlaid with the original image to check for detection accuracy. Wrongly detected focal adhesions were deleted and depending on the stringency of the thresholding the dilate function was applied to the binary image. Focal adhesion size and numbers were analyzed. To determine the cell area the cells were outlined and the total area was measured. This measure was used to normalize the number of focal adhesions per cell area. For each condition, eight cells and at least 289 individual focal adhesions were analyzed.
To analyze the percentage of cells with focal adhesions the maximum intensity of all images were set to a value of 5,000 and cells were categorized into plus focal adhesions or non-focal adhesions manually. 12 images per conditions were analyzed.
RNA isolation and RNA-sequencing (RNA-Seq) analysis
RNA was isolated from PDAC cells using TRIzol (Life Technologies). cDNA libraries were prepared using an Illumina TruSeq sample preparation kit with indexed adaptor sequences and polyA selection. Sequencing was performed on an Illumina HiSeq 2000 instrument to obtain single-end 40-nt reads. Gene expression data has been deposited into the Gene Expression Omnibus (GEO) with accession number GSE95478. All reads that passed quality metrics were mapped to the UCSC mm9 mouse genome build (http://genome.ucsc.edu/) using RSEM (v1.2.12) (http://deweylab.github.io/RSEM/). For pairwise differential expression analyses, data normalization (MedianNorm) and differential analyses between experimental conditions were performed using EBSeq v1.4.0 (http://bioconductor.org/
A
uthor Man
uscr
ipt
A
uthor Man
uscr
ipt
A
uthor Man
uscr
ipt
A
uthor Man
uscr
ipt
packages/release/bioc/html/EBSeq.html). All RNA-Seq analyses were conducted in the R Statistical Programming language (http://www.r-project.org/). Unsupervised clustering was performed using a Pearson correlation based pairwise distance measure. Heat maps were generated using the Heatplus package in R.
High-resolution signature analyses between clones within each cell line were performed using a blind source separation methodology based on Independent Component Analysis (ICA) (30). RSEM generated estimated expression counts were upper-quartile normalized to a count of 1000. The R implementation of the core JADE algorithm (Joint Approximate Diagonalization of Eigenmatrices) (31) was used along with custom R utilities. Signatures were visualized using the sample-to-signature correspondence schematic afforded by Hinton plots where colors represent directionality of gene expression (red relatively upregulated, blue relatively downregulated within each signature) and the size of each rectangle
quantifies the gene expression correlation of a given sample (row) with the gene expression pattern identified by the signature (column). Each signature is two-sided, allowing for identification of upregulated and downregulated genes for each signature within each sample. Biologically relevant and statistically significant signatures were identified using a Mann-Whitney U test.
For lncRNA analysis reads were mapped to the mouse genome (release NCBIM37) using Tophat v2.0.4 and gene annotation from Ensembl (release 66, ensemble.org). Differential analyses between Dox and no DOX conditions were performed using Cufflinks v2.0.2. and presented in the format detailed in the cufflinks manual (http://cole-trapnell-lab.github.io/ cufflinks/cuffdiff/).
Gene Set Enrichment Analyses (GSEA) were carried out using the pre-ranked mode using log2 fold-change values (for pairwise analyses) or standardized signature correlation scores (for ICA signatures) with default settings (32). Network representations of GSEA results were generated using EnrichmentMap (http://www.baderlab.org/Software/EnrichmentMap) for Cytoscape v3.3.0 (http://www.cytoscape.org) with p<0.05 and FDR<0.25 as cut-offs. Each circle represents a gene set with circle size corresponding to gene set size and intensity corresponding to enrichment significance. Red is upregulated and blue is downregulated. Each line corresponds to minimum 50% mutual overlap with line thickness corresponding to degree of overlap. Cellular processes for gene set clusters were manually curated.
Candidate point mutations in RNA-Seq datasets were called using a pipeline based on the GATK Toolkit (https://software.broadinstitute.org/gatk/). Transcriptomic reads were mapped (to mm9) using the Tophat (v2.0.4) spliced aligner and subjected to local realignment and score recalibration using the GATK Toolkit. Mutations were called in LT DOX samples (individual) against No DOX samples (pooled for individual parental lines) with a minimum base quality threshold of 30. Minimum coverage levels of 8X (no-DOX) and 14X (DOX) were required to evaluate a locus for mutations. Variants were filtered to retain those with representation on both strands. No exonic mutations were found to recur across different pools, and variants found to be common between two samples with the same pool did not exceed a 50% variant frequency threshold. The DOX versus no-DOX variant frequency for
A
uthor Man
uscr
ipt
A
uthor Man
uscr
ipt
A
uthor Man
uscr
ipt
A
uthor Man
uscr
ipt
these within-pool recurrent variants did not exceed 31%. Genomic annotations were performed using ANNOVAR (http://www.openbioinformatics.org/annovar/).
Computer code for RNA-Seq independent component analyses is available upon request. Other software tools for RNA-Seq analyses, website source, and version numbers are listed above. Gene expression data are archived in GEO with accession number GSE95478.
Quantitative RT-PCR
RNA was reverse transcribed using High-Capacity cDNA Reverse Transcription Kit (Applied Biosystems). Quantitative PCR (qPCR) was performed using Taqman probes (Applied Biosystems). Ct values were measured by a LightCycler 480 Real-Time PCR
System (Roche) and relative expression (normalized to TBP or actin) was calculated using the ΔΔCt method.
Drug treatments
PF562271, PF573228, AZD0530, dasatinib, and SU6656 were purchased from Selleck Chemical. All compounds were diluted to 10 mM stock concentration in DMSO. To generate dose-response curves, cells (250-500 for D clones, 750-1000 for B clones) were plated in 96-well white plates (Perkin Elmer) in 100 μL of media and incubated overnight. 100 μL of drug at 2X final concentration was added to each well in triplicate for each cell line and dose. Cell viability was determined at 72 hours using CellTiter-Glo (Promega). Percent viability was calculated for each dosed well compared to solvent controls (DMSO) and plotted against log10[Dose] (M). For dose-response curves, each replicate for each cell line and dose was plotted along with curve-fit regression for three-component inhibitor response (Prism).
Subcutaneous tumor transplant in immunocompromised mice
All animal studies were approved by the MIT Institutional Animal Care and Use Committee. Cells were transplanted to form tumors in NOD/SCID mice (Taconic) via subcutaneous injections. 100 μL of cell suspensions of varying concentrations in cold PBS were injected per tumor to determine tumor-forming capacity and tumor growth kinetics in the context of gene knockdown. Tumor formation was monitored over time by visual observation. Tumor-initiating cell number was calculated based on limiting dilutions of transplanted cells using web-based ELDA software (http://bioinf.wehi.edu.au/software/elda/).
Tumor growth was followed by caliper measurement or luciferase imaging. Caliper measurement was done in 3-4 day intervals. Tumor volume was calculated from caliper measurements using the modified ellipsoid formula: (length)×(width)2/2. Because the PDAC cells are engineered to express MSCV-Luciferase-IRES-GFP (plasmids were retrovirally transduced like the inducible shRNA constructs), tumors were measured based on luminescence using IVIS spectrum optical imaging (Xenogen corporation).
Bioluminescence imaging by IVIS was done in 3-4 day intervals by injecting 100 μl of 30 mg/ml luciferin per mouse and imaging 10 minutes post-injection. The level of
bioluminescence in radiance was analyzed by Living Image software (Perkin Elmer). Cell
A
uthor Man
uscr
ipt
A
uthor Man
uscr
ipt
A
uthor Man
uscr
ipt
A
uthor Man
uscr
ipt
lines were made from subcutaneous tumors by dissociation using a collagenase IV (Worthington), dispase, trypsin, and DNAse cocktail in HEPES-buffered HBSS.
Phosphotyrosine analysis via LC-MS/MS (iTRAQ)
Cells were lysed in 8 M urea (Sigma) and were quantified using BCA assay (Pierce). Proteins were reduced with 10 mM dithiothreitol (Sigma) for 1 hour at 56°C and then alkylated with 55 mM iodoacetamide (Sigma) for 1h at 25°C in the dark. Proteins were then digested with modified trypsin (Promega) at an enzyme/substrate ratio of 1:50 in 100 mM ammonium acetate, pH 8.9 at 25°C overnight. Trypsin activity was halted by addition of acetic acid (99.9%, Sigma) to a final concentration of 5%. After desalting using a C18 Sep-Pak Plus cartridge (Waters), peptides were lyophilized and store at −80°C. Peptides were labeled with iTRAQ 4plex (AB Sciex) as previously described (33). Lyophilized samples (400 μg) were labeled with 1 aliquot of iTRAQ label per peptide sample. Peptides were dissolved in 30 μL of 500 mM triethylammonium bicarbonate, pH 8.5, and each iTRAQ reagent was dissolved in 70μL of isopropanol. Each peptide sample was combined with one of four iTRAQ labels, vortexed, and incubated for 1 hour at 25°C. The labeled peptides were then combined and concentrated to completion.
For immunoprecipitation, protein G agarose (60 μL, Millipore) was incubated with anti-phosphotyrosine antibodies (12 μg 4G10 (Millipore), 12 μg PT66 (Sigma), and 12 μg PY100 (CST)) in 400 μL of IP buffer (100mM Tris, 100mM NaCl, and 1% Nonidet P-40, pH 7.4) for 8 hours at 4°C with rotation. The antibody conjugated protein G was washed with 400 μL of IP buffer. The iTRAQ labeled peptides were dissolved in 400 μL IP buffer and the pH was adjusted to 7.4. The iTRAQ labeled peptides were then incubated with the antibody conjugated protein G overnight at 4°C with rotation. The agarose was washed with 400 μL IP buffer followed by four rinses with 400 μL rinse buffer (100 mM Tris, pH 7.4). Peptides were eluted with 70 μL of 100 mM glycine, pH 2 for 30 minutes at 25°C. Offline
immobilized metal affinity chromatography (IMAC) was used to further enrich for phosphotyrosine peptides (33).
Peptides were then loaded on a pre-column and separated by reverse phase HPLC using an EASY- nLC1000 (Thermo) over a 140 minute gradient before nanoelectrospray using a QExactive mass spectrometer (Thermo). The mass spectrometer was operated in a data-dependent mode. The parameters for the full scan MS were: resolution of 70,000 across 350-2000 m/z, AGC 3e6, and maximum IT 50 ms. The full MS scan was followed by MS/MS for the top 10 precursor ions in each cycle with a NCE of 32 and dynamic exclusion of 30 s. Raw mass spectral data files (.raw) were searched using Proteome Discoverer (Thermo) and Mascot version 2.4.1 (Matrix Science). Mascot search parameters were: 10 ppm mass tolerance for precursor ions; 0.8 Da for fragment ion mass tolerance; 2 missed cleavages of trypsin; fixed modification were carbamidomethylation of cysteine and iTRAQ 4plex modification of lysines and peptide N-termini; variable modifications were methionine oxidation, tyrosine phosphorylation, and serine/threonine phosphorylation. Only peptides with a Mascot score greater than or equal to 25 and an isolation interference less than or equal to 25 were included in the quantitative data analysis. The average false discovery rate was 0.0029 (ranging from 0.0013-0.0041). iTRAQ quantification was obtained using
A
uthor Man
uscr
ipt
A
uthor Man
uscr
ipt
A
uthor Man
uscr
ipt
A
uthor Man
uscr
ipt
Proteome Discoverer and isotopically corrected per manufacturer’s instructions. The iTRAQ values were normalized to the mean relative protein quantification ratios obtained from a total protein analysis. For the total protein analysis, 0.2% of the supernatant from the phosphotyrosine peptide immunoprecipitation was analyzed via LC-MS/MS. This analysis serves as a loading control as it gives quantitation for the most abundant non-phosphorylated peptides. The phosphotyrosine LC-MS/MS analysis was performed three times with
different sample preparations. Only tyrosine phosphorylation sites that were detected in at least two independent experiments were considered for further analysis.
SILAC analysis
SILAC-labeled cells were cultured at a concentration of 106 cells/mL in DMEM medium supplemented with 10% FBS and penicillin/streptomycin, and either normal L-lysine (K0) and L-arginine (R0), or medium-labeled D4- lysine (K4) and 13C6- arginine (R6), or
heavy-labeled 13C6-15N2 lysine (K8) and 13C6-15N4 arginine (R10). Lysine and arginine were
supplemented at concentrations of 40 mg/L and 120 mg/L, respectively. Labeled murine PDAC cells (LT DOX or No DOX) were harvested after 7-8 cell doublings.
Cells were washed once with PBS and lysed for 30 min in ice-cold lysis urea buffer (8 M urea; 75 mM NaCl, 50 mM Tris HCl pH 8.0, 1 mM EDTA, 2 μg/mL aprotinin (Sigma, A6103), 10 μg/mL leupeptin (Roche, #11017101001), 1 mM PMSF (Sigma, 78830), 10 mM NaF, 5 mM sodium butyrate, 5 mM iodoacetamide (Sigma, A3221), Phosphatase Inhibitor Cocktail 2 (1:100, Sigma, P5726), Phosphatase Inhibitor Cocktail 3 (1:100, Sigma, P0044). Lysates were centrifuged at 20,000g for 10 min, and protein concentrations of the clarified lysates were measured via BCA assay (Pierce, 23227). A total of 5 mg total proteins per SILAC channel were combined for a total of 15 mg proteins per SILAC experiment. Protein disulfide bonds of the combined lysates were reduced for 45 min with 5 mM dithiothreitol (Thermo Scientific, 20291) and alkylated for 45 min with 10 mM
iodoacetamide. Samples were then diluted 1:4 with 50 mM Tris HCl, pH 8.0, to reduce the urea concentration to 2 M. Lysates were digested for 2 h using 1:50 enzyme-to-substrate ratio LysC (Wako, 129-02541) and trypsin (Promega, V511X) was added in a 1:50 enzyme-to-substrate ratio for digest at room temperature overnight. Peptide mixtures were acidified to a final volumetric concentration of 1% formic acid (Fluka, 56302) and centrifuged at 2,000g for 5 min to pellet urea that had precipitated out of solution. Peptide mixtures were desalted on tC18 SepPak columns (Waters, 500 mg WAT036790). Columns were
conditioned with 1 × 5 ml 100% acetonitrile and 1 × 5 ml 50% acetonitrile/0.1% formic acid washes, and equilibrated with 4 × 5 ml 0.1% trifluoroacetic acid (Fluka, TX1276-6). After loading the sample onto the column, samples were desalted with 3× 5 ml 0.1%
trifluoroacetic acid washes and 1 × 5 ml 1% formic acid wash. Peptides were eluted from the column with 2 × 3 ml 50% acetonitrile/0.1% formic acid. Eluted peptide samples were placed in a vacuum concentrator to evaporate the elution solvent and produce purified peptide samples.
To reduce peptide complexity, samples were separated by basic reversed-phase
chromatography. For basic RP separation, desalted peptides were reconstituted in 1.8 mL 20 mM ammonium formate, pH 10, and centrifuged at 10,000g to clarify the mixture before it
A
uthor Man
uscr
ipt
A
uthor Man
uscr
ipt
A
uthor Man
uscr
ipt
A
uthor Man
uscr
ipt
was transferred into autosampler tubes. Basic reversed-phase chromatography was conducted on a 9.4 mm × 250 mm column Zorbax 300 Å Extend-C18 column (Agilent, 5 μm bead size), using an Agilent 1100 Series HPLC instrument. Solvent A (2% acetonitrile, 5 mM ammonium formate, pH 10), and a nonlinear increasing concentration of solvent B (90% acetonitrile, 5 mM ammonium formate, pH 10) were used to separate peptides by their hydrophobicity at a high pH. We used a flow rate of 3 ml/min and increased the percentage of solvent B in a nonlinear gradient with 4 different slopes (0% for 2 min; 0% to 10% in 5 min; 10% to 27% in 34 min; 27% to 31% 4 min; 31% to 39% in 4 min; 39% to 60% in 7 min; 60% for 8 min). Eluted peptides were collected in 96 × 2 mL deepwell plates
(Whatman, #7701-5200) with 1 min (= 1 ml) fractions for the 4.6 mm column and 40 s (= 2 ml) fractions for the 9.4 mm column. Early eluting peptides were collected in fraction “A”, which is a combined sample of all fractions collected before any major UV-214 signals were detected.
Peptide samples were combined into 24 subfractions, respectively, to be used for proteome analysis. Subfractions were achieved by combining every 24th fraction (1,25,49; 2,26,50; …). Subfractions were acidified to a final concentration of 1% formic acid, and 5% of the volumetric samples were reserved for proteome analysis.
The remaining 95% of each of the original 72 subfractions from bRP (above) were further combined before enrichment for PTM analyses as follows: every 12th fraction was combined (1,13; 2,14; …) to generate 12 fractions. Peptide fractions were subsequently dried by vacuum sublimation in a vacuum concentrator. We have also analyzed an early eluting hydrophilic fraction labeled fraction A which contains a large number of multiply phosphorylated peptides.
As described previously (34), iron-chelated IMAC beads were prepared from Ni-NTA superflow agarose beads (Qiagen, #1018611) that were stripped of nickel with 100 mM EDTA and incubated in an aqueous solution of 10 mM FeCl3 (Sigma, 451649). Dried
phosphopeptide fractions were reconstituted in 50% acetonitrile/0.1% trifluoroacetic acid and then diluted 1:1 with 100% acetonitrile/0.1% trifluoroacetic acid to obtain a final 80% acetonitrile/0.1% TFA peptide solution at a concentration of 0.5 μg/μl. Peptide mixtures were enriched for phosphorylated peptides with 10 μL IMAC beads for each sample for 30 min. Enriched IMAC beads were loaded on Empore C18 silica-packed stage tips (3M, 2315). Stage tips were equilibrated with 2 × 100 μL washes of methanol, 2 × 50 μL washes of 50% acetonitrile/0.1% formic acid, and 2 × 100 μL washes of 1% formic acid. Samples were then loaded onto stage tips and washed twice with 50 μL of 80% acetonitrile/0.1% trifluoroacetic acid and 100 μL of 1% formic acid. Phosphorylated peptides were eluted from IMAC beads with 3 × 70 μL washes of 500 mM dibasic sodium phosphate, pH 7.0, (Sigma, S9763) and washed twice with 100 μL of 1% formic acid before being eluted from stage tips with 60 μL 50% acetonitrile/0.1% formic acid. All washes were performed on a tabletop centrifuge at a maximum speed of 3,500g.
All peptide samples were separated on an online nanoflow EASY-nLC 1000 UHPLC system (Thermo Fisher Scientific) and analyzed on a benchtop Orbitrap Q Exactive mass
spectrometer (Thermo Fisher Scientific). Ten percent of each proteome (containing ~1 μg)
A
uthor Man
uscr
ipt
A
uthor Man
uscr
ipt
A
uthor Man
uscr
ipt
A
uthor Man
uscr
ipt
and fifty percent of each phosphopeptide, K(GG) peptide, and K(Ac) peptide sample were injected onto a capillary column (Picofrit with 10 μm tip opening/75 μm diameter, New Objective, PF360-75-10-N-5) packed in-house with 20 cm C18 silica material (1.9 μm ReproSil-Pur C18-AQ medium, Dr. Maisch GmbH, r119.aq). The UHPLC setup was connected with a custom-fit microadapting tee (360 μm, IDEX Health & Science, UH-753), and capillary columns were heated to 50 °C in column heater sleeves (Phoenix-ST) to reduce backpressure during UHPLC separation. Injected peptides were separated at a flow rate of 200 nL/min with a linear 80 min gradient from 100% solvent A (3% acetonitrile, 0.1% formic acid) to 30% solvent B (90% acetonitrile, 0.1% formic acid), followed by a linear 6 min gradient from 30% solvent B to 90% solvent B. Each sample was run for 150 min, including sample loading and column equilibration times. Data-dependent acquisition was obtained using Xcalibur 2.2 software in positive ion mode at a spray voltage of 2.00 kV. MS1 Spectra were measured with a resolution of 70,000, an AGC target of 3e6 and a mass range from 300 to 1800 m/z. Up to 12 MS2 spectra per duty cycle were triggered at a resolution of 17,500, an AGC target of 5e4, an isolation window of 2.5 m/z and a normalized collision energy of 25. Peptides that triggered MS2 scans were dynamically excluded from further MS2 scans for 20 s.
All mass spectra were analyzed with MaxQuant software version 1.3.0.5 using a mouse UniProt database. MS/MS searches for the proteome data sets were performed with the following parameters: Oxidation of methionine and protein N-terminal acetylation as variable modifications; carbamidomethylation as fixed modification. For IMAC data sets phosphorylation of serine, threonine and tyrosine residues were searched as additional variable modifications. Trypsin/P was selected as the digestion enzyme, and a maximum of 3 labeled amino acids and 2 missed cleavages per peptide were allowed. The mass tolerance for precursor ions was set to 20 p.p.m. for the first search (used for nonlinear mass re-calibration) and 6 p.p.m. for the main search. Fragment ion mass tolerance was set to 20 p.p.m. For identification we applied a maximum FDR of 1% separately on protein, peptide and PTM-site level. We required 2 or more unique/razor peptides for protein identification and a ratio count of 2 or more for protein quantification per replicate measurement. PTM-sites were considered to be fully localized when they were measured with a localization probability >0.75 in each of the three replicates. To assign regulated proteins and PTM-sites we used the Limma package in the R environment to calculate moderated t-test Pvalues corrected by the Benjamini Hochberg method, as described previously48. Bland-Altman filtering was applied at 99.9% (+/−3.29 sigma).
Combined analysis of SILAC and iTRAQ data
To ensure the identification of critical pathways that mediate the response to Kras inhibition with minimal clonal or technical confounding effects, we only included peptides that were called in at least two replicates of iTRAQ experiments and showed significant correlation in the up and down-regulated genes (≥2-fold for SILAC, ≥1.2-fold for iTRAQ) in the Kras-inhibited cells in both clones (p<0.0001, Pearson correlation).
A
uthor Man
uscr
ipt
A
uthor Man
uscr
ipt
A
uthor Man
uscr
ipt
A
uthor Man
uscr
ipt
Statistical analyses
P-values for comparisons of two groups were determined by two-tailed Student’s t-test (for normally distributed data) or Mann-Whitney U-test (for non-parametric data), as noted in the figure legends. Chi-square analysis was performed for statistical evaluation of clonal efficiency. Pearson correlations were calculated for scatter plots of phosphoproteomic and proteomic data (Prism). All replicates were included in these analyses. A p-value of <0.05 was used to denote statistical significance. All error bars denote 95% confidence intervals, standard error of mean (s.e.m.), or standard deviation (s.d.), as noted in the figure legends.
RESULTS
Temporal control of endogenous Kras expression in PDAC cells
To elucidate the consequence of inhibiting endogenous Kras in PDAC, we first derived cell lines from three distinct primary tumors (labelled A, B, and D) from an autochthonous PDAC mouse model (Pdx1-CreER; KrasLSL-G12D/+; p53flox/flox), which recapitulates the biology of human PDAC (13). We used murine cells with defined genetic alterations frequently observed in human PDACs (Kras and p53) (6,35) to minimize genetic variability in our analyses. We transduced these cell lines with a doxycycline-inducible shRNA-mediated knockdown system that enables the temporal control of endogenous Kras
expression (Fig. 1A and Supplementary Table 1). Here, partial inhibition and the subsequent reactivation of endogenous Kras are achieved by administration and withdrawal of
doxycycline (DOX). We employed two DOX-inducible miR30-based hairpins targeting the 3′-UTR of Kras (shKras.1442 or shKras.923) or a control hairpin targeting firefly luciferase (shLuc). These Kras hairpins do not distinguish between wild-type and mutant alleles of Kras due to 3′-UTR targeting. Following retroviral transduction, we selected for cells with robust hairpin expression by 24-48 hours of DOX treatment (prior to visible phenotypic consequences of Kras knockdown) to induce concomitant expression of a GFP reporter and the hairpin, and isolated single cell clones that express GFP at the highest levels by FACS. Finally, we confirmed on-target Kras protein and mRNA knockdown at >70% in these clones under DOX treatment (Figs. 1B-C, Supplementary Figs. 1A-C).
Murine PDAC cells tolerate stable Kras knockdown in vitro and in vivo
Rather than undergoing permanent growth arrest or apoptosis, all PDAC cells analyzed tolerated acute and sustained Kras knockdown and continued to proliferate in vitro. Short-term DOX treatment for 3-5 days (“ST DOX”) of shKras-expressing cells, but not shLuc-expressing cells, resulted in significantly altered cell morphology and decreased
proliferation, consistent with a partial requirement of endogenous Kras expression for PDAC maintenance (Figs. 1D-E). Under prolonged DOX treatment for >21 days (“LT DOX”), shKras-expressing cells retained GFP and shKras hairpin expression, and demonstrated persistent Kras knockdown (Figs. 1B-C). LT DOX cells continued to proliferate with slower kinetics than untreated cells (“No DOX”) and maintained morphological changes (Figs. 1E-F).
To examine the requirement of endogenous Kras for PDAC maintenance in vivo, we transplanted untreated shKras-transduced cells subcutaneously into nude mice, allowed
A
uthor Man
uscr
ipt
A
uthor Man
uscr
ipt
A
uthor Man
uscr
ipt
A
uthor Man
uscr
ipt
tumors to form, and induced hairpin expression with DOX food. Acute Kras knockdown in established tumors resulted in decreased tumor growth and even tumor regression,
attributable in part to decreased proliferation as evident by reduced BrdU incorporation (Supplementary Figs. 2A-C). Despite long-term DOX treatment of mice (>6 weeks; LT DOX), tumors grew at decreased rates compared to untreated tumors and retained GFP expression (Supplementary Fig. 2D). Taken together, these observations suggest that endogenous levels of Kras expression are not essential for maintaining murine PDAC cell proliferation and survival in vitro or in vivo.
Response to Kras knockdown is adaptive and reversible
It is generally thought that cancer cells gain resistance to oncogene inhibition through elimination of a sensitive cell population and outgrowth of a resistant population. Given the lack of significant apoptosis with acute and sustained Kras knockdown and the rapid conversion of cell morphology, we hypothesized that murine PDAC cells underwent adaptation to a state tolerant to Kras inhibition rather than selection of rare cells intrinsically resistant to Kras knockdown. To distinguish between these two possibilities, we analyzed the number of single cell clones that could grow from shKras-transduced cell lines in the absence or presence of sustained DOX treatment. If there were a selection process, we would expect to see a marked decrease in the number of clones that formed under prolonged DOX treatment. Alternatively, if adaptation occurred, then the same number of clones should form regardless of DOX treatment condition. While we observed differences between parental cell lines, the vast majority of clones were able to expand despite sustained Kras knockdown (Fig. 2A), suggesting adaptation to a state tolerant to Kras inhibition (Kras-inhibited state). All colonies that did form in DOX were smaller in size, consistent with the expected decreased proliferative rate following Kras knockdown (Fig. 2B). Indeed, when we removed DOX to restore Kras levels (Fig. 2C), cells rapidly reverted morphological
phenotypes and proliferative kinetics (Figs. 2D-E). Finally, cells were re-sensitized to DOX treatment in terms of proliferative and morphological phenotypes (Fig. 2F). Collectively, these observations indicate that murine PDAC cells respond to partial Kras inhibition by a reversible cell state change.
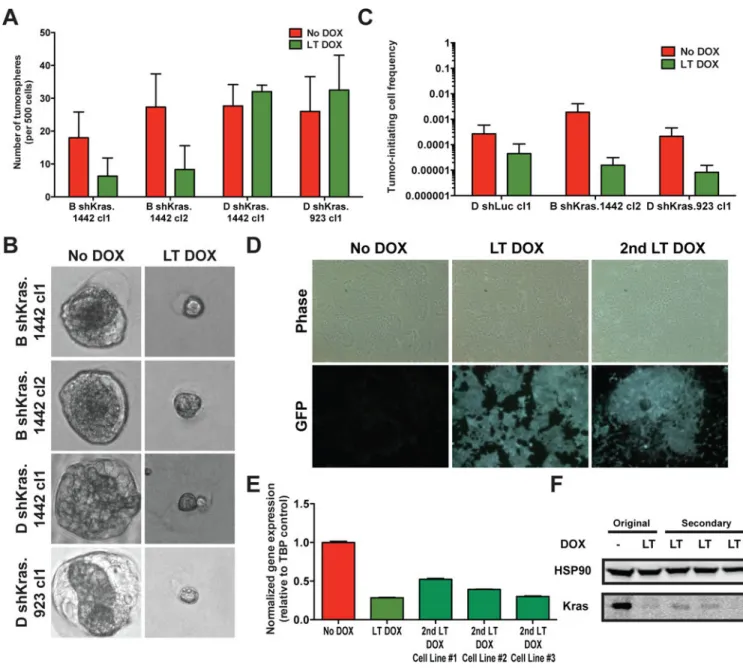
Diminished in vivo tumor initiating capacity following stable Kras inhibition
While Kras inhibition did not significantly block the ability of PDAC clones to form in 2D cultures (Fig. 2A), we also interrogated the tumorigenic ability of Kras-inhibited cells in 3D culture in vitro and in immunocompromised mice in vivo, as Kras has been implicated in maintaining tumor-initiating cells (TICs) or stemness (36). Interestingly, Kras-inhibited cells retained the ability to form 3D tumorspheres in matrigel in vitro (Fig. 3A) in similar relative frequencies to 2D clonal cultures (Fig. 2A), though the spheres that formed were smaller, consistent with a proliferative defect (Fig. 3B). In contrast, Kras-inhibited cells exhibited reduced TICs in forming subcutaneous tumors in vivo (Fig. 3C and Supplementary Table 2). However, tumors did form from LT DOX-treated shKras-expressing cells. Sustained Kras inhibition was maintained even in secondary cell lines (Fig. 3D), which exhibited comparable levels of Kras protein and mRNA knockdown to that of the primary cell lines (Fig. 3E-F). Collectively, these data suggest that sustained Kras inhibition can reduce cell proliferation in vitro and in vivo and impair TICs in vivo, confirming that Kras is a valuable
A
uthor Man
uscr
ipt
A
uthor Man
uscr
ipt
A
uthor Man
uscr
ipt
A
uthor Man
uscr
ipt
therapeutic target. Nonetheless, Kras inhibition did not ablate the tumorigenic ability of murine PDAC cells.
The Kras-inhibited state does not display significant alterations in gene expression
We next sought to understand the molecular and biochemical changes associated with the Kras-inhibited state, which may reveal targetable mechanisms of resistance. To identify transcriptional changes associated with adaptation to this state, we performed RNAsequencing on polyAselected RNA from six shKrastransduced Krasinhibited and -uninhibited subclone pairs (2 per primary cell line A, B, and D) and a control shLuc-transduced pair. We verified data quality by confirming Kras knockdown and identifying the engineered C→T G12D Kras gene mutation in the transcript sequencing reads. We did not identify recurrent non-synonymous mutations in exonic regions in the Kras-inhibited cells (Supplementary Table 3). Strikingly, we also did not observe significant differences in coding gene or lncRNA expression between the baseline and Kras-inhibited states
(Supplementary Tables 4 and 5). Indeed, unsupervised hierarchical clustering demonstrated that gene expression differences were driven more strongly by parental cell line and subclonal identity rather than alterations in the Kras expression state (Fig. 4A).
To account for clonal variability and to derive a robust gene signature associated with the Kras-inhibited state using an unbiased approach, we employed a blind-source separation method termed independent component analysis (ICA). This separation technique not only derived gene expression signatures associated with individual parental cell lines or clones, but also identified signature profiles that distinguished the independent gene expression changes associated with Kras knockdown and DOX treatment (using the shLuc control cell line treated with DOX) (Figs. 4B-D). It became readily apparent that DOX treatment alone could have significant effects on gene expression independent of Kras knockdown in our cell lines. For example, the G-protein coupled receptor Gpr56 was strongly upregulated by DOX (Supplementary Table 3) and was significantly associated with the DOX signature but not the Kras knockdown signature (z-scores of 7.32 and −0.51, respectively). We confirmed that Gpr56 represented an endogenous eukaryotic target of the prokaryotic protein rtTA in the presence of DOX (Supplementary Figs. 3A-C). As expected, Gpr56 knockdown did not impact the proliferative or morphological phenotypes of Kras-inhibited cells (Supplementary Figs. 3D-E). This ability to distinguish a DOX-regulated gene from a Kras-regulated gene demonstrates the power of ICA to identify functionally important gene signatures. Furthermore, genes in the Kras knockdown signature were specifically and significantly, although not strongly, enriched in Kras-inhibited cells (Fig. 4D). Comparison of the degree of transcriptional alterations associated with either DOX treatment or Kras knockdown suggested that stable Kras inhibition does not lead to striking gene expression changes (Figs. 4C-D), contrary to what one might expect as Kras-mediated signal transduction ultimately regulates nuclear transcriptional activity. These observations suggest that the Kras-inhibited state is not strongly dependent on mutational or transcriptional alterations.
To elucidate potential Kras-regulated transcriptional pathways or functionally important pathways that maintain cell viability in the Kras-inhibited state, we performed gene set enrichment analysis (GSEA) on the Kras knockdown signature. While few genes sets in
A
uthor Man
uscr
ipt
A
uthor Man
uscr
ipt
A
uthor Man
uscr
ipt
A
uthor Man
uscr
ipt
MSigDB were significantly associated with the Kras knockdown signature, network correlation analysis revealed enrichment of gene sets associated with receptor tyrosine kinase (RTK), PI3K/AKT signaling, receptor endocytosis and recycling, and redox
metabolism in Kras-inhibited cells (Fig. 4E), possibly because these compensatory pathways are upregulated in response to Kras inhibition to support the steady-state proliferation of PDAC cells.
Global phosphoproteomic profiling reveals enhanced focal adhesion signaling in the Kras-inhibited state
We hypothesized that signaling flux through alternative pro-proliferation and pro-survival pathways may underlie the adaptive state. Importantly, identification of compensatory pathways could uncover potentially druggable protein targets for PDAC therapy. We first examined signaling differences between the Kras-uninhibited and -inhibited states in a tyrosine-focused fashion, because the best-characterized upstream regulators of Kras-mediated signal transduction are RTKs and genes associated with RTK signaling are enriched in the Kras knockdown signature (Fig. 4E). Assessment of global tyrosine phosphorylation levels (Fig. 5A) showed an overall increase in the levels of tyrosine phosphorylation in Kras-inhibited cells, suggestive of increased activation of tyrosine kinase-mediated pathways that may compensate for decreased Kras levels. However, a limited phospho-RTK array did not reveal candidate upstream regulators mediating the adaptive state change (Supplementary Fig. 4A). Therefore, we employed two distinct approaches for unbiased global phosphoproteomic analysis: stable isotope labeling by amino acids in cell culture (SILAC) and isobaric tag for relative and absolute quantitation (iTRAQ). The SILAC approach (34) enables analysis of serine-, threonine-, and
tyrosine-phosphorylated peptides (pS, pT, and pY, respectively) as well as total proteome changes. As a complementary approach, we adopted an optimized iTRAQ protocol to enrich specifically for the lowly abundant tyrosine-phosphorylated peptides (33), enhancing the resolution of tyrosine kinase signaling analysis of the Kras-inhibited state (Supplementary Fig. 4B). Combining these two approaches, we cross-compared candidate signaling pathways specifically activated or inhibited in the Kras-inhibited state.
Total proteome differences between Kras-uninhibited and Kras-inhibited states showed minimal overall protein abundance alterations by SILAC (Supplementary Figs. 5A-B and Supplementary Table 6), consistent with the paucity of transcriptional changes. Importantly, one of the few proteins whose abundance was significantly altered in the Kras-inhibited state was Kras itself (reduced by 60%). Conversely, the highest upregulated protein was the DOX-inducible gene Gpr56. For iTRAQ, each experimental replicate identified a robust number of pY peptides that were called with stringent criteria, and at least 230 overlapping pY peptides were identified in more than two replicates (Fig. 5B and Supplementary Tables 7-9). Additionally, the signaling changes that occurred in the two independent evaluated clones, B (B shKras.1442 cl2) and D (D shKras.923 cl1), exhibited reasonable correlation (Figs. 5C-D), suggesting that the clonal and parental cell line differences were small.
We next performed combined analysis of phosphoprotein abundance from SILAC and iTRAQ data, and found that multiple sites on focal adhesion-associated proteins showed
A
uthor Man
uscr
ipt
A
uthor Man
uscr
ipt
A
uthor Man
uscr
ipt
A
uthor Man
uscr
ipt
increased phosphorylation (Fig. 5C). Examples included Src, focal adhesion kinase (FAK), tensin, paxillin, talin, and vinculin, among many others (Fig. 5C). Furthermore, despite the low abundance of pY residues in the total phosphoproteome, our SILAC analysis identified 20-30 pY peptides that overlapped with iTRAQ analysis (Supplementary Fig. 5C).
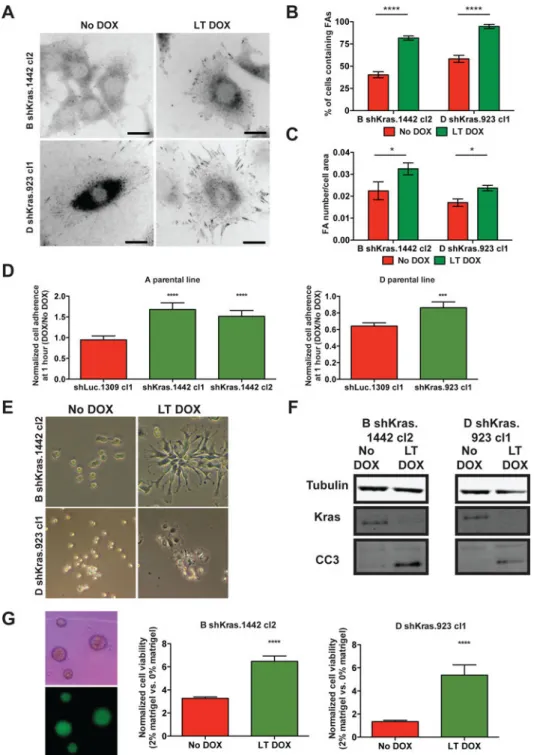
Phosphosites on proteins associated with adhesion pathways also exhibited significant upregulation in the SILAC analysis (Fig. 5D and Supplementary Table 10). Collectively, these signaling changes suggest that the Kras-inhibited state is characterized by enhanced focal adhesion signaling. Accordingly, immunofluorescent staining for the focal adhesion protein vinculin confirmed markedly enhanced focal adhesion structures in Kras-inhibited cells (Figs. 6A-C). Therefore, a major feature of the Kras-inhibited state is the upregulation of focal adhesion pathway signaling.
The Kras-inhibited state depends on cell attachment
Given enhanced focal adhesion signaling and structures in Kras-inhibited cells, we
hypothesized that inhibited cells are more dependent on attachment for survival. Kras-inhibited cells exhibited enhanced cell attachment capacity, demonstrated by faster
adherence to culture dishes than uninhibited cells (Fig. 6D). This property likely underlies the greater resistance of Kras-inhibited cells to actin polymerization inhibitor latrunculin B-induced detachment (Fig. 6E). Moreover, Kras-inhibited cells were more sensitive to anoikis, as evident by increased induction of apoptosis in non-adherent culture conditions (Fig. 6F). Conversely, Kras-inhibited cells exhibited significantly enhanced viability in suspension when the media was supplemented with extracellular matrix proteins (Fig. 6G). Overall, analyses of the cell biological features of Kras-inhibited cells reveal enhanced adherence properties and an increased dependency on adhesion for cell viability in vitro. To determine the relevance of our findings to human PDAC, we introduced DOX-inducible hairpins targeting LACZ (control) or KRAS into 8988T and PANC1 human PDAC cell lines, which we and others have previously shown tolerate KRAS inhibition (15,16,37). Consistent with observations in murine cells, KRAS knockdown in human PDAC cell lines (Fig. 7A, Supplementary Fig. 6A) resulted in morphological changes and decreased proliferation that were reversible by KRAS reactivation (Figs. 7B-D, Supplementary Figs. 6B-D).
Additionally, 8988T cells in the KRAS-inhibited state exhibited increased sensitivity to anoikis (Fig. 7E) and enhanced focal adhesion structures (Figs. 7D, 7F, and 7G), indicative of dependency on cell attachment. While KRAS-inhibited PANC1 cells did not display increased anoikis sensitivity (Supplementary Fig. 6E), they showed enhanced focal adhesion structures (Supplementary Figs. 6D, 6F, and 6G). The variability in response on focal adhesion formation and dependence observed in human PDAC cells compared to the murine models likely emerge from the greater heterogeneity (e.g. genetic, phenotypic) seen in human PDAC. Nonetheless, these results reveal that our findings in murine PDAC cells are relevant to at least a subset of human PDAC cells.
Genetic or pharmacological inhibition of FAK does not impair survival of Kras-inhibited PDAC cells
We hypothesized that direct inhibition of focal adhesion kinase (FAK) may target a unique vulnerability in the context of Kras inhibition, and interrogated the requirement of
FAK-A
uthor Man
uscr
ipt
A
uthor Man
uscr
ipt
A
uthor Man
uscr
ipt
A
uthor Man
uscr
ipt
mediated signaling in maintaining Kras-inhibited cell viability. Kras-inhibited cells did not show increased sensitivity compared to uninhibited cells to pharmacological inhibition of FAK or the central upstream regulator of the focal adhesion signaling pathway Src
(Supplementary Fig. 7). As both FAK and Src integrate multiple signaling pathways and the off-target effects of pharmacological inhibitors could mask differential sensitivity, we performed more-specific shRNA-mediated knockdown of FAK (Supplementary Fig. 8A). Even though FAK knockdown disrupted the polarity and organization of focal adhesion plaques, it did not ablate the formation of these structures in Kras-inhibited cells (Supplementary Fig. 8B). Moreover, FAK knockdown did not synergize with Kras knockdown to further impair proliferation in vitro or subcutaneously transplanted tumor growth in vivo (Supplementary Fig. 8C and Supplementary Figs. 9A-E). These data suggest that there may be compensatory mechanisms to maintain focal adhesions upon FAK inhibition. While FAK inhibition was insufficient to impair Kras-inhibited cell survival, blockade of the cell adhesion phenotype through alternative means may still offer a tractable therapeutic strategy.
DISCUSSION
We interrogated the requirement of endogenous Kras for maintaining murine PDAC cell survival with an inducible shRNA-based knockdown system. Surprisingly, our results demonstrated only a partial requirement of Kras for PDAC maintenance. Not only were PDAC cells able to proliferate under sustained Kras knockdown, but they also retained oncogenic capabilities in vitro and in vivo. The majority of murine PDAC cells tolerated acute and sustained Kras inhibition by adapting to a reversible state. The lack of significant mutational and gene expression changes indicated that such resistance to Kras inhibition was non-genetic and non-transcriptional. Global phosphoproteomic analyses confirmed that the Kras-inhibited state was a result of rewiring of signaling through alternative pathways. Specifically, Kras-inhibited PDAC cells exhibited upregulation of focal adhesion signaling and enhanced adherence properties and dependence. Due to possible compensatory mechanisms, inhibition of FAK or Src alone was insufficient to selectively impair Kras-inhibited cell survival. Nevertheless, components of this pathway could be novel drug targets for rational combination therapies.
Unlike its well-established role as the driver of PDAC initiation, whether endogenous oncogenic Kras is required for PDAC maintenance has remained a longstanding question. To elucidate the dependency of PDAC cells on Kras for survival, we employed an in vitro system that allows reversible Kras knockdown to mimic the effect of a non-specific
pharmacological Kras inhibitor. It is possible that mutant Kras-specific inhibition could have differential effects from combined inhibition of both alleles, since wild-type Kras has been shown to act as either a tumor suppressor (38) or oncogenic driver (i.e. through
amplification) (39–41) in different cancer types. However, the vast majority of approaches currently being developed to inhibit KRAS are not allele-specific (8), thus our system can be utilized to predict mechanisms of resistance to these inhibitors.
Our approach has several advantages over previous work to understand the requirement of Kras for PDAC maintenance and potential mechanisms of resistance to Kras inhibition.
A
uthor Man
uscr
ipt
A
uthor Man
uscr
ipt
A
uthor Man
uscr
ipt
A
uthor Man
uscr
ipt
Early studies used constitutive RNAi to knockdown Kras in human PDAC cell lines and correlate dependency with gene expression. These experiments defined human PDAC cell lines with variable dependencies on Kras for survival following short-term inhibition, but the effects of sustained knockdown, as would more closely mimic treatment of patients, were undefined (15,16). More recent work used a doxycycline-inducible RNAi approach to knockdown Kras in human PDAC cell lines and established human tumor xenotransplants. While comparable decreased in vitro proliferation and slower tumor growth in vivo were observed, signaling studies were limited to the study of well-defined MAPK and PI3K pathways (42). Recent in vivo studies aimed to characterize the requirement of sustained oncogenic Kras expression for pancreatic cancer maintenance have employed elegant mouse models engineered to express an inducible oncogenic Kras transgene (9,11,12). Because oncogenic Kras alone induces PDAC with low frequency and long latency, these models require additional tumor suppressor inactivation or pancreatitis induction to facilitate PDAC development. In these models, withdrawal of oncogenic Kras transgene expression in established PDAC tumors led to an initial tumor regression due to apoptosis, but tumor relapse was observed after a period of dormancy (9,11,12,17,18). While these studies provide invaluable insights into the requirement of oncogenic Kras for tumor maintenance, care must be taken into extrapolating the effects of overexpression of an oncogenic Kras transgene to explain its endogenous functions. Finally, CRISPR-mediated ablation of endogenous Kras in human and murine PDAC cells demonstrated that Kras is dispensable for survival in a subset of PDAC cells, and that Kras-deficient cells exhibited increased dependency on PI3K signaling (37). However, achieving complete pharmacological
inhibition of KRAS is challenging. Furthermore, CRISPR-mediated knockout is irreversible, impairing the ability to distinguish between clonal selection and adaptation as modes of resistance.
Consistent with results from these previous studies, we found that PDAC cells can bypass Kras oncogene addiction by adapting to a reversible Kras-inhibited state. Conventionally, it is thought that resistance to cancer therapies occurs by selection of rare cells. Our
observations support the emerging view that non-genetic resistance mechanisms can be equally relevant (19,20). Given the significant investment into the development of KRAS inhibitors, advanced knowledge of these resistance mechanisms would facilitate the clinical translation of novel inhibitors and overcome the limitations of single-agent therapy.
Unbiased phosphoproteomic analyses of the Kras-inhibited state uncovered increased focal adhesion signaling as a possible resistance mechanism to Kras inhibition. This intriguing finding led us to explore the benefit of targeting FAK in Kras-inhibited PDAC cells. FAK is the central kinase of focal adhesion signaling, and is known to integrate adhesion- and growth factor-dependent signals to regulate cell adhesion, motility, and survival (43,44). Interestingly, FAK overexpression in human cancers is often associated with worse prognosis (45,46). Furthermore, FAK interacts with multiple regulators and effectors of KRAS. It has been suggested that KRAS-mediated activation of MEK1 results in phosphorylation of FAK at Ser910, which decreases FAK kinase activity (47). Moreover, FAK inhibition has been shown to suppress the growth of xenograft PDAC tumors with gemcitabine treatment (48). Together, the connection between FAK and KRAS-mediated signaling as well as its implication in human cancers made FAK an appealing target.
A
uthor Man
uscr
ipt
A
uthor Man
uscr
ipt
A
uthor Man
uscr
ipt
A
uthor Man
uscr
ipt
Unfortunately, as focal adhesion signaling involves multiple inputs and outputs, FAK inhibition alone was insufficient to impair Kras-inhibited cell survival. Nevertheless, identification of the critical nodes of focal adhesion signaling that underlie resistance to KRAS inhibition may inform rational therapeutic combinations with novel KRAS inhibitors. In summary, we have employed a conditional RNAi system to study the requirement of endogenous Kras in PDAC maintenance, and performed unbiased gene expression and phosphoproteomic analyses to characterize the adaptive and reversible Kras-inhibited state. Our observations have important therapeutic implications. First, by showing that the majority of cells could tolerate an approximately 70% inhibition of Kras, it is possible that a KRAS-directed inhibitor needs to achieve near-complete inhibition of KRAS function to exhibit significant clinical impact. Alternatively, multiple nodes of KRAS signaling may need to be inhibited to achieve greater efficacy. Second, even if an effective KRAS inhibitor is successfully developed, resistance may develop. Since PDAC cells can circumvent Kras inhibition via an adaptive and reversible state change, intermittent dosing of a KRAS-directed inhibitor to allow for re-treatment response may be beneficial. Finally, the Kras-inhibited state is characterized by signaling alterations, so targeting compensatory pathways with KRAS inhibition could be a useful therapeutic strategy.
Supplementary Material
Refer to Web version on PubMed Central for supplementary material.
Acknowledgments
We thank K. Mercer, J. Singh, E. Vasile and D. Riquelme for technical assistance; F. White, M. Yaffe, B. Joughin, and K. Krismer for assistance with phosphoproteomic analyses; W. Xue, H. Jenq, and S.G. Friedlander for advice and reagents; G. Hannon, W. Hahn, and S. Lowe for constructs; and A. Berns and D. Melton for mice.
This work was supported by an NCI K08 Award (M.D.M.), KL2/Catalyst MeRIT award (M.D.M.), CCF/ASCO Young Investigator Award (M.D.M.), the Howard Hughes Medical Institute (T.J.), Lustgarten Foundation Consortium grant (T.J.), Blum-Kovler Pancreatic Cancer Action Network-AACR Innovative grant (T.J.),
Department of Defense Congressionally-Directed Medical Research Program grant (W81XWH-12-043) (T.J.), and in part by the Cancer Center Support (core) grant P30-CA14051 from the National Cancer Institute.
P-Y.C., M.D.M., and T.J. designed the study; P-Y.C., M.D.M., K.J.D., R.R., A.R., P.M, J.Q., and A.C.S. performed experiments; A.B. conducted bioinformatics analyses; P-Y.C., M.D.M., and T.J. wrote the manuscript.
Financial Support: This work was supported by the Howard Hughes Medical Institute, Lustgarten Foundation
Consortium grant, Blum-Kovler Pancreatic Cancer Action Network-AACR Innovative grant, Department of Defense Congressionally-Directed Medical Research Program grant (W81XWH-12-043), and in part by the Cancer Center Support (core) grant P30-CA14051 from the National Cancer Institute. M.D.M. is supported by an NCI Mentored Clinical Scientist Research Career Development Award (5K08-CA2080016-02) and was supported by a KL2/Catalyst Medical Research Investigator Training award (an appointed KL2 award) from Harvard Catalyst | The Harvard Clinical and Translational Science Center (National Center for Research Resources and the National Center for Advancing Translational Sciences), National Institutes of Health Award KL2 TR001100), and a Conquer Cancer Foundation-American Society for Clinical Oncology (CCF-ASCO) Young Investigator Award. The content is solely the responsibility of the authors and does not necessarily represent the official views of Harvard Catalyst, Harvard University and its affiliated academic healthcare centers, or the National Institutes of Health. T.J. is a Howard Hughes Medical Institute Investigator, the David H. Koch Professor of Biology, and a Daniel K. Ludwig Scholar.