HAL Id: halshs-00008939
https://halshs.archives-ouvertes.fr/halshs-00008939
Submitted on 8 Feb 2006
HAL is a multi-disciplinary open access
archive for the deposit and dissemination of sci-entific research documents, whether they are pub-lished or not. The documents may come from teaching and research institutions in France or abroad, or from public or private research centers.
L’archive ouverte pluridisciplinaire HAL, est destinée au dépôt et à la diffusion de documents scientifiques de niveau recherche, publiés ou non, émanant des établissements d’enseignement et de recherche français ou étrangers, des laboratoires publics ou privés.
Differentiated management of GM diffusion in China:
Further hampering the self-sufficiency in cereal
production?
Michel Fok, Weili Liang, Guiyan Wang, Yuhong Wu
To cite this version:
Michel Fok, Weili Liang, Guiyan Wang, Yuhong Wu. Differentiated management of GM diffusion in China: Further hampering the self-sufficiency in cereal production?. Développement durable et globalisation dans l’Agro-alimentaire. Colloque International AIEA2, 2005, Canada. �halshs-00008939�
Colloque International AIEA2
Développement durable et globalisation dans l'agroalimentaire Université Laval, Québec 23-24 Août 2004
Differentiated management of GM diffusion in China: Further hampering the self-sufficiency in cereal production?
Fok A.C. Michel (Cirad, France) michel.fok@cirad.fr Liang Weili (Hebei Agricultural Univ., P.R. of China) lwl@mail.hebau.edu.cn Wang Guiyan (Hebei Agricultural Univ., P.R. of China) wanggy@mail.hebau.edu.cn Wu Yuhong (Hebei Agricultural Univ., P.R. of China) wyhdoudou@yahoo.com.cn Résumé
La Chine est un grand pays dans le domaine des biotechnologies mais c'est aussi l'un des rares pays à manifester une politique différenciée dans la diffusion des OGM en fonction des cultures. Alors que la diffusion est autorisée notamment sur le coton depuis 1998, elle reste encore interdite sur les cultures vivrières. En dépit des résultats positifs obtenus sur le coton, au moins à court terme, et de la persistance de la réduction de la production de céréale, l'hésitation dans l'utilisation des OGM sur les cultures vivrières devrait perdurer, non sans fondement, car la dimension qualitative de la production alimentaire doit être prise en compte. Abstract
China is a big country in terms of biotech achievements. It is also a rare country demonstrating crop-differentiated policies in the dissemination of the GMOs. While the release of GMOs is authorized notably for cotton in 1998, it is still prohibited for food crops. In spite of the positive outcomes on cotton, at least in the short run, and of the persisting decrease of the cereal production, the hesitation to release GMO on food crops should keep on prevailing. This seems to be founded when the qualitative dimension of the food production is taken into consideration.
Mots clés: Chine, OGM, sécurité alimentaire, coton, cultures vivrières, productivité Key words: China, GMO, food security, cotton, foodcrops, productivity
1.
IntroductionAfter the launch of the economic reform in 1978, China is experiencing a continuous high-level economic growth whose annual rate reached frequently two digits. This continuous growth takes place along a dramatic change in the structure of the Chinese economy. The agriculture sector1 declined continuously short after the Economic Reform, in compliance with the economic theory (Anderson, 1987): it accounts only for 15% of the Chinese GDP or
1
the half of its level at the beginning of the 1980s (Figure 1).
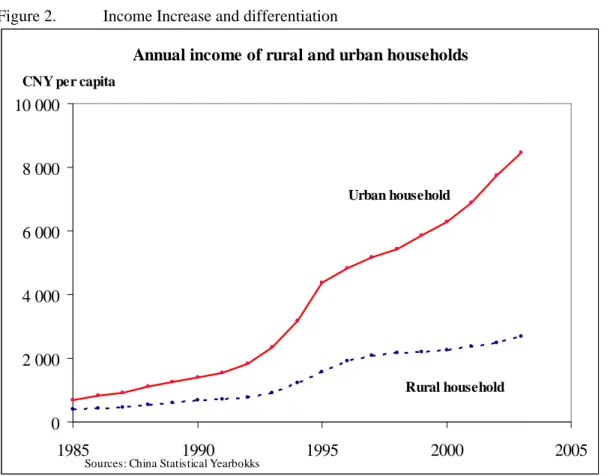
This continuous growth induced an increase of the families' income which became substantial around ten years after the Economic Reform. A phenomenon of income differentiation clearly came out, firstly between the urban and the rural households. Roughly speaking, the average income of the urban household is around 250% of the one of the rural families (Figure 2). Very poor families appear both in the cities and the rural townships. In spite of the official claim of a socialist market economy, China has not succeeded in preventing the emergence of extreme poverty along with economic growth, and this contradiction seems to be accepted by most people in China2. How to keep the income gap at an acceptable level is probably the challenge to overcome for the Chinese Government. Many, if not all countries in the world have so far failed, how China will handle the issue at the scale of its huge population of 1.3 billions deserves nevertheless more attention and empathy than criticism and sarcasm.
Figure 1. The decline of agriculture along the economic growth
Agriculture share in GDP and annual economic growth
0,0% 10,0% 20,0% 30,0% 40,0% 50,0% 60,0% 1952 1954 1956 1958 1960 1962 1964 1966 1968 1970 1972 1974 1976 1978 1980 1982 1984 1986 1988 1990 1992 1994 1996 1998 2000 -10,0% -5,0% 0,0% 5,0% 10,0% 15,0% 20,0% 25,0%
Source: China Statistical
Annual growth
Agriculture
In spite of the accelerated differentiation mentioned above, the favourable trend of the income increase during twenty years has concerned a large part of the population. This income increase induced clearly a modification of the Chinese diet with some features which are China-specific. If the decrease in the consumption of cereal is common to what is generally observed, this is less the case for the decrease of the consumption of vegetables and
2
We personally observed that beggars or homeless people, elderly people without neither family nor social support attract the attention of no one in the underground passage of the Tian An Men square in Beijing. The same was noticed along the avenues of the downtown of Nanjing.
furthermore for the one of sugar. The increase of the consumption of meat is clear but in China, it is observed for all production of animal source except for the pork (Table 1).
Figure 2. Income Increase and differentiation
Annual income of rural and urban households
0 2 000 4 000 6 000 8 000 10 000 1985 1990 1995 2000 2005
CNY per capita
Urban household
Rural household
Sources: China Statistical Yearbokks
Table 1. Mainly classical change in the diet of the Chinese urban population
1985 1990 1995 1999 2000 2001
Cereal (kg) 134,76 130,72 97 84,91 82,31 79,69
Vegetables (kg) 144,36 138,7 116,47 114,94 114,74 115,86
Edible oil (kg) 5,76 6,4 7,11 7,78 8,16 8,08
Pork (kg) 16,68 18,46 17,24 16,91 16,73 15,95
Beef and mutton (kg) 2,04 3,28 2,44 3,09 3,33 3,17
Poultry (kg) 3,24 3,42 3,97 4,92 5,44 5,3
Eggs (kg) 6,84 7,25 9,74 10,92 11,21 10,41
Aquatic products (kg) 7,08 7,69 9,2 10,34 9,87 10,33
Sugar (kg) 2,52 2,14 1,68 1,81 1,7 1,67
Source: China Statistical Yearbooks
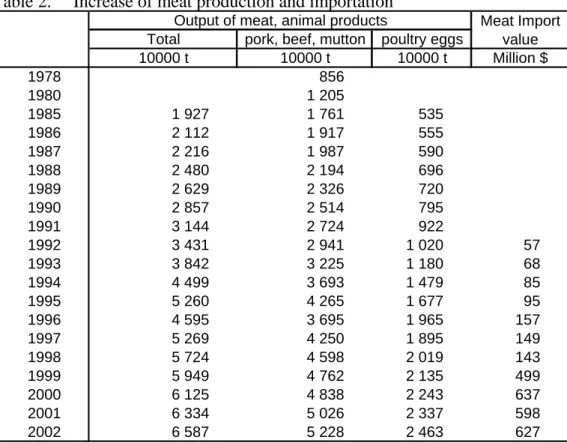
The animal productions increased a lot during the last twenty years but insufficiently to cover the national needs: the value of the importation of various meats decupled during the last decade (Table 2). The production of animal feed has represented a substantial use of the cereal produced in China: this is a phenomenon which might accentuate the Chinese dependency on the world market and imply price fluctuation/increase. This has led to question "who will feed China" (Brown, 1991, Brown, et al., 1996) and which induced frequently touchy, albeit justified reaction3 in China (Fu, et al., 1997, Kang, 2003).
3
Table 2. Increase of meat production and importation
Total pork, beef, mutton poultry eggs
10000 t 10000 t 10000 t Million $ 1978 856 1980 1 205 1985 1 927 1 761 535 1986 2 112 1 917 555 1987 2 216 1 987 590 1988 2 480 2 194 696 1989 2 629 2 326 720 1990 2 857 2 514 795 1991 3 144 2 724 922 1992 3 431 2 941 1 020 57 1993 3 842 3 225 1 180 68 1994 4 499 3 693 1 479 85 1995 5 260 4 265 1 677 95 1996 4 595 3 695 1 965 157 1997 5 269 4 250 1 895 149 1998 5 724 4 598 2 019 143 1999 5 949 4 762 2 135 499 2000 6 125 4 838 2 243 637 2001 6 334 5 026 2 337 598 2002 6 587 5 228 2 463 627
Output of meat, animal products Meat Import value
Source: China National Bureau of Statistics
The issue of the Chinese dependence on the world market to feed itself is more complex than it might appear from the gap between the production and the consumption in China. The figures of the Chinese importation of cereal during the recent years do not confirm the L. Brown's prediction: there was a decreasing trend of the importation4 while the combined exportation of cereal and flour augmented (Table 3). China, a matter of tradition, is deeply involved in the production of much diversified agro-foods and their exportation is of great economic importance. The size of the Chinese Diaspora all over the world ensures outlets for the Chinese agro-foods but this Diaspora is no longer the unique outlet of these foods.
Table 3. Import & Export of cereal and flour in China (1000 tons)
Export Import 1997 8 330 4 170 1998 8 880 3 880 1999 7 380 3 390 2000 13 780 3 150 2001 8 760 3 440 2002 14 820 2 850
Source: China Statistical Yearbooks
negative impacts on the world. First, through the price increase implied by the Chinese demand, many
developing countries will no longer afford buying food on the world market and which find themselves worse off. Second, through the temptation to increase offer in order to meet to Chinese demand, natural resources could be excessively exploited. In short, the Chinese scholars protested against a new presentation of the "péril jaune". 4
What makes the analysis arduous is the high level of the cereal stock in China and whose management could lead to export even though the production is short with regard to the domestic demand.
The issue of the Chinese food sufficiency is complex and we do not claim addressing it from a global perspective. The target of this paper is to contribute clarifying the impact of the emergence of Genetically Modified Varieties (GMVs) on the issue by making use of the results of a recent survey to complete the existing data. This survey was conducted in 2003 in Hebei Province, northern China, along the Yellow River valley, with the aim of determining the farmers' cultivation practices and the economic results generated by using the cotton GMVs in connection with farm structures, the farmers' command in the management of the chemical control of cotton pest, and their feelings regarding the efficiency and sustainability of the GMV use. The survey covered 228 farms in seven counties in the five most important cotton production districts of the province (Cangzhou, Handan, Hengshui, Shijiazhuang and Xingtai).
We argue that the issue of the Chinese cereal sufficiency is made more critical with the GM emergence owing to the differentiated management of their diffusion at the expense of the food crops. We doubt nevertheless that the correction of the current disequilibrium in the release of the GMVs will be sufficient to reverse the trend of stagnant/decreasing cereal production. Wholly speaking, we anticipate that the Chinese interaction with the World market, a notion we favour instead of its dependence, will become stronger.
In this paper, the Part 1 provides an insight on the current diffusion of GMVs, emphasizing the differentiated use of the GM research outcomes. The Part 2 analyses the extent and the factors of the successful diffusion of the GMVs on cotton. The Part 3 analyses the profitability gap at the expense of the cereal production, furthermore after the adoption of the cotton GMVs (at least as far as the cotton producing provinces are considered). The Part 4 deals with the Chinese precaution in releasing GMVs for foodcrops and why this release would remain of limited impact to boost again the cereal production.
2.
Differentiated use of the GM research outcomes2.1. China: a second big country in biotech research
Although the diffusion of GMVs in the world is generally associated to US multinational firms like Monsanto, it is not correct to perceive the USA as the unique country having reached outcomes at the dissemination stage. During the 1996-2000 period, the Chinese Office of Genetic Engineering Safety and Administration approved 251 cases of GM plants, animals and recombined microorganisms for field trials or commercialisation (Teng, et al., 2004). The research institutes in China have committed with biotechnology works since the beginning of the 1980s and these works were enhanced within the framework of the "863" Plan, and later on the "973" Plan, which enabled the Chinese research teams to identify many
genes, to build new specific gene constructions of their own and to master an original method for gene transfer through the pollinic tube. A Chinese research team is the owner of a new Bt gene construction, based upon sequences controlling Cry 1B and Cry 1C toxins, and this is the gene used in all Chinese Bt cotton varieties we mentioned earlier. China also launched, more or less at the same time as Monsanto, a new variety with dual-gene resistance to bollworms (SGK 321) by combining a Bt gene and a protein inhibition gene. The impact of this combination of two distinct effects on the pest to control could potentially be more sustainable than just combining two Bt genes as Monsanto did.
China is particular in its biotechnology research works in the sense that they are not concentrated on a limited number of crops. About eighteen crops are involved, including industrial crops, food crops, vegetables and flowers5 (Huang, et al., 2003b). Nowadays, the dissemination is only authorised on four crops (cotton, tomato, sweet pepper and petunia), in spite of the fact that China was the first country to have allowed the commercialisation of GMVs. This historic background is worth being reminded for the purpose of this paper. The commercialisation of tobacco GMVs started in 1992. It took place in the implementation of a contractual production for the US firm Philip Morris. In response to the concern of the US consumers about smoking GMO, Philip Morris decided to stop using tobacco derived from GMVs. This decision led to an abrupt interruption, in 1995, of the use of the tobacco GMVs in China. This experience should have taught the Chinese Government that the consumers' reaction matters, in particular when it has no control at all on the consumers' preference from abroad.
2.2. Large-scale adoption of cotton GMVs
Although the use of GMVs is not limited to cotton, it is the dissemination of the cotton GMVs in China which specifically captures the attention to this country. One reason is that this use is covering a large area. Although there is no official compilation, it is estimated that cotton GMVs are covering 45% of the cotton area in the country6 and are exclusively used in some provinces like Hebei7 (Table 4). This is the reason why the adoption of GMVs on cotton tends to be associated to a re-birth of the production in these provinces.
Historically, Hebei province has contributed significantly to the Chinese cotton production. The development of strong resistance to insecticide from the cotton bollworm Helicoverpa
5
Cotton, tobacco, tomato, rice, wheat, soyabean, peanut, sweet pepper, petunia… 6
The release of the cotton GMVs is not authorized in all cotton provinces 7
Chinese cotton producers are not requested to install refuge plot in order to prevent from the occurrence of resistance to Bt-toxin. Compliance to this prevention measure can hardly be expected owing to the very small size of the farm holdings (on average 0.7 ha). The relevance of the necessity of this measure is also debatable in the context of the neighbouring presence of non-cotton crops that can ensure the refuge role.
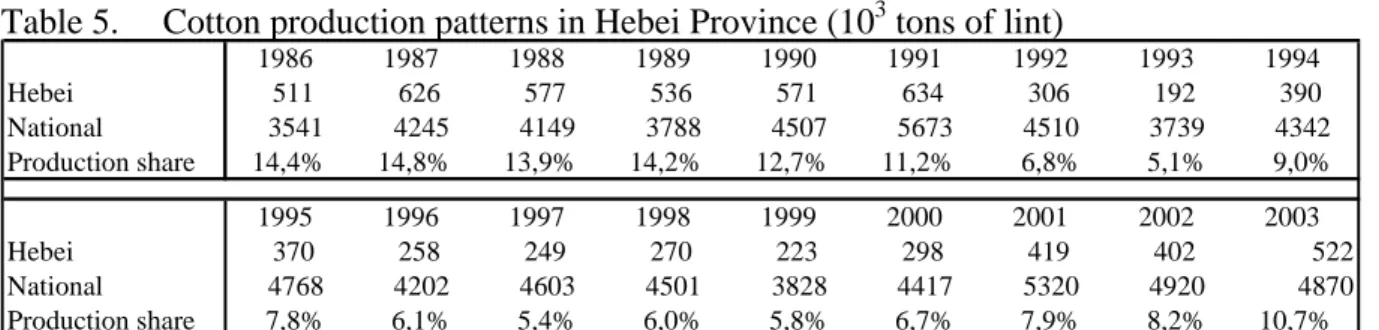
armigera, in the early 1990s, stalled the progress of this production (Table 5). The continuation of cotton production was threatened and the challenge was to find an effective technical solution. Hebei Province was the first province where Bt-cotton varieties were disseminated, which eventually led to a remarkable rebirth of cotton production in this region. Nevertheless, the conditions of the diffusion of the cotton GMVs are worth being reminded in order to clarify the role of foreign biotech firms.
Table 4. Evolution of the area in GM cotton in China (103 ha)
All cotton GM cotton % GM All cotton GM cotton % GM
1997 4 491 34 1% 377 13 3% 1998 4 459 261 6% 315 175 56% 1999 3 726 654 18% 266 227 85% 2000 4 041 1 216 30% 307 298 97% 2001 4 800 2 174 45% 418 410 98% 2002 4 480 1 943 43% 407 403 99%
Source: Huang Jikun et al. and authors' compilation
All provinces Hebei Province
Shortly after the appearance of strong endemic resistance of the bollworm (Helicocerpa armigera) against insecticides in the early 1990s, the need for a genetic solution became clear and Chinese institutions have tried to disseminate bollworm resistant varieties since 1994 without real success (Pray, et al., 2001). The reasons for this failure have yet to be seriously analysed but go beyond the scope of this paper. This historic background deserves to be mentioned since Monsanto moved to conquer the Chinese market somewhat in response to a real Chinese need after experiencing failure. Hence, it would not be fair to interpret Monsanto's entry just as an illustration of a unilateral move by a powerful multinational firm. Table 5. Cotton production patterns in Hebei Province (103 tons of lint)
1986 1987 1988 1989 1990 1991 1992 1993 1994 Hebei 511 626 577 536 571 634 306 192 390 National 3541 4245 4149 3788 4507 5673 4510 3739 4342 Production share 14,4% 14,8% 13,9% 14,2% 12,7% 11,2% 6,8% 5,1% 9,0% 1995 1996 1997 1998 1999 2000 2001 2002 2003 Hebei 370 258 249 270 223 298 419 402 522 National 4768 4202 4603 4501 3828 4417 5320 4920 4870 Production share 7,8% 6,1% 5,4% 6,0% 5,8% 6,7% 7,9% 8,2% 10,7%
According to our survey, there are nowadays more than twenty cotton GMVs in Hebei Province, out of which only two were introduced by Monsanto. This is consistent with what was observed in the same province in a former survey two campaigns earlier (Huang, et al., 2003b). Many Chinese cotton GMVs are grown, they were carried out by research organisms of various administrative levels (Table 6). The US varieties are still having the biggest market share, in terms of number of farmers using them and of cotton area concerned (Table 7 and Table 8). This situation should evolve in a near future because the new Chinese cotton GMVs are combining various genes, consolidating the resistance to the cotton bollworm and
providing resistance to one or two diseases. We observed that 35% of the farmers are growing more than one variety; this is an indication that no variety has yet won their loyalty.
Table 6. Number of Bt cotton varieties according to the geographic level of their origin Open-pollinated Hybrid Total
International 2 2 National 9 1 10 Provincial 4 1 5 Districtal 2 3 5 unclear 6 6 Total 23 5 28
Source: our survey
Type of varieties Level of origin
Table 7. Distribution of the numbers of farmers according to the origin of the Bt cotton they used
Variety type Origin 2002 2003
Chinese 63 109
USA 146 128
Hybrid Chinese 9 15
Source: our survey
Open-pollinated
Table 8. Market share of the Bt-cotton varieties by origin according to the area grown (in mu)
Origin DaWang Zhuang Fang Ya ShiJia Bao Song Zhuang XiJing Ke Total
Chinese 37 178 47 115 141 518
USA 50 16 289 159 123 636
Total 87 194 336 274 264 1154
Source: our survey
2.3. Reluctance in releasing GMVs on cereal crops
The Chinese research teams achieved also remarkable outcomes in their biotech works on cereal crops like rice, wheat and maize. In the case of rice, a large range of GMVs are available which integrate various types of resistance genes. There are varieties resistant to insects like the stem borer and plant hopper. Other varieties are resistant to diseases or virus (Huang, et al., 2003b). Varieties resistant to herbicides are available, but the varieties resistant to drought or saline soils could be regarded as the most commendable outcomes. For wheat, there is similarly large range of GMVs.
In spite of the availability of many GMVs for the main cereal crops, the Chinese Government has not yet authorised their release and there is little sign that this precaution could end up in the near future. There was no additional authorisation of GMVs since the year 2000 (Huang, et al., 2003a, Teng, et al., 2004). Few foreign observers take actually note of the hesitation in releasing new GMVs but they believe that this is only a strategic hesitation destined to let enough time for the Chinese scientists to catch up the performance level of the foreign GMVs (Macilwain, 2003). With regard to the diversity of the types of GMVs and of the crops concerned by the biotech research works in China, we think this reason is a minor one.
The concern of the consumers in foreign countries with regard to GM food, in particular in Europe, cannot be overlooked for an exporting country of agro-foods such as China. This is furthermore true since China got a first warning on how the implication could be. In 2000, the United Kingdom announced the suspension of the importation of the soy sauce from China arguing that this sauce might be produced from US soybeans which result mainly from GMVs (Anon., 2001a). This episode is at the origin of the labelling of the bottles of soy sauce one finds in Europe with the GMO-free indication. The consumers' concern regarding the GMO issue is recently legalised by the decision of the European Union to render compulsory the labelling of GMO content on any agro-food.
3.
The Extent and the factors of the successful diffusion of GM on cottonThe diffusion of cotton GMVs in China is so far successful owing to their effectiveness in controlling the targeted pest at low cost. The additional profitability which results is furthermore enhanced by attractive price which derives from the control of the cotton importation decided by the Chinese government.
3.1. Bt cotton efficient in controlling pests so far
The efficiency of Bt cotton cropping is first shown by the high cottonseed yields, in compliance with the average yield obtained in Hebei Province. The low standard deviation (SD) also indicates that the average yield is quite representative of the yields that all farmers actually achieved (Table 9). In all villages where it was possible to collect figures for two crop seasons, the yield decreased in 2003 although the extent varied. This is consistent with what was observed throughout Hebei Province or along the Yellow River valley, a phenomenon that most observers attributed to heavy rains at the end of the season.
Table 9. High seedcotton yields (averages and SD in kg/ha)
Chen Zhuang
DaWang
Zhuang Fang Ya ShiJia Bao Song Zuang XiGuan XiJing Ke 2002 3625 (233) 3914 (201) 3424 (261) 4204 (399) 3876 (219) 2855 (436) 3546 (398) 2003 3032 (444) 3346 (173) 3691 (378) 3763 (75) 3015 (462) Source: our survey
Surveyd Villages
The average yield was achieved with total numbers of insecticide sprays ranging from 4 to 15 in the 2002 crop season, with two villages having a significantly lower figure (Table 10). This total number did not vary the following season, although a slight decrease was observed in one village. This result is consistent with previously reported figures (Huang, et al., 2003a, Pray, et al., 2002) and indicates that there was a decrease in the number of sprays used to control bollworms.
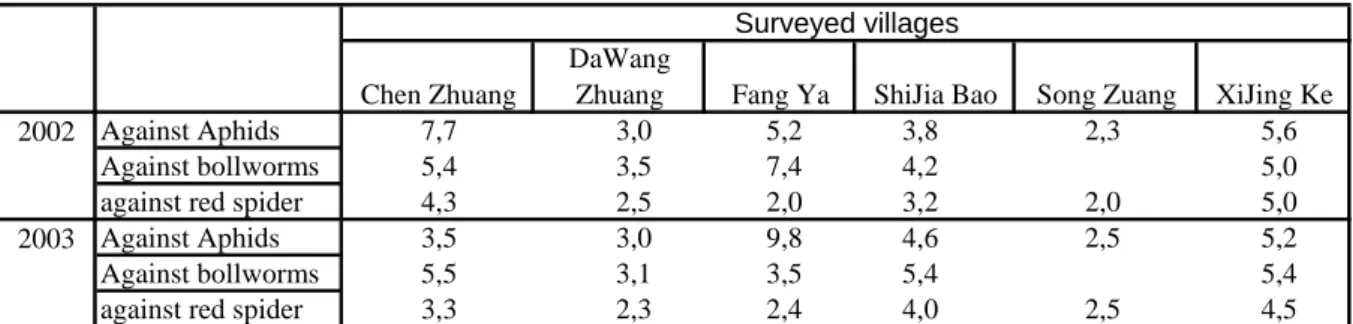
When considering the breakdown of insecticide sprays according to the pests targeted, it turns out that bollworm control still required an average of four to five sprays with little
between-season variation (Table 11). It should be stressed that aphid and red spider control required more sprays overall, with no clear indication of an increasing number of sprays in all villages during the last season.
Table 10. Total number of insecticide sprays
Chen Zhuang DaWang Zhuang Fang Ya ShiJia Bao Song Zuang XiJing Ke
2002 15,3 9,0 18,3 11,2 4,2 15,6
2003 9,8 8,3 15,2 13,6 5,0 15,0
Source: our survey
Surveyed villages
Table 11. Breakdown of the total number of insecticide sprays according to the pest controlled
Chen Zhuang
DaWang
Zhuang Fang Ya ShiJia Bao Song Zuang XiJing Ke
Against Aphids 7,7 3,0 5,2 3,8 2,3 5,6
Against bollworms 5,4 3,5 7,4 4,2 5,0
against red spider 4,3 2,5 2,0 3,2 2,0 5,0
Against Aphids 3,5 3,0 9,8 4,6 2,5 5,2
Against bollworms 5,5 3,1 3,5 5,4 5,4
against red spider 3,3 2,3 2,4 4,0 2,5 4,5
Source: our survey
Surveyed villages
2002
2003
The farmers were found to be happy with the efficiency of Bt cotton in controlling pests, only 12% of them did not find Bt cotton to be efficient (Table 12). The main reason is that the farmers knew that Bt cotton targets only bollworms (Table 13).
Table 12. Distribution of the number of farmers according to their opinion on the efficiency of GMC in controlling cotton pests.
Chen Zhuang
DaWang
Zhuang Fang Ya ShiJiaBao Song Zhuang XiGuan XiJing Ke
Good 17 14 17 26 21 30 6 131
Ordinary 11 11 8 6 3 4 1 44
Not good 1 1 1 0 1 4 17 25
Total 29 26 26 32 25 38 24 200
Source: our survey
Surveyed villages
Total
Table 13. Distribution of farmers' opinions according to the pest that Bt cotton can control (percentage of farmers surveyed)
Chen Zhuang
DaWang
Zhuang Fang Ya
Liang Mian
Chang ShiJia Bao
Song
Zhuang XiGuan XiJing Ke
aphid 3% 0% 0% 0% 6% 0% 0% 10% 3%
Bollworm 93% 100% 92% 100% 94% 96% 95% 80% 93%
no idea 0% 0% 4% 0% 0% 0% 0% 0% 0%
red spider 3% 0% 4% 0% 0% 4% 5% 10% 4%
Total 100% 100% 100% 100% 100% 100% 100% 100% 100%
Source: our survey
Surveyed villages
Total
3.2. The cost of procuring Bt cottonseed remains acceptable or even low
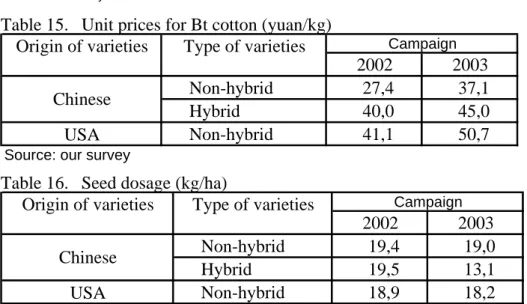
The cost for Chinese farmers to procure Bt cotton appears to be far lower than in other countries. More than 50% of the farmers used, either partly or totally, the seeds they held back from the previous season (Table 14), at a cost that was likely close to zero. This phenomenon of holding back seeds is a long-standing custom of Chinese farmers. In our
survey, the farmers declared that this phenomenon could not have a negative impact on efficiency, provided that the seeds are renewed every 2-3 years. We identified 50 farmers (22% of the sample) who declared that they had no seed costs. Table 15 shows the average Bt cottonseed prices for farmers who bought at least part of the volume they used (prices in Yuan, approximate exchange rate being one € for 10 Yuan) , and these values could be explained by the fact that part of the seeds were held back at low cost, if any.
The unit price for seeds did not vary as much. Seeds of the Chinese varieties, at least for the non-hybrids, were around 30% less expensive than the American seeds but it seems that the price gap for similar varieties is diminishing. Some farmers used hybrid seeds, whose price was higher than open-pollinated ones, but still lower than the American varieties. The prices increased during the last season, a trend that could be interpreted as the result of farmers' acknowledgement to the values of the Bt cottonseed while the competition of the Chinese varieties could no longer be associated only to their lower costs. The seed dosages used for planting (Table 16) did not vary between the varieties used, i.e. 18-19 kg/ha (this figure is much higher that the usual 12-15 kg/ha dosage), except for the Chinese hybrids for which the farmers reduced the amount used. The overall cost of the seeds was around 25% of the total cost associated with the cash-expense inputs.
Table 14. A widespread phenomenon of the farmers holding back seeds
1 2 3
Seed obtained from exchange 1% 0% 0% 1%
Seeds are partly bought and holdback 26% 29% 75% 30%
Seeds are totally bought 53% 33% 0% 45%
Seeds are totally holdback 20% 38% 25% 25%
Total 100% 100% 100% 100%
Source: our survey
Distribution of the farmers' answers according to the number of varieties used
All farmers
Table 15. Unit prices for Bt cotton (yuan/kg)
2002 2003
Non-hybrid 27,4 37,1
Hybrid 40,0 45,0
USA Non-hybrid 41,1 50,7
Source: our survey
Origin of varieties Type of varieties Campaign
Chinese
Table 16. Seed dosage (kg/ha)
2002 2003
Non-hybrid 19,4 19,0
Hybrid 19,5 13,1
USA Non-hybrid 18,9 18,2
Source: our survey
Origin of varieties Type of varieties Campaign
3.3. Cotton growing is profitable
Growing Bt-cotton proved to be profitable to farmers. After deduction of the chemical input costs, which are the main part of the cash expenses for the farmers, the remaining income (Table 17) ranged from 10000 to 15000 yuan/ha in the 2002 season, and significantly higher in 2003 (from 13000 to more than 18000 yuan/ha). The financial profitability of growing cotton was further confirmed by the output/input ratio, which was far higher than the commonly accepted 2.5-3.0 threshold (Table 18). These values of ratio result directly from the high level of the yield achieved and the relative prices of the inputs and output which are opposite to what is observed commonly in developing countries. The slight variation in the average yield, as we underlined earlier, further indicated that there was little risk associated with this financial profitability.
Table 17. Cotton net income after deduction of chemical input expenses (yuan/ha)
2002 2003 Chen Zhuang 13 228 17 438 DaWangZhuang 14 848 Fang Ya 10 591 14 414 ShiJiaBao 12 937 18 369 Song Zuang 11 173 19 828 XiJing Ke 11 829 14 664 All villages 11 798 17 093
Source: our survey
Table 18. Output/input ratio in growing cotton
Chen Zhuang DaWang Zhuang Fang Ya ShiJia Bao Song Zhuang XiJing Ke
2002 6,9 7,9 5,3 6,5 5,1 5,8
2003 8,8 6,3 6,9 8,2 6,7
Source: our survey
Surveyed villages
All the surveyed farmers planned to keep on growing Bt cotton, and most of them were considering growing more Bt cotton, generally for reasons related to the higher expected profitability.
3.4. Profitability derived from favourable diffusion rules
Although most of the results of the analysis seemed to associate the adoption of Bt cotton with its intrinsic advantages, we believe that two complementary factors matter in China, both pertaining to institutional arrangements (Fok, et al., 2004). Profitability is firstly ensured by the conditions established in launching Bt cotton, so that the cost associated with its use is thus acceptable. In China, farmers have benefited from rules for using Bt cotton, which differ substantially from those imposed in other countries. Secondly, the financial risk linked to the higher production cost is mainly managed through control of cotton lint imports from the world market. By somewhat isolating the Chinese market even though there is high demands from the national textile industry, the Chinese government contributes to sustaining a high
purchase price for farmers' cotton.
Everywhere Bt-cotton is introduced, mainly by the American firm Monsanto, the payment of technology fees and the formal contractual commitment to not hold back seeds (via any vegetative form) are two institutional arrangements which are imposed without much debate. The technology fees, in addition to the seed cost, is around US$ 60/ha nowadays after having reached up to US$ 90. The very formal contractual arrangement and the application of the rules in countries where contracts are actually enforceable gave rise to great publicity concerning cases of violations with decisions made in favour of the biotech and seed companies (notably in Canada and the USA).
China succeeded in imposing a totally different set of rules by preventing the set up of a monopolistic situation from the American firms. In 1996, these firms were invited to endorse a joint venture with the Hebei Seed Company, while another Chinese firm, in collaboration with the Chinese Academy of Agricultural Sciences, was installed. Bt cotton seed is supplied under conditions that prevail in Western countries for common seeds. Seeds are only bought and there is no requirement for farmers to sign a contract and make a commitment to follow special cultivation techniques (like refuge plot to prevent the emergence of resistance by the targeted pest to the Bt toxin). The prices farmers pay are all inclusive, with no distinction or mention of any technology fee.
If the Chinese farmers benefit in one side of specific rules which keep the use of the cotton GMVs at reasonable cost, they take advantage in the other side of attractive price for the cotton they produced.
As a condition to obtaining US support for its entry into the WTO, the Chinese government accepted to give up most of the different forms of domestic support given to farmers. In spite of this direct subsidy abolition, Chinese farmers still benefit positively from isolation from the world market price since the importation of cotton lint from the world market is still strongly controlled by the central government (Weathersby, 2002). As a consequence, farmers sold their cottonseed and obtained a farm gate price equivalent to US$ 0.66/pound and 0.89/pound of cotton lint in 2002 and 2003, respectively, whereas the world market price was US$ 0.46 and 0.63 from the CIF Northern Europe position. This price level makes cotton production very attractive and profitable, as we pointed out earlier, and reduces the financial risk in using Bt cotton despite the additional seed cost.
4.
Cereal production further loosing groundIn the area where our survey was conducted, farmers are growing essentially cotton, wheat and maize; these two cereals are very frequently grown sequentially and sometimes
relay-cropped. In analysing the results of the survey, we observed that few farms have got into some specialisation at the expense of the cereal production. Farmers are seldom devoting less than 40% of their cultivated land to cotton. This is an indication that cereal production is loosing ground against cotton. This is a phenomenon which is quite illustrative of what occurs in China in general and which results from the reduced profitability of the cereal production, in particular wheat, and to a lesser extent, maize. We put aside the rice case which is not really produced in the Province we surveyed.
4.1. Decreasing Cereal production under structural change
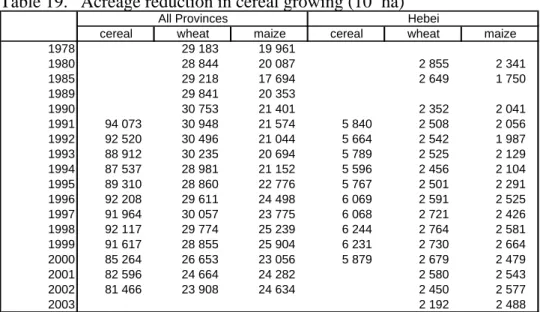
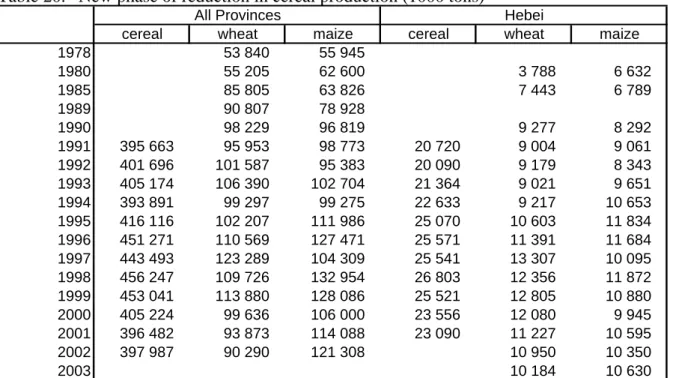
Wholly speaking, the evolution of the production of wheat and maize has been unsteady during the last fifteen years, both at the national level and in Hebei Province. The acreage devoted to maize and wheat decreased till 1994, but it augmented again till 1999 before decreasing again (Table 19). As the very severe cotton pest resistance to chemicals occurred in 1993 and the large adoption of cotton GMVs became real after 1998, the evolution of the acreage destined to maize and wheat might have been influenced by the security of the income in growing cotton. From this perspective, this is a sign that the introduction of GMVs on a competing crop (cotton) impacted very quickly and negatively on the cereal production, notably on the cereal acreage since the year 2000 (Table 20). In terms of the relative shares of wheat and maize, it comes out that maize caught up wheat and their respective acreages are very close. Since maize is more productive, the maize production is significantly higher than the wheat production at the national level. In Hebei, a typically wheat region, the maize production has just come close to the wheat production. The evolution of the maize production can be regarded as an indication of the demand for animal feed for which maize is often an essential raw material.
Table 19. Acreage reduction in cereal growing (103 ha)
cereal wheat maize cereal wheat maize
1978 29 183 19 961 1980 28 844 20 087 2 855 2 341 1985 29 218 17 694 2 649 1 750 1989 29 841 20 353 1990 30 753 21 401 2 352 2 041 1991 94 073 30 948 21 574 5 840 2 508 2 056 1992 92 520 30 496 21 044 5 664 2 542 1 987 1993 88 912 30 235 20 694 5 789 2 525 2 129 1994 87 537 28 981 21 152 5 596 2 456 2 104 1995 89 310 28 860 22 776 5 767 2 501 2 291 1996 92 208 29 611 24 498 6 069 2 591 2 525 1997 91 964 30 057 23 775 6 068 2 721 2 426 1998 92 117 29 774 25 239 6 244 2 764 2 581 1999 91 617 28 855 25 904 6 231 2 730 2 664 2000 85 264 26 653 23 056 5 879 2 679 2 479 2001 82 596 24 664 24 282 2 580 2 543 2002 81 466 23 908 24 634 2 450 2 577 2003 2 192 2 488
Source: China Statistical Yearbooks and statistics from the Hebei Provincial Government
Table 20. New phase of reduction in cereal production (1000 tons)
cereal wheat maize cereal wheat maize
1978 53 840 55 945 1980 55 205 62 600 3 788 6 632 1985 85 805 63 826 7 443 6 789 1989 90 807 78 928 1990 98 229 96 819 9 277 8 292 1991 395 663 95 953 98 773 20 720 9 004 9 061 1992 401 696 101 587 95 383 20 090 9 179 8 343 1993 405 174 106 390 102 704 21 364 9 021 9 651 1994 393 891 99 297 99 275 22 633 9 217 10 653 1995 416 116 102 207 111 986 25 070 10 603 11 834 1996 451 271 110 569 127 471 25 571 11 391 11 684 1997 443 493 123 289 104 309 25 541 13 307 10 095 1998 456 247 109 726 132 954 26 803 12 356 11 872 1999 453 041 113 880 128 086 25 521 12 805 10 880 2000 405 224 99 636 106 000 23 556 12 080 9 945 2001 396 482 93 873 114 088 23 090 11 227 10 595 2002 397 987 90 290 121 308 10 950 10 350 2003 10 184 10 630
Source: China Statistical Yearbooks and statistics from the Hebei Provincial Government
All Provinces Hebei
4.2. Comparatively low profitability of the cereal production
China liberalized the cereal market at the beginning of the 1990s. No more official price was set up and there was no longer obligation for the farmers to sell to the governmental commodity offices at pre-determined prices: farmers got the freedom to sell directly to the market whenever and wherever they wanted. The fact that farmers withdrew somewhat from cereal production indicates that the profitability did not increase as much as expected from the liberalisation process.
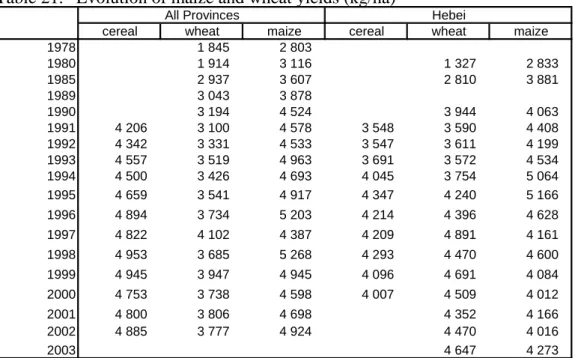
It is not very clear that the profitability in growing maize or wheat was constrained so much by an unfavourable yield trend. Yield was maintained during the last ten years and when considering the case of wheat, one could say that yield has increased to some extent (Table 21). Although the precision of the official statistics are questionable, in particular if we refer to our survey which showed higher yields (Table 22), we think that the evolution pointed out should be valid.
The evolution of the prices and in particular of the price ratios has been more crucial in determining the structural change which took place between the cereal production (maize and wheat) and cotton in one hand, and, in the other hand, between the two cereal involved.
Very clearly, the price ratio between wheat and maize has decreased at the expense of wheat while maize has higher yield (Table 23). This evolution should account in the shift in favour of maize. The shift in favour of cotton growing results from the same phenomenon. It can be observed the price ratio in favour of cotton during the last ten years has been far higher -with
the exception8 of 2001- than the one when the commodities prices were administered to promote cereal production.
Table 21. Evolution of maize and wheat yields (kg/ha)
cereal wheat maize cereal wheat maize
1978 1 845 2 803 1980 1 914 3 116 1 327 2 833 1985 2 937 3 607 2 810 3 881 1989 3 043 3 878 1990 3 194 4 524 3 944 4 063 1991 4 206 3 100 4 578 3 548 3 590 4 408 1992 4 342 3 331 4 533 3 547 3 611 4 199 1993 4 557 3 519 4 963 3 691 3 572 4 534 1994 4 500 3 426 4 693 4 045 3 754 5 064 1995 4 659 3 541 4 917 4 347 4 240 5 166 1996 4 894 3 734 5 203 4 214 4 396 4 628 1997 4 822 4 102 4 387 4 209 4 891 4 161 1998 4 953 3 685 5 268 4 293 4 470 4 600 1999 4 945 3 947 4 945 4 096 4 691 4 084 2000 4 753 3 738 4 598 4 007 4 509 4 012 2001 4 800 3 806 4 698 4 352 4 166 2002 4 885 3 777 4 924 4 470 4 016 2003 4 647 4 273
Source: China Statistical Yearbooks and statistics from the Hebei Provincial Government
All Provinces Hebei
Table 22. Higher yields in the surveyed areas in 2002 and 2003
No Yes
Total production, kg 2 042 3 059
Yield, kg/ha 7 000 6 728
Total production, kg 1 663 2 800
Yield, kg/ha 5 938 5 877
Note: only few farmers are not conducting relayed cropping
Relayed cropped
maize
wheat
Table 23. Evolution of the Average Purchase prices in current Yuan/ton and price ratios
Corn Cotton Wheat cotton/corn cot/wheat wheat/maize
1978 187 2 408 276 12,9 8,7 1,5 1980 227 3 099 326 13,7 9,5 1,4 1983 228 3 045 330 13,3 9,2 1,4 1984 596 6 527 876 10,9 7,5 1,5 1985 366 5 906 496 16,1 11,9 1,4 1986 442 6 696 590 15,2 11,3 1,3 1987 487 7 617 637 15,6 12,0 1,3 1988 548 8 352 782 15,2 10,7 1,4 1989 782 10 900 1 180 13,9 9,2 1,5 1990 729 8 900 1 049 12,2 8,5 1,4 1991 618 6 888 859 11,1 8,0 1,4 1992 665 6 058 880 9,1 6,9 1,3 1993 752 7 381 865 9,8 8,5 1,2 1994 1 056 11 727 1 152 11,1 10,2 1,1 1995 1 612 14 000 1 744 8,7 8,0 1,1 1996 1 491 14 000 1 756 9,4 8,0 1,2 1997 1 490 14 000 1 441 9,4 9,7 1,0 1998 1 579 13 000 1 298 8,2 10,0 0,8 1999 1 200 9 400 7,8 2000 856 10 350 1 057 12,1 9,8 1,2 2001 967 7 571 1 050 7,8 7,2 1,1 2002 1 000 12 000 1 100 12,0 10,9 1,1
Absolute price Price ratios
8
During the world market year of 2001, the cotton price corresponded to a historic low level which was transferred to the price applied in China
Such high level of price ratio in favour of cotton is not sustained by similar gap in terms of production costs. Since agricultural production is family-based in China, we are reluctant to integrate ex-ante valuation of the labour cost to fully assess the production costs. We hence limit ourselves to focus on the cash expenses engaged in the crop production and which are mainly represented by the fees paid for seeds and chemicals.
Owing to the fact that wheat and maize are sequentially grown, it could be somewhat misguiding to assess the input costs on the basis of individual crop and this is particularly true with regard to fertilizing. Some fertilizers brought on the first crop, and this is the case for phosphorous fertilizers, are actually used also by the second one. Under this reservation and according to the results of our survey, maize appears to require far less cash expenses for the payment of inputs than wheat, but this is mainly due to the fertilizer costs. This outcome is consistent with the results provided by the surveys implemented steadily in China at provincial level: maize appears to be less demanding in input costs, although the gap is less large as the one we observed (0).
The input costs for growing cotton are quite close in the 2002 and 2003 campaigns and they are not really so much superior to the ones of wheat (Table 24). In the time series collected at the national level (0), the gap between cotton and wheat was larger -at the expense of cotton- than the one we observed: this could be related to the adoption of the cotton GMVs which reduced costs.
Table 24. Costs of the chemicals used in producing corn, cotton and wheat (Yuan/ha)
2002 2003
Corn 1 220 1 432
Cotton 2 411 2 592
Wheat 2 547 2 192
Excessively favourable price ratio for cotton and reduced production costs are two converging items, in addition to some yield gain which is reported (Huang, et al., 2003a, Huang, et al., 2002a, Huang, et al., 2003c), which induce a great profitability gap at the expense of maize and wheat. This is observed through the results of our survey (Table 26) for the income net of the input costs of the recent campaigns and which is consistent with the statistics for the previous campaigns, in terms of added values9 (Table 27).
Owing to an insufficient profitability, the prospect of a re-launch of the cereal production in China, in particular in cotton zones, seems to be gloomy. This observation pushes some researchers to advocate the release of the GMVs available for various food crops in order to re-boost their productivity (Huang, et al., 2002b, Lin, et al., 2001). One may nevertheless
9
doubt that this technology injection will be sufficient to reverse a process more structurally-based than usually considered.
Table 25. Evolution of the cash expenses (Yuan/ha)
Corn Cotton Wheat
1978 339 564 378 1980 369 651 441 1983 441 820 499 1984 477 874 546 1985 495 856 576 1986 522 876 615 1987 611 1 005 684 1988 716 1 204 798 1989 906 1 494 1 010 1991 1 033 1 943 1 169 1992 1 062 2 034 1 286 1993 1 141 2 243 1 437 1994 1 650 2 954 1 895 2000 2 071 3 397 3 087 2001 2 053 3 343 2 401
Source: China Rural Statiscal Handbooks & Nat. Cost of production surv Table 26. Income net of the costs of inputs (Yuan/ha)
2002 2003
Wheat 3 821 4 591
Maize 4 789 5 852
Cotton 11 798 17 093
Source: our survey
Table 27. Evolution of the added value in growing corn, cotton and wheat (Yuan/ha)
Corn Cotton Wheat
1980 608 1 601 407 1983 783 2 712 666 1984 1 026 2 813 935 1985 1 010 2 335 872 1986 1 201 2 712 957 1987 1 188 3 120 871 1988 1 163 2 769 840 1989 1 217 4 203 904 1991 1 246 6 026 786 1992 1 616 3 508 1 150 1993 2 744 5 071 1 592 1994 3 536 9 123 2 362 2000 2 783 9 190 1 767 2001 3 828 7 000 2 040
Source: China Rural Statiscal Handbooks & Nat. Cost of production surv
5.
Limited impact foreseen from the release of GMVs on food crops5.1. Risk of over-estimating impacts and productivity gap too large to catch up
As mentioned above, the Chinese research institutions carried out many GMVs for food crops, in particular cereal crops like rice, wheat and maize. China can claim the full ownership of these varieties since many genes have been discovered or result from specific construction by its research teams. These genes provide various types of resistance to harmful insects, to
diseases or to virus. There is a potential to cut the production costs and/or to increase the yield achieved so far. Through the example of the gains obtained on cotton by the use of GMVs, there is ex-ante assessment of the gains which could result from the release of GMVs on food crops. The models used integrate the estimation of the negative effects that might result from the non-acceptance of the GM-commodities by foreign consumers. It is concluded that the Chinese Government should stop blocking the release of the GMVs for the food crops and not over-emphasizing the risk of non-acceptance by the foreign markets (Huang, et al., 2002b, 2003b).
As with any model, the outcomes depend a lot on the assumptions of the anticipated effects. In case that the positive effects on cost reduction and/or yield increase is over-estimated while the negative effects are under-valued, the anticipated global effect could be very much exaggerated. With regard to the extrapolation of the positive impact observed on cotton production to the food crop production, it is worth reminding that cotton growing is more depending on the pesticide use and the yield is very sensitive to distortion to a non-optimal pest control. The first factor is at the basis of the cost reduction observed while the second factor explains the yield gain which was not anticipated firstly by the promoting firms of GMVs. As far as GMVs are not tested at large scale in China on food crops, it is difficult to determine the real scope of the positive effect being anticipated.
In addition, the structures of the production costs are not the same between cotton in one hand and wheat or maize in the other hand (Table 28). The recourse to pesticides is far lower in producing maize and wheat in Hebei Province. What was materialized in the cotton production in terms of cost reduction and yield increase might be minimal on cereal crops as far as pest resistant GMVs are concerned. The cost in fertilizing is quite high: the real challenge is to achieve better economic efficiency in using fertilizers. Probably, in the mid-term, new GMVs enabling better mineral uptake will help. But in the short mid-term, better information on the fertilizer use, in order to prevent over-dosage as it was observed through the rice case (Huang, et al., 2000), should lead more certainly to positive financial and environment impacts.
Table 28. Differentiated Structures of the costs in using chemicals (Yuan/ha)
Cotton maize wheat Cotton maize wheat
Pesticide costs 566 40 34 533 105 91
Fertilizer costs 820 477 1 261 876 695 1 080
Total cost of chemicals 1 386 517 1 295 1 410 799 1 171
Source: our survey
2002 2003
refusal of GM commodities or GM-made agro-foods since the refusal could be total and not only partial.
While dealing with the issue of acceptance/refusal of GM-based commodities or agro-foods from China, it is common to take only the foreign market into account. This could be too much a simplification and leads to erroneous conclusion. It is up to the Chinese tradition to associate food with health. The recent episodes of SARS and mass contamination of poultry in South East Asia, and in particular in China, remind that the way of producing food can impact directly on public health.
The negative reaction of the Chinese consumers cannot be overlooked with regard to the threat of GM-foods on health. The environmental and ecology concern is no longer ignored by the Chinese population so that how safe GM-food might be is debated (Anon., 2001c, 2002, 2004, Zhu, et al., 2000). Greenpeace is becoming very active in China and is supporting some customers' claims against food industry including the world giants in this sector (Anon., 2002, 2003a)}. The concept of "Green Food" already attracts attention and helps to capture a market niche. China decided, more than one year ago, the labelling of GMO content in foods (Anon., 2003b) and this country is having legislation quite close to the one of the European Union. As far as we know, there are no models which take the risk of non-acceptance in China into consideration. This is a factor of over-estimating the positive impacts from the release of GMVs on food crops while some surveys already points out that 100% acceptance by Chinese consumers is not at all guaranteed (Asian Food Information Centre, 2004).
The extent of the adoption of GMVs on food crops might also be less important than what is observed for cotton. The basic reason lies upon the fact that most of the food crops have not experienced the levels of infestations (by insect, disease or virus) which endangered their production and made them very little effective. On cotton, the chock which resulted from the severe pest resistance to some insecticides was so strong that farmers were in the expectation of a new technical solution. One cannot claim that the situation is similar for most of the food crops. This is then another risk of over-estimating the positive impact from the use of GMVs. Probably the release of the GMVs on food crops will help to achieve profitability gain. But the gain needed should be so much large that this release might not be sufficient to reverse the current trend of withdrawal from cereal production. So far, the added value from growing cotton is at least twice the one from wheat or maize. In the short run, we doubt that GM maize or wheat could catch up such a gap. This sounds further difficult if we consider that the first generation of GMVs on maize or wheat will have to compete with cotton GMVs which pertain already to the second generation (combining various genes). This pessimism should
nevertheless be balanced by the hardship in growing cotton, in terms of labour demand at the harvest stage, and in the implementation of the chemical sprays.
5.2. A structural phenomenon beyond technical solution
We believe that the process of reduction in the cereal production is just a signal of a more structural process corresponding to the loss of terms of trade at the expense of the agricultural goods. This process impacts now more strongly on the cereal production but the injection of a new technology should be insufficient to counter the process in operation.
As shown in the Figure 2 above, the income of the rural households is lagging behind the one of the urban population. Furthermore, it comes out that the agricultural activities account less and less in the income of the rural households (Figure 3). By increasing the profitability in the production of maize and wheat, the global result will be to reduce a decreasing trend but likely not enough to reverse this trend. Is this approach worthwhile? Could this approach hamper the materialisation of more promising solution? These are two major issues that should be addressed before any precipitation.
Figure 3. Decreasing contribution from agriculture to the rural households' income
Evolution of the wages in the income of rural households
0% 10% 20% 30% 40% 50% 60% 70% 80% 1978 1983 1988 1993 1998 2003 Agriculture Wage s
Sources: 2002 China Rural Household Survey Yearbook, 2003 China Statistical Yearbook
The Chinese Government seems to have a right understanding of the issue of reduced cereal production, in particular in the regions known as the traditional cereal producing areas of the country. For the first time, this government issued an official policy document devoted
specifically to increase the farmers' income in these areas. The new policy is widely publicized as it was extensively reproduced in all the major newspapers in the country and a specific press conference was organized to help understand the basic principles of the policy (XinHua Web, 2004).
It is noteworthy that the income increase is regarded as the cornerstone of the agriculture policy instead of the output objectives as it is still commonly the case. It is considered that without taking into account the farmers' income purpose, it would be inefficient to expect improving the agriculture outputs.
We can consider that the whole policy lies upon four major principles. One is to implement a reduction of the taxes the farmers are subjected to so far. The agricultural tax is reduced 1% while the tax for special agricultural production is suppressed. The second principle is to sustain the farming profitability through the increase of the farm tenure size. In this regard, the liberalization of the land market is expected to achieve a better use of the land, under the reservation that some land must remained preserved and not open to economic production. The third principle is to sustain the farming productivity through more investment in agriculture. The fourth principle is to further increase the involvement of the farmers' population in the 2nd and 3rd economic sectors (processing and service sectors), by making these sectors furthermore developed and better assisted by the banking system.
The development of the processing industries in rural areas appears to be of paramount importance in order to absorb the labour surplus. It is emphasized to further transform the agricultural products and to move towards their regional labelling in order to achieve higher added value and satisfy the consumers' requirements. Out of China, quality and quality labelling appear to be incompatible with GM content. If the same antagonism prevails in China, the release of GMVs on food crops might seriously threaten the achievement of the new national objective. The Chinese Government is still very prudent with regard to the GM food crops and GM-foods (Anon., 2001b). We think that this is rather in line with the evolution of the Chinese population's concern regarding food quality. It is consistent with the general objective of increasing the rural incomes through further processing agricultural commodities into foods and through the approach of meeting the consumers' demand for quality and safety.
6.
ConclusionIn this paper, we provide confirmation of the trend that China is becoming somewhat dependent on international market for feeding itself. In quantitative terms, China is not producing enough cereals for itself. This trend is exacerbated by the emergence of GM use,
since this use is still prohibited for foodcrops. Should this issue be regarded under dramatic terms? There is no developed country which is totally independent on all of its feeding needs. There is then not so much justification to seek full independency. We think that the inter-dependency between countries is a reality, furthermore when countries have achieved some extent of economic development.
China provides a positive evidence of the use of GMVs by family small holdings in a profitable way. This is opposite to the analysis anticipated by many NGOs because the Chinese farmers benefit from specific and favourable rules. This achievement cannot be extrapolated automatically to other developing countries.
China offers a very interesting case of GM management. The availability of GMVs does not mean necessarily indistinct use of GMVs. The evidence of profitability in using GMVs for some crops does not lead necessarily to the extension of their use on other crops. In China, the issue of releasing the GMVs on foodcrops is under debate. It seems that researchers are in the pro-side, while the government seems to be in the con-side: this is a rather uncommon situation worthwhile to underline. It seems that the current debate is opposing the quantitative approach to the qualitative approach. The fact that the Chinese government is paying concern to the qualitative aspects is an indication of the level of economic development China has achieved.
To us, the caution in postponing the decision of the GM diffusion to food crops remains justified. The extrapolation from the cotton case to food crops deserves deeper insight: the economic impact for the farmers might not be as high as with cotton. The concern related to the GM-food used to be regarded as specific to foreign consumers but it could be a mistake not to pay attention to the reaction from the internal market. Chinese population is very sensitive, by tradition, to the health impact of foods. They might share the foreign concern if this latter appears founded. Besides, the new policy of promoting more food processing and to move towards labelling agro-foods, as an orientation to generate more jobs and higher added value in the rural areas, might question the relevance of launching GMVs for food crops.
References
ANDERSON, K., (1987), "On why agriculture declines with economic growtth". Agricultural economics, 1, pp. 195-207.
ANON., (2001a), "China bans GM crops". Ag. Biotech Reporter, Issue No. issue May 2001 May 2001, pp. 1
ANON., (2001b), "China Prudent Towards Genetically-Modified Crops". publié par Site
ANON., (2001c), "Is Genetically Modified Food Safe?" publié par Site
http://www.bjreview.com.cn/2001/200130/Forum-200130.htm
ANON., (2002), "Nestlé denies GM claim". publié par Site
www.21stcentury.com.cn/print.php?sid=7345
ANON., (2003a), "Against an international giant". publié par Site http://www.sina.com.cn
2003/12/22 22:37 (ShangHai YinMen XingBao)
ANON., (2003b), "GM Foods with an 'ID Card' Debut in Beijing". publié par Site
http://english.peopledaily.com.cn/200307/22/eng20030722_120796.shtml
ANON., (2004), "Consumers still wary of GM products". China Daily, Beijing, of 2004-05-20, pp 1.
ASIAN FOOD INFORMATION CENTRE, (2004), "What consumers in China really think about biotechnology foods". publié par Site
http://www.biotech-online.com.cn/MediaCenter/domestic.htm
BROWN, L., (1991), "Who will feed China?" World Watch, 9-10, pp. 66-76.
BROWN, L. and FLAVIN, C., (1996), "China's challenge to the United States and the earth". World Watch, 5-6, pp. 31-42.
FOK, A. C. M., et al., (2004), "Pro-farmers outcomes from differentiated rules in introducing Bt varieties in an administered cotton sector in China". Communication presented to
Conference '85th EAAE Seminar', Florence, Italy, Sept. 8-11, 2004, p.
FU, Z. and LI, D., (1997), "Thinking about how chinese feed themselves". Journal of China Agricultural University 2, 6, pp. 11-16.
HUANG, J., et al., (2003a), "Biotechnology as an alternative to chemical pesticides: a case study of Bt cotton in China". Agricultural Economics 29, pp. 55-67.
HUANG, J., et al., (2002a), "Transgenic varieties and productivity of smallholder cotton farmers in China". The Australian Journal of Agricultural and Resource Economics 46, 3, pp. 367-387.
HUANG, J., et al., (2002b), "Biotechnology boost to crop productivity in China: trade and welfare implications". Centre for Chinese Agricultural Policy, Chinese Academy of Science, Beijing, 28 p.
HUANG, J., et al., (2003b), "Economic impacts of genetically modified crops in China". Communication presented to Conference '25th International Conference of Agricultural Economists', Durban, South Africa, 1075-1083 p.
HUANG, J., et al., (2003c), "Bt cotton benefits, costs and impacts in China". AgBioForum 5, 4, pp. 153-166.
HUANG, J. and Qiao, F., (2000), "Farmer's perception, knowledge, and pesticide use practices in rice production in China". Centre for Chinese Agricultural Policy, Chinese Acadely of Sciences, Beijing, P.R. of China, 2000 p.
KANG, X., (2003), "Who will feed China? (Shui lai Yang Huo Zhong Guo ?)". publié par Site http://www.511w.com/article/economics/1523.htm
LIN, Y. J., et al., (2001), "L'économie alimentaire chinoise : résultats et perspectives". in La Chine au XXIè siècle. Implications globales à long terme, ed. OCDE, Paris. pp. 79-103
MACILWAIN, C., (2003), "Chinese agribiotech: Against the grain". Nature 422, pp. 111-112. PRAY, C. E., et al., (2002), "Five years of Bt cotton in China - the benefits continue". The Plant Journal 31, 4, pp. 423-430.
PRAY, C. E., et al., (2001), "Impact of Bt cotton in China". World Development 29, 5, pp. 813-825.
TENG, K. and HUANG, J., (2004), "The commercial environment and product development for agricultural biotechnology in China". Centre for Chinese Agricultural Policy, Chinese Academy of Science, Beijing, 31 p.
WEATHERSBY, F., (2002), "US cotton growers crying foul over China". publié par Site
www.cotton-futures.com
XINHUA WEB, (2004), "Press conference related to the No. 1 Central Policy document focussing at increasing the farmers' income. Beijing, 2004-02-09". publié par Site
ZHU, Z. and LIU, X., (2000), "Genetically Modified Crops -- Frankenstein or Savior?" publié par Site http://www.agri.ac.cn/agri_net/12/12-2/12-2-08/000101.html