Theor Appl Genet (2004) 109: 618–629 DOI 10.1007/s00122-004-1665-1
O R I G I N A L PA P E R
A. Hund . Y. Fracheboud . A. Soldati . E. Frascaroli . S. Salvi . P. Stamp
QTL controlling root and shoot traits of maize seedlings under
cold stress
Received: 19 December 2003 / Accepted: 20 March 2004 / Published online: 4 June 2004 # Springer-Verlag 2004
Abstract The improvement of early vigour is crucial for the adaptation of maize (Zea mays L.) to the climatic conditions of central Europe and the northern Mediterra-nean, where early sowing is an important strategy for avoiding the effect of summer drought. The objectives of this study were to identify quantitative trait loci (QTL) controlling cold-related traits and to investigate the relationships among them. A set of 168 F2:4 families of
the Lo964 × Lo1016 cross was grown in a sand– vermiculite substrate at 15/13°C (day/night) until the one-leaf stage. Twenty QTL were identified for the four shoot and two seed traits examined. Analysis of root weight and digital measurements of the length and diameter of primary and seminal roots led to the identi-fication of 40 QTL. The operating efficiency of photosystem II (ΦPSII) was related to seedling dry weight
at both the phenotypic and genetic level (r=0.46, two matching loci, respectively) but was not related to root traits. Cluster analysis and QTL association revealed that the different root traits were largely independently inherited and that root lengths and diameters were mostly negatively correlated. The major QTL for root traits
detected in an earlier study in hydroponics were confirmed in this study. The length of the primary lateral roots was negatively associated with the germination index (r= −0.38, two matching loci). Therefore, we found a large number of independently inherited loci suitable for the improvement of early seedling growth through better seed vigour and/or a higher rate of photosynthesis.
Introduction
Maize (Zea mays L.) cultivars that show early vigour are desirable for enhancing crop establishment in areas in which low temperature retards early seedling growth (Miedema 1982) or where breeding for earliness is a strategy for avoiding the effect of drought at flowering (Mock and McNeil1979). There are three stages of early plant development: germination, heterotrophic growth and early autotrophic growth. The performance of the genotypes during these stages is referred to as seed vigour (Perry1987), seedling vigour and early vigour (Revilla et al. 1999), respectively. Depending on the breeding mate-rial and the environment, tolerance to cold at all three stages may be controlled by the same set of genes (Mock and Eberhart 1972) or may be inherited independently (Hodges et al. 1997; Mock and Eberhart 1972; Revilla et al. 2000). Ideally, a vigorous genotype will perform well during all these stages (Hodges et al. 1997; Revilla et al.
2000). While seed vigour ensures an uniform germination and plant establishment (Perry1987), early vigour ensures successful transition to the autotrophic growth stage. Heterotrophic carbohydrate supply can influence plant performance significantly (Revilla et al. 1999) but, in particular under cold stress, the development of a func-tional photosynthetic apparatus may be of great impor-tance as early as the very early growth phase (Hund2003). The critical temperature threshold for maize growth coincides with the soil temperature during the early developmental stages (Richner et al. 1996) and ranges from 10°C to 17°C depending on the trait and cultivar (Blacklow 1972; Bowen 1991; Haldimann et al. 1996). This paper is dedicated to our friend and colleague Alberto Soldati,
who passed away unexpectedly. Communicated by H.C. Becker
A. Hund . Y. Fracheboud . A. Soldati . P. Stamp
Institute of Plant Science, Swiss Federal Institute of Technology (ETH),
ETH-Zentrum,
8092 Zürich, Switzerland E. Frascaroli . S. Salvi
Dip. Scienze e Tecnologie Agroambientali (DiSTA), Università di Bologna,
Bologna, Italy Present address: A. Hund (*)
Department of Plant Agriculture, University of Guelph, Guelph, ON, Canada, N1G 2W1
e-mail: [email protected] Fax: +1-519-7638933
Low temperature affects leaf development (Beauchamp and Lathwell 1966; Stone et al. 1999), photosynthetic efficiency of the seedlings (Fryer et al.1998; Leipner et al.
1999; Stirling et al.1991) and root development (Engels
1994; Stamp 1984). Consequently, shoot development at suboptimal soil temperatures may be limited due to a direct effect of temperature on the shoot meristem or to a reduced supply of nutrients through the roots (Engels and Marschner 1990). In general, a highly structured root system is associated with vigorous plant development at the early stages in both the growth chamber (Richner et al.
1997; Stamp 1984) and the field (Richner et al. 1996,
1997).
Detailed descriptions of maize roots are scarce, and the information on quantitative trait loci (QTL) for root traits that is available is mainly for the number (Guingo et al.
1998; Lebreton et al. 1995), weight (Tuberosa et al.
2002b), diameter (Guingo et al. 1998; Tuberosa et al.
2002b) or pulling strength (Landi et al.2002; Lebreton et al. 1995) of the roots but not for their length. There has been no report of a study that has searched for QTL controlling root morphology under mild-chilling stress, as it occurs commonly in the field. On the other hand, QTL have been mapped for the cold tolerance of the photosynthetic apparatus (Fracheboud et al. 2002). In the population examined in this study, QTL for cold tolerance at germination (E. Frascaroli et al., unpublished data) and for root traits in hydroponics and in the field (Tuberosa et al. 2002b) have already been described. The goal of this study was to identify QTL for vigour-related morpho-physiological traits in order to determine the relationship among traits at low temperature and the consistency of root morphology across the QTL experiments.
Material and methods
Plant material
A population of 168 maize (Zea mays L.) F2:4families of a cross of
two dent parents (Lo964 × Lo1016) was used for the QTL experiment. The parents were chosen on the basis of their contrasting root morphology (Sanguineti et al. 1998) and their different levels of cold tolerance at germination (E. Frascaroli et al., unpublished data). Lo964 is characterised by a very intensive root system (a dominating primary root) and a high cold tolerance at germination; Lo1016 develops an extensive root system (uniform root types) and its cold tolerance at germination is low. The Lo964 and Lo1016 inbred lines, together with 168 F2:3 families derived
from a corresponding number of randomly chosen F2families, were
provided by Dr. M. Motto (Experimental Institute for Cereal Crops, Bergamo, Italy). The F2:4seeds were produced in the nursery of the
Department of Agro-environmental Science and Technology (DiSTA; University of Bologna, Italy) by selfing 20 randomly selected plants for each F2:3and bulking an equal amount of seeds
for each ear.
Experimental conditions
Twenty seeds per genotype with a family-specific kernel weight (±10%) were imbibed for 12 h at 16°C on filter paper in 9-mm petri dishes. The seeds were then surface-sterilised with 2.5% NaOCl for
12.5 min, washed three times with tap water and irrigated with 2 ml of captolate solution (54% Captan, 35% Antrachinon, Omnya, Switzerland) at a concentration of 1 ml l−1. The seeds were germinated at 25°C; then germination was recorded and the seeds placed into PVC columns (7-cm diameter, 25-cm height) when the primary root length was about 3–10 mm. Three germinated seeds per PVC column were placed 2 cm below the surface of the growth substrate.
The growth substrate was a mixture of quartz sand (particle size: 0.08–0.2 mm) and 5% w/w vermiculite powder (Vermex Pulver E, Vermica AG, Bözen, Switzerland) with a volumetric water content of 25%. The water content was adjusted with a modified Hoagland solution containing 7.0 mMCa(NO3)2, 2.0 mM MgSO4, 1.0 mM
H3PO4, 1.5 mMK2SO4, 0.16 mM FeNA-EDTA, 0.05 mM KCl,
18.0μMMnSO4, 12.0 μMH3BO3, 1.5μM ZnSO4, 0.6μMCuSO4
and 4.2μMMoO3. A pH=7 was obtained by adding H2SO4to the
nutrient solution. The moist substrate was packed into PVC columns to a bulk density of 1.25 g cm−3and was covered with a 1.5-cm isolation layer of Perlite (PePe Pflanzen Perlit, Otto Hauenstein Samen, Rafz-Biberist-Landquart-Orbe, Switzerland).
After coleoptile emergence, the PVC columns were placed in a growth chamber (PGW36, Conviron, Winnipeg, Canada). The environmental conditions were set at 12- h-long photo- and thermo-periods, 60/70% (day/night) relative humidity, 15/13°C (day/night) temperatures and 500 μmol m−2 s−1photosynthetic photon flux density (PPFD). The temperature of the substrate was recorded at a depth of 5 cm. Plants were grown until the one-leaf (V1) stage, which was defined by a completely visible collar of the first leaf (Ritchie and Hanway1984).
Measurements
To detect possible maternal effects, we measured average grain weight on three sub-samples of 50 seeds per genotype. Germination was recorded twice per day during the first 4 days and then daily until the seventh day in three independent replications. A germina-tion index (GI) was calculated using the formula of Smith and Millet (1964) GI=[Σ (number of seeds germinated on a given day)×(-number of days after imbibition)]/total day)×(-number of seeds germinated after 7 days. The percentage of germinated seeds was recorded 7 days after imbibition.
All of the photosynthesis-related measurements were performed at the one-leaf stage half-way between the collar and the leaf tip at leaf temperatures of 17°C. Chlorophyll fluorescence was measured on the first and second leaves with a pulse amplitude modulated fluorometer (PAM-2000, Walz, Effeltrich, Germany). The operating efficiency of photosystem II (ΦPSII) was measured on light-adapted
leaves (500 μmol m−2s−1). The maximum quantum efficiency of photosystem II primary photochemistry (Fv/Fm) was determined on dark-adapted leaves. The chlorophyll contents (SPAD values) of the second and third leaves were measured with a Minolta SPAD-502 chlorophyll meter (Minolta, Ramsey, N.J.). The leaf area of the fully developed first leaf and successive leaves was measured with a leaf-area meter (Li-Cor 3100, Lincoln, Neb.).
The root system was removed from the growth columns, washed under pressurised tap water and separated into different root types. The root types (primary, seminal and crown roots) are named according to the nomenclature used by Feix et al. (2000). The main axes of the different root types are termed“axile” according to Cahn et al. (1989), while those roots arising from the axile roots are termed“lateral.” The roots were stained with 75 mg l−1fuchsine dye (Pararosaniline P-1528; Sigma, St Louis, Mo.) for 12 h at 4°C and rinsed under running tap water. The lateral roots were cut from the main axis, and both the axile and lateral roots were distributed separately on a glass tray in a thin layer of water. The tray was placed on a flatbed scanner (Scanjet 4c, Hewlett Packard, Calif.) with a toplight adapter (Scanjet 4c/T) to obtain 8-bit greyscale images (resolution: 600×600 dpi) with a uniform background. The scanned root images were analysed with the computer programme RD (ROOT DETECTOR, ETH Zurich, Switzerland) (Walter and Bürgi
1996), which enables sorting of the measured root lengths into user-defined diameter classes. To obtain the length per diameter-class distribution (LDD), we used a diameter-class spacing of two pixel (84.66 μm). Following calibration with a binocular microscope (bino.) measurements (Øbino.=1.28×ØRD−51.61, r2=0.95), an effec-tive diameter-class spacing of 108.54 μm was obtained, which represents the highest resolution of the scanning system. The dry matter was separately determined after drying at 65°C for 42 h for the stem, leaves and the axile and lateral roots of each of the three different root types.
Statistical analyses
The genotypes (two parental inbreds and 168 F2:4families) were
arranged in a randomised complete-block design with two replications in time (experiments) and two blocks per experiment. Experimental units (PVC columns), each containing three plants, were arranged as a central and a border block according to the light intensity in the growth chamber. Each block contained one experimental unit per F2:4 family and four paired experimental
units of the parental inbred lines.
ThePROC MIXEDprocedure of SAS ver. 8.02 (SAS Institute, 1999– 2001, Cary, N.C.) was used to calculate the adjusted means and to estimate the genetic coefficient of variation (CVG) and the
broad-sense heritability (h2) of the families. CVG is defined as σG/
meanG×100 (%), where σG is the restricted maximum likelihood
(REML) estimate of the standard deviation of the factor genotype (F2:4families), and meanGis its mean value. h2 was calculated as
h2=σG 2 / (σG 2 +σGE 2 /2+σ2/4)×100 (%), whereσGE 2
andσ2are the REML estimates of variance for‘genotype × experiment’ and error, respectively. Simple Pearson correlation coefficients (r) were calculated between the traits using the adjusted means of the F2:4
families. The significance of the correlation coefficient at P≤0.05, 0.01, and 0.001 is indicated as *, ** and ***, respectively.
A hierarchical cluster analysis of the correlation distance matrix among traits was performed using the‘hclust’ function of the ‘mva’ package ofR1.6.2 (Ihaka and Gentleman1996). According to the recommendations of Backhaus et al. (1994) two agglomeration methods were used successively; first, the single agglomeration method to detect outliers, then the Ward’s minimum variance method for the final model.
QTL analyses
QTL analysis was performed using a linkage map with 135 markers, published by Tuberosa et al. (2002b). Composite interval mapping (CIM) was used to identify the QTL and to estimate their effects (Jansen and Stam 1994; Zeng 1994). All calculations were performed with the software developed by Zeng (1994), which is based on QTL mapping by the mixed models and the maximum
likelihood approach (Haley and Knott1992) in combination with the use of selected markers as cofactors. A set of three successive models was used to select cofactors and increase the power of CIM: (1) simple interval mapping for the selection of cofactors, (2) CIM only with unlinked markers as cofactors; (3) CIM with selected markers as cofactors and two markers flanking the tested interval but at least 30 cM from the interval. The markers closest to the maximum of the likelihood profile were chosen as cofactors when a LOD threshold of 3 was exceeded. A QTL was declared as significant when a critical LOD threshold of 3.6 was exceeded. For a joint analysis of an F2population in two experiments, this threshold
is equivalent to a comparison-wise Type-I error probability (α) of 0.005 in aχ2distribution with five degrees of freedom (df). For the seed traits, QTL were estimated on the basis of the means of three replications, and a corresponding LOD threshold of 2.8 forα=0.005 was used. Assuming that each chromosome arm segregates independently, the corresponding experiment-wise Type-I error probability (α′) is approximately 0.1. A joint analysis of the phenotypic data of the two experiments enabled the evaluation of the QTL-by-experiment (Q×E) interaction (Jiang and Zeng1995). The factor “experiment” accounts for the variability in time and space (for technical reasons different growth chambers were used). A LOD threshold of 1 for a significant Q×E interaction was based on the Type-I error rate for a single locus of an F2plant withdf=2.
Multiple regressions were used to evaluate the actual additive effects of QTL and the total percentage of phenotypic variation accounted for by the identified QTL. Because phenotypic evaluation was made on F2:4plants, only the additive effect of the QTL are reported. QTL
positions are described as chromosome number followed by the position of the QTL peak in parenthesis. Distance is given in centiMorgans (cM). In the event of several overlapping peaks, the position of the first and the last peak is given in parenthesis (e.g. chromosome 1 (34–39)=chromosome 1, position 34–39 cM).
Results
Root traits
Image analyses
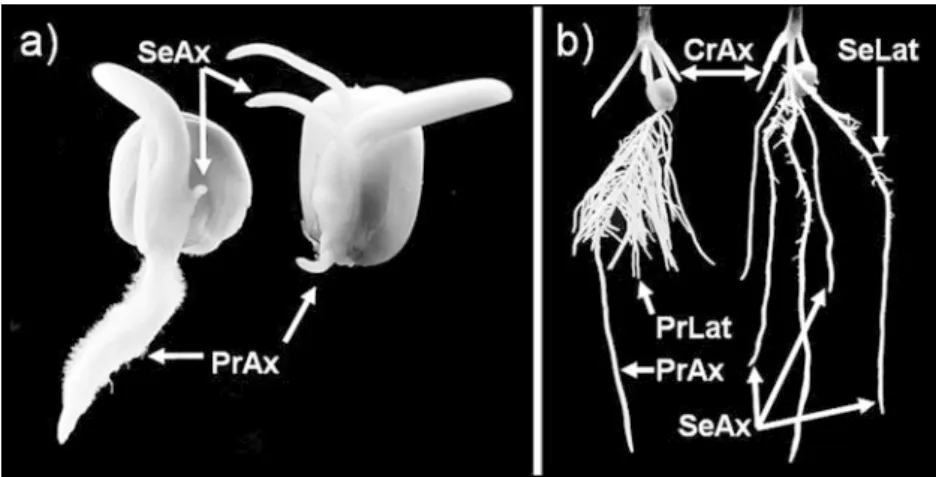
Observations on the root systems of Lo964 and Lo1016 revealed differences that were visually distinct as early as germination (Fig. 1a). Lo964 germinates with a strong primary root that has abundant root hairs, while Lo1016 germinates with a weaker primary root that is soon followed by at least two seminal roots of the same size as the primary root. At the one-leaf stage the parents still differ considerably with respect to root morphological
Fig. 1 Root system of maize (Zea mays L.) dent inbred lines Lo964 (left) and Lo1016 (right) at germination at 25°C (a) and at the one-leaf stage after 2 weeks of growth at 15/13°C (day/ night) in a sand-vermiculite substrate (b). CrAx Crown axile roots,PrAx primary axile root, PrLatprimary lateral roots, SeAx seminal axile roots, SeLat sem-inal lateral roots
organisation. Lo964 is a genotype in which the primary root has a strong main axis and a high number of long, thick lateral roots. Lo1016 is characterized by a primary root that is equal in size to its seminal roots (Fig. 1b).
The digital image analysis confirms the visual charac-terisation of the parents. Figure 2shows the LDD of the parents and the family means. The lengths per diameter class classification of the primary and seminal roots shows a bimodal frequency distribution due to the differences in the diameter of the main and lateral roots. Distinct peaks mark the lateral roots (left) and main roots (right) of all the genotypes. Figure2a shows that the diameter distribution of the primary roots of Lo1016 reaches a first maximum at 0.33±0.05 mm, which represents the primary lateral roots (PrLat), and a second one at 1.41±0.05 mm, which represents the primary axile roots (PrAx). Compared to Lo1016, the LDD curve of Lo964 is shifted towards higher classes, reaching a peak at 0.44±0.05 mm for PrLat and at 1.85±0.05 mm for PrAx. The corresponding LDD curve of the F2:4families is intermediate between those of
the parents. The peaks of the seminal lateral roots (SeLat) of Lo1016 and of the F2:4families are both located at 0.33
±0.05 mm, whereas Lo964 had developed hardly any SeLat by the time of harvest (Fig.2b). The LDD peaks of the seminal axile root (SeAx) of the parents and the families are all at the position 1.1±0.05 mm. All of the peaks are symmetric, which enables calculation of mean root diameters from the LDD data.
Phenotypic analyses
The restricted maximum likelihood analysis revealed that differences in the root traits between the parents were significant only for the components of the primary root, namely PrAx length, PrLat length and PrAx diameter (Table1). While the lateral roots of the parents made up a large proportion of the overall root length (35% for Lo1016 and 74% for Lo964), they contributed little to the
dry weight (DW) of the roots (6% for Lo1016 and 19% for Lo964) This discrepancy underlines the necessity to measure structure rather than DW for a better under-standing of root morphology. PrLat was the prevalent root type of the parent Lo964, representing 73% of the overall root length, while SeAx was the predominant root type of Lo1016, representing 49% of the overall root length. The highest CVGamong the root traits of the F2:4families was
for the length of the lateral roots; the lowest for root diameters and number of axile roots. A transgressive segregation, where the F2:4families showed values outside
the range of the parental genotypes, was observed for all of the root traits. The root counts were unreliable for distinguishing genotypes since heritability was the lowest for these traits, while SeAx diameter and PrAx length were most reliable for distinguishing genotypes on the basis of their high heritability.
QTL analyses
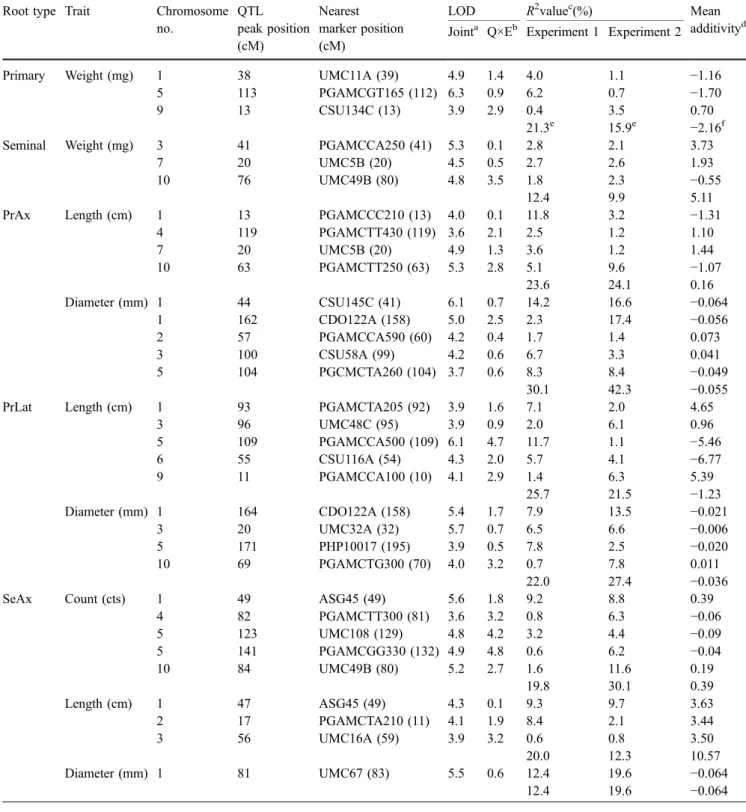
QTL analysis was performed on the components of the embryonic root system (primary and seminal roots) only since these represented 94% of the length of the seedling root system. Table 2 lists the main parameters of the 40 QTL detected (LOD>3.6), six for root weight, 13 for root diameter, 16 for root length and five for the SeAx count. When we considered as overlapping those QTL the peaks of which were within a region of 10 cM, the QTL could be grouped into 26 chromosomal regions, nine of which influenced at least two of the root traits investigated. The highest joint LOD scores were observed on chromosome 4 (10) for SeLat diameter and on chromosome 6(20) for SeLat length (LOD of 11.1 and 7.9, respectively); both QTL showed high LOD scores for the Q×E interaction. QTL with LOD scores above five and a Q×E interaction below the threshold of one were observed on chromosome 1 at 44, 70 and 81 cM as well as on chromosome 3 at 20 cM and 41 cM and chromosome 5 at 113 cM. Depending on the experiment and the trait, 8.6– 42.3% of the phenotypic variability among the families was explained (Table2). A negative sign of the additivity indicates that the trait-increasing alleles were contributed by Lo964. With respect to the sign of the additivity, similar numbers of increasing alleles were distributed among the parents, with the only exceptions being length of both the SeLat (three of four positive alleles from Lo1016) and the SeAx (all positive alleles from Lo1016) as well as the diameter of the PrLat (three of four positive alleles from Lo964). The sum of the estimated additive effects, compared to half the difference between the parental lines, was lower for the SeLat length (2.35 vs. 8.0 cm), the SeAx diameter (−0.064 vs. −0.015 mm) and the SeAx count (0.39 vs. 1.65) but was higher for the PrLat length (−1.23 cm vs. −29.55 cm), the diameter of PrAx (−0.055 vs. −0.240 mm) and the diameter SeLat (0.005 vs. −0.065 mm). This indicates that some of the factors responsible for the differences between the parental lines were not detected.
Fig. 2 Length per diameter-class distribution of primary (a) and seminal (b) roots of the two parental maize inbred lines (Lo964 and Lo1016) and their F2:4offspring (average of 168 families) at the
one-leaf stage. Diameter classes are spaced at regular intervals of two pixels, which correspond to a resolution of 0.1085 mm
T able 1 Summary statistics of the root morphological traits of the two parental inbred lines and their F2:4 segregating of fspring. Plants were grown in two independent experiments with eight replicates for the parents and two for the F2:4 families Root type T rait Parental means F2:4 families Lo964 Lo1016 Maximum Minimum Mean CV G (%) a h 2 (%) b Overall Axile (Ax) Dry weight (mg) 25.7 24.1 NS c 43.2 10.9 24.0 *** d 17 63 Lateral (Lat) Dry weight (mg) 6.2 1.4 NS 19.5 0.0 2.7 *** 36 57 Axile Length (cm) 25.7 53.4 NS 87.3 27.9 48.8 *** 15 56 Lateral Length (cm) 71.8 28.8 *** 105.4 0 45.4 *** 40 67 Primary (Pr) Axile (PrAx) Length (cm) 9.1 7.38 * 17.5 0 9.9 *** 20 72 Diameter e(mm) 1.87 1.39 *** 1.90 1.07 1.51 *** 7 6 3 Lateral (PrLat) Length (cm) 71.4 12.3 *** 96.1 0 35.9 *** 43 65 Diameter (mm) 0.46 0.35 NS 0.61 0.34 0.43 *** 7 7 0 Seminal (Se) Axile (SeAx) Count 1.9 5.2 NS 8.4 2.2 4.6 * 1 2 3 0 Length (cm) 10.1 40.4 NS 65.9 13.8 33.7 *** 19 55 Diameter (mm) 1.24 1.21 NS 1.52 0.87 1.18 *** 9 7 8 Lateral (SeLat) Length (cm) 0.4 16.4 NS 44.3 0.1 9.5 *** 47 55 Diameter (mm) 0.46 0.33 NS 0.47 0.26 0.36 *** 6 5 1 Crown (Cr) Axile (CrAx) Count 3.2 2.9 NS 4.2 1.7 3.0 * 1 0 3 4 Length (cm) 6.4 5.7 NS 1 1.1 1.2 5.4 *** 24 54 *, ***Comparison of means significant at P ≤ 0.05 and 0.001, respectively . NS, Not significant a The genetic coef ficient of variation was calculated from the REML estimate of variance b h 2 =σ G 2 /( σG 2 +σ GE 2 /2 +σ 2 /4), where σG 2 ,σ GE 2 , and σ 2 are the REML estimates of variance for the genotype, genotype × experiment, and error , respectively c Comparison of parental inbreds d Comparison of F2:4 families e Mean diameter was calculated from the length per diameter -class distribution
Table 2 Putative QTL for root traits (LOD>3.6) of 168 F2:4families of the Lo 964 × Lo 1016 cross Root type Trait Chromosome
no. QTL peak position (cM) Nearest marker position (cM)
LOD R2valuec(%) Mean
additivityd Jointa Q×Eb Experiment 1 Experiment 2
Primary Weight (mg) 1 38 UMC11A (39) 4.9 1.4 4.0 1.1 −1.16
5 113 PGAMCGT165 (112) 6.3 0.9 6.2 0.7 −1.70
9 13 CSU134C (13) 3.9 2.9 0.4 3.5 0.70
21.3e 15.9e −2.16f
Seminal Weight (mg) 3 41 PGAMCCA250 (41) 5.3 0.1 2.8 2.1 3.73
7 20 UMC5B (20) 4.5 0.5 2.7 2.6 1.93
10 76 UMC49B (80) 4.8 3.5 1.8 2.3 −0.55
12.4 9.9 5.11
PrAx Length (cm) 1 13 PGAMCCC210 (13) 4.0 0.1 11.8 3.2 −1.31
4 119 PGAMCTT430 (119) 3.6 2.1 2.5 1.2 1.10 7 20 UMC5B (20) 4.9 1.3 3.6 1.2 1.44 10 63 PGAMCTT250 (63) 5.3 2.8 5.1 9.6 −1.07 23.6 24.1 0.16 Diameter (mm) 1 44 CSU145C (41) 6.1 0.7 14.2 16.6 −0.064 1 162 CDO122A (158) 5.0 2.5 2.3 17.4 −0.056 2 57 PGAMCCA590 (60) 4.2 0.4 1.7 1.4 0.073 3 100 CSU58A (99) 4.2 0.6 6.7 3.3 0.041 5 104 PGCMCTA260 (104) 3.7 0.6 8.3 8.4 −0.049 30.1 42.3 −0.055
PrLat Length (cm) 1 93 PGAMCTA205 (92) 3.9 1.6 7.1 2.0 4.65
3 96 UMC48C (95) 3.9 0.9 2.0 6.1 0.96 5 109 PGAMCCA500 (109) 6.1 4.7 11.7 1.1 −5.46 6 55 CSU116A (54) 4.3 2.0 5.7 4.1 −6.77 9 11 PGAMCCA100 (10) 4.1 2.9 1.4 6.3 5.39 25.7 21.5 −1.23 Diameter (mm) 1 164 CDO122A (158) 5.4 1.7 7.9 13.5 −0.021 3 20 UMC32A (32) 5.7 0.7 6.5 6.6 −0.006 5 171 PHP10017 (195) 3.9 0.5 7.8 2.5 −0.020 10 69 PGAMCTG300 (70) 4.0 3.2 0.7 7.8 0.011 22.0 27.4 −0.036
SeAx Count (cts) 1 49 ASG45 (49) 5.6 1.8 9.2 8.8 0.39
4 82 PGAMCTT300 (81) 3.6 3.2 0.8 6.3 −0.06 5 123 UMC108 (129) 4.8 4.2 3.2 4.4 −0.09 5 141 PGAMCGG330 (132) 4.9 4.8 0.6 6.2 −0.04 10 84 UMC49B (80) 5.2 2.7 1.6 11.6 0.19 19.8 30.1 0.39 Length (cm) 1 47 ASG45 (49) 4.3 0.1 9.3 9.7 3.63 2 17 PGAMCTA210 (11) 4.1 1.9 8.4 2.1 3.44 3 56 UMC16A (59) 3.9 3.2 0.6 0.8 3.50 20.0 12.3 10.57 Diameter (mm) 1 81 UMC67 (83) 5.5 0.6 12.4 19.6 −0.064 12.4 19.6 −0.064
Shoot and seed traits
Phenotypic analyses
Mean values and the statistical analysis of shoot and seed traits are shown in Table 3. The parents significantly differed for the following traits: germination, leaf area/root length ratio, shoot/root DW ratio, shoot DW, leaf area, SPAD values of the second leaf, and ΦPSIIof the second
leaf. The differences among families were significant for all traits with the exception of Fv/Fm of the second leaf (Table 3). A transgressive segregation was noted for all shoot traits. Most of the h2values were above 60% with the highest values (69%) for shoot DW and SPAD values of the second leaf. The lowest h2values were found for the germination index (43%) and for Fv/Fm of the second leaf (21%). There was a significant correlation between the SPAD values andΦPSIIof the F2:4families (r=0.54*** for
leaf one and r=0.68*** for leaf two). With respect to the influence of the carbohydrate sources on biomass accumulation, there was a significant correlation between ΦPSII and plant DW (r=0.46***) but not between
seed DW and plant DW.
QTL analyses
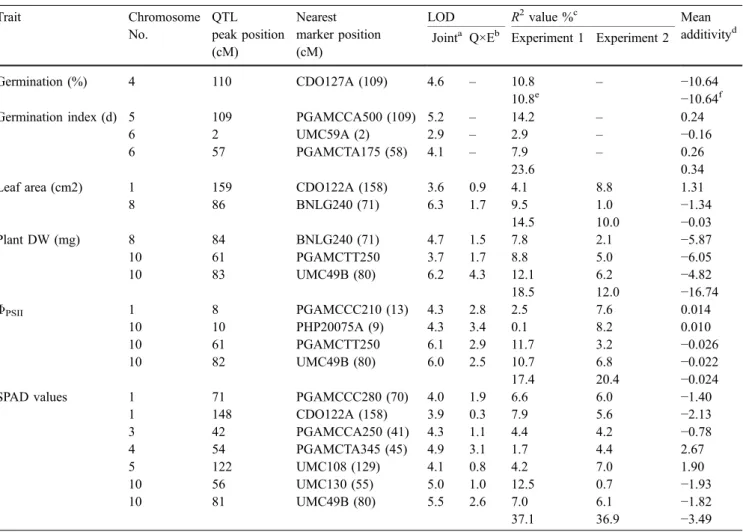
The 20 QTL identified for seed and shoot traits are shown in Table 4. One QTL was detected for germination percentage, three for the germination index, two for the leaf area, three for the plant DW, four forΦPSII, and seven
for SPAD values. The QTL could be grouped into 15 chromosomal regions, of which three influenced at least two of the investigated traits. The highest joint LOD scores above six were observed for the leaf area,ΦPSII, and
the plant DW on chromosome 8(86), 10(61), and 10(83), respectively. Depending on the experiment and the trait,
10.0 to 37.1% of the phenotypic variability among the families was explained by a final multiple regression model. The SPAD values were positively associated with ΦPSII (chromosome 10(56–61) and 10(81–82)). Among
the three QTL for plant DW, two were positively associated with the SPAD values andΦPSII(chromosome
10(56–61), 10(81–83)) and one with the leaf area (chro-mosome 8(84–86)). The positive alleles for these QTL were contributed by Lo964 in all cases.
Root traits and their relation to shoot and seed traits
The parental lines differed significantly for the leaf area/ root length ratio since Lo 964 had a significant higher overall root length than Lo1016 (98 cm vs. 82 cm) (Table 1) and a significant lower leaf area (17 cm2 vs. 24 cm2) (Table 3). The leaf area/root length ratio of the F2:4 families was most closely related to the PrLat and
SeLat length (r=0.72*** and 0.50***, respectively), while the shoot/root DW was related most closely to the PrAx and SeAx diameter (r=−0.32*** and −0.29***, respec-tively) (data not shown).
A hierarchical cluster analysis based on the Ward’s minimum variance method was performed for the root, shoot and seed traits (Fig. 3). Those traits that were obtained as the sum or ratio of others and those that were very strongly correlated were excluded from the analysis. Fv/Fm of the second leaf was also excluded because the variation for this trait was not significant among the families, and grain weight was excluded as an outlier in the first step of the cluster analysis based on the single-linkage method. In general, there were two main clusters: one grouping all the root diameters, the other grouping most of the root lengths and counts. The SPAD values and ΦPSIIformed clusters with the diameters, while plant DW
and leaf area formed clusters with the root length. Both the Root type Trait Chromosome
no. QTL peak position (cM) Nearest marker position (cM)
LOD R2valuec(%) Mean
additivityd Jointa Q×Eb Experiment 1 Experiment 2
SeLat Length (cm) 1 83 UMC67 (83) 4.4 0.8 10.2 6.8 2.71
1 159 CDO122A (158) 4.4 1.8 0.6 14.7 2.49 4 69 PGAMCTT300 (81) 4.3 2.5 2.2 0.9 −3.18 6 20 PGCMCGA450 (20) 7.9 7.8 2.1 2.1 0.33 13.4 20.8 2.35 Diameter (mm) 1 70 PGAMCCC280 (70) 5.4 0.7 6.4 1.9 −0.021 4 10 UMC156A (14) 11.1 10.5 1.7 8.8 0.008 7 74 PGAMCGG150 (72) 3.9 1.0 0.4 1.1 0.018 8.6 11. 1 0.005 a
Joint analysis of the two experiments b
QTL-by-experiment interaction c
R2value, Phenotypic variance explained by each QTL d
Additive effects represent the substitution of a Lo964 allele with a Lo1016 allele e
R2of the final multiple regression model f
Sum of the additive effects Table 2 (continued)
SPAD values andΦPSIIwere frequently related to the root
diameter traits (r=0.17* to 0.30**) but not to root length. In contrast, plant DW and leaf area were always significantly correlated to root length (r=0.23** to 0.42**). It is noteworthy that the germination index clustered with the PrLat length. There were significant correlations between PrLat length and germination
percentage (r=0.33**) and germination index (r=0.38**). The germination percentage was also posi-tively correlated with the PrAx and SeAx diameter (r=0.39** and 0.24**, respectively).
Table 3 Summary statistics for seed, shoot and photosynthesis-related traits of the parental inbred lines and their F2:4segregating offspring. For more detailed information on the parameters, see Table 1
Trait Parental means F2:4families
Lo 964 Lo 1016 Maximum Minimum Mean CVG(%)
a h2(%)b Seed Grain weight (mg)c 237 271 NSd 343 189 277 ***e 9 – Germina-tion Index (d) 2.52 3.62 NS 5.61 2.81 3.62 *** 7 43 Germina-tion (%) 81.9 51.9 ** 1000 17.8 64.6 *** 20 63 Plant Overall dry weight (mg) 102.1 105.3 NS 149.4 36.3 105.3 *** 14 66 Leaf area/ root length 0.19 0.30 *** 0.46 0.15 0.26 *** 18 68 Shoot/ root dry weight 1.61 2.57 *** 3.27 1.26 2.29 *** 11 63 Shoot Shoot dry weight (mg) 63.0 75.6 ** 111.2 21.3 72.8 *** 15 69 Leaf area (cm2) 17.2 24.1 *** 31.4 13.0 22.2 *** 12 63 Photosynthesis Leaf 1 SPAD va-lues 27.0 20.7 NS 30.8 12.7 23.6 *** 11 58 Leaf 1 ΦPSII 0.25 0.28 NS 0.40 0.10 0.25 *** 21 66 Leaf 2 SPAD va-lues 22.5 11.7 *** 27.0 6.28 18.3 *** 19 69 Leaf 2 ΦPSII 0.28 0.19 *** 0.37 0.08 0.23 *** 16 56 Leaf 2 Fv/ Fm 0.70 0.62 NS 0.75 0.36 0.63 NS 5 21
*, **, ***Comparisons between mean values are significant at P≤0.05, 0.01 and 0.001, respectively. NS, Not significant a
The genetic coefficient of variation was calculated from the REML estimate of variance b
h2=σG2/(σG2+σGE2/ 2+σ2/4), whereσG2,σGE2, andσ2are the REML estimates of variance for the genotype, genotype × experiment, and error, respectively
cAverage seed weight ±10% d
Comparison of parental inbreds e
Discussion
Root traits
The population investigated in this study had already been shown to have genetic variability for root morphological traits (Landi et al.2001), and QTL had been successfully mapped for these traits under optimum temperature (Tuberosa et al. 2002b). In the present study, the root structural parameters were investigated to establish differ-ences among genotypes in cold conditions. The lateral root length is the most reliable trait for establishing differences among the genotypes due to its high CVG and
consider-ably high h2. The lowest CVG was observed for root
diameters and root counts. In contrast to the observations of Cahn et al. (1989), we found that the relationship between the diameter and the length of the roots was usually negative, possibly due to the effect of the low soil temperature, at which maize roots are known to grow thicker and less branched (Brouwer 1967; Cutforth et al.
1986; Stamp 1979). The negative phenotypic relationship between root length and root diameter was verified by four out of six loci. For example, an increase in PrAx diameter Table 4 Putative QTL for seed (LOD>2.8) and shoot traits (LOD>3.6) of 168 F2:4 families of the Lo964 × Lo1016 cross
Trait Chromosome No. QTL peak position (cM) Nearest marker position (cM)
LOD R2value %c Mean
additivityd Jointa Q×Eb Experiment 1 Experiment 2
Germination (%) 4 110 CDO127A (109) 4.6 – 10.8 – −10.64
10.8e −10.64f
Germination index (d) 5 109 PGAMCCA500 (109) 5.2 – 14.2 – 0.24
6 2 UMC59A (2) 2.9 – 2.9 – −0.16
6 57 PGAMCTA175 (58) 4.1 – 7.9 – 0.26
23.6 0.34
Leaf area (cm2) 1 159 CDO122A (158) 3.6 0.9 4.1 8.8 1.31
8 86 BNLG240 (71) 6.3 1.7 9.5 1.0 −1.34 14.5 10.0 −0.03 Plant DW (mg) 8 84 BNLG240 (71) 4.7 1.5 7.8 2.1 −5.87 10 61 PGAMCTT250 3.7 1.7 8.8 5.0 −6.05 10 83 UMC49B (80) 6.2 4.3 12.1 6.2 −4.82 18.5 12.0 −16.74 ΦPSII 1 8 PGAMCCC210 (13) 4.3 2.8 2.5 7.6 0.014 10 10 PHP20075A (9) 4.3 3.4 0.1 8.2 0.010 10 61 PGAMCTT250 6.1 2.9 11.7 3.2 −0.026 10 82 UMC49B (80) 6.0 2.5 10.7 6.8 −0.022 17.4 20.4 −0.024
SPAD values 1 71 PGAMCCC280 (70) 4.0 1.9 6.6 6.0 −1.40
1 148 CDO122A (158) 3.9 0.3 7.9 5.6 −2.13 3 42 PGAMCCA250 (41) 4.3 1.1 4.4 4.2 −0.78 4 54 PGAMCTA345 (45) 4.9 3.1 1.7 4.4 2.67 5 122 UMC108 (129) 4.1 0.8 4.2 7.0 1.90 10 56 UMC130 (55) 5.0 1.0 12.5 0.7 −1.93 10 81 UMC49B (80) 5.5 2.6 7.0 6.1 −1.82 37.1 36.9 −3.49
a–fFor more detailed information on the parameters, see Table 2
Fig. 3 Dendogram obtained from hierarchical cluster analysis of seed, root and shoot traits of 168 F2:4families of the
Lo964 × Lo1016 cross. The cluster analysis was performed using the correlation distance matrix and Ward’s minimum variance method
was associated with a decrease in SeAx length on chromosome 1(44–47), and an increase in SeAx diameter was associated with a decrease in SeLat length on chromosome 1(81–83).
Hierarchical cluster analyses grouped the different root traits into distinct sub-clusters, and this finding is in accordance with their different genetic control. In fact, genes controlling the different root traits (e.g. rtcs and rt1) have been identified as have genes controlling the overall formation of lateral roots (e.g. slr1, slr2) (Feix et al.2000). However, most of these genes are not mapped precisely enough to test their association with the QTL controlling the root traits in this study. The relatively high number of detected QTL regions and their distribution over the whole genome confirms the complexity of the inheritance of root traits, as reported by Tuberosa et al. (2002b). However, the different root types (primary and seminal roots) were not always completely independently inherited. For example, an increase in SeAx length and count was associated with a decrease in PrAx diameter on chromosome 1(44–49), and an increase in SeLat length was associated with a decrease in PrAx and PrLat diameters on chromosome 1 (159–164). This could be due to close linkage but could also have pleiotropic causes—for example, a result of the compensation for the poor development of one root type by another.
The small differences between the R2values of the final simultaneous fit and the sum of the R2 values of the individual QTL indicate that epistasis played only a minor role in controlling the traits. The fairly balanced number of positive alleles contributed by each parent supports the observation of transgressivity, as indicated by the larger range of variation found for the F2:4families compared to
the difference between the parental lines. However, this was not the case for traits that the parents differed strongly for: positive alleles for SeAx and SeLat length were almost exclusively contributed by Lo1016, while those for PrLat diameter were almost exclusively contributed by Lo964.
Stability of root traits across environments
Differences in the organisation of the embryonic root system of Lo964 and Lo1016 were reported by Landi et al. (2001) and Sanguineti et al. (1998); the QTL controlling root traits at close-to-optimum temperature conditions were mapped by Tuberosa et al. (2002b). A comparison of our results with those previously obtained with the same genetic material allows us to discuss the effect of environmental conditions on QTL detection. However, we may not have found all QTL controlling the traits, given the limited size of the population examined (Beavis
1998; Openshaw and Frascaroli1997) and the associated problems due to genotypic sampling (Utz et al. 2000). A comparison of the root morphology of the two parents grown at close-to-optimum temperature in hydroponics (Landi et al.2001; Sanguineti et al.1998) with that of the parents grown in the sand/vermiculite substrate at low temperature shows that the organisation of the root system
is stable across environments. The parents expressed a nearly identical phenotype in both environments, but overall plant growth was influenced by the different growth conditions realised in the two studies. In fact, plants at the two-leaf stage in hydroponics (Landi et al.
2001) had about the same shoot and root DW as plants at the one-leaf stage grown in the sand/vermiculite substrate, and the diameters of the PrAx roots were about 0.4– 0.5 mm thicker in the sand/vermiculite substrate than in hydroponics. Even though thicker roots are more regularly found at low temperatures than at the optimal temperature (Brouwer 1967; Cutforth et al. 1986; Stamp 1979), these differences in root diameter may also be due to the different substrates. The similarity of root traits grown in hydroponics and in sand/vermiculite suggests the possibi-lity of finding common QTL controlling the traits under both conditions. However, Jansen et al. (1995) pointed out that the chances of detecting a QTL in several environ-ments is small, even when the QTL-by-environment interaction is not significantly relevant. To compare the QTL found in this study with those detected by Tuberosa et al. (2002b), we only considered directly comparable traits (diameter and length of PrAx and weight of primary and seminal roots): seven of the QTL reported by Tuberosa et al. (2002b) were confirmed to have the same genomic location, all of them with the same sign of additive effects. Of these, two of the three regions with the highest LOD values found by Tuberosa et al. (2002b) were confirmed in this study—the locus for seminal root weight and the length and count of SeAx on chromosome 1(44– 49) (LOD=3.3 for seminal weight) and the locus for primary root weight on chromosome 1(34–38). The third major QTL detected by Tuberosa et al. (2002b) for PrAx diameter on chromosome 1(89) fell just below the LOD threshold in the present study. QTL for root traits have been identified in various other populations at the same positions that we found to control the primary root weight at 38 cM (bin 1.03) and the PrAx diameter at 89 cM (bin 1.06) (Tuberosa et al. 2002a). Apart from the above mentioned loci on chromosome 1, five others were detected in both studies: one on chromosome 2(56–57) for PrAx diameter, two on chromosome 7(12–22) for PrAx length and the seminal root weight, one on chromosome 9 (10–13) for primary root weight, and one on chromo-some 10(74–76) for seminal root weight. As most of the matching QTL in this study were characterised by LOD scores of above four and weak QTL-by-experiment interactions, they can be considered to be very stable.
Shoot and seed traits
Seed vigour, germination and germination index were evaluated at close-to-optimum conditions to reduce the effect of cold stress on plant performance. Nevertheless, there was considerable variation in these traits, which provided us with the possibility to investigate their genetic control. Two of QTL found for these traits confirmed those found by E. Frascaroli et al. (unpublished data) in a study
investigating cold tolerance at germination in the same mapping population. One QTL for percentage germination on chromosome 4(110) matched a QTL for germination at 9°C and 25°C, and one QTL for germination index on chromosome 5(102–109) matched one for germination at 9°C and the germination index in the unpublished study of E. Frascaroli et al.
In agreement with the results of Landi et al. (2001), seed weight was not associated with early plant growth in this study (data not presented). In contrast,ΦPSII, which is well
correlated with the quantum yield of carbon fixation under controlled conditions (Fracheboud et al. 2002), was correlated with plant DW. These results are in agreement with an earlier study on 21 inbred lines where plant DW was also more closely correlated withΦPSIIthan with seed
DW (Hund 2003). This finding suggests that a strong photosynthetic performance is an important attribute for vigorous early growth at low temperatures as early as at the one-leaf stage. The relationship between ΦPSII and
plant DW was confirmed at two loci on chromosome 10 that explained together between 10% and 20% of the phenotypic variance, depending on the experiment.
Root traits and their relation to shoot and seed traits
Root/shoot relationships are often used to elucidate differences in biomass or structure of the different organs. Our study shows that differences in the leaf area/root length ratio of genotypes are mainly due to changes in the structure of the lateral roots, while differences in the shoot/ root DW ratio are due to changes in the thickness of the axile roots. In the cluster analysis, because traits showing negative relationships were considered to be very distant, the root diameters formed a cluster far from the cluster of root lengths as these traits were usually negatively correlated. The photosynthesis-related traits like SPAD values and ΦPSIIwere clustered with root diameter and,
thus, are related to thicker roots. This relationship was confirmed for SeLat diameter and SPAD values on chromosome 1(70–71), there was a close association between the PrAx and PrLat diameter and SPAD values on chromosome 1(148–164). A close relationship between root traits and photosynthesis-related traits and plant DW was not observed in this study. This finding indicates that the root morphological characteristics (intensive versus extensive rooting) alone can not be utilised to improve vigour in terms of an increased photosynthetic ability and plant DW at low temperatures. However, there was a clear influence of seed vigour on PrLat length that could be confirmed on the genetic level on chromosome 5(109) and chromosome 6(55–57) by a co-location of PrLat length and the germination index. In particular, the locus on chromosome 5(109) controlled 12% of the phenotypic variability for the germination index and 14% of the variability of for PrLat length in experiment 1. E. Frascaroli et al. (unpublished data) found a QTL for cold tolerance at germination and the germination index at 9°C at the same locus. The fact that the QTL was detected in
this study for germination at the optimum temperature could be due to the low temperature during imbibition. Since this locus not only influences germination but also root structure, it is likely that it is a key locus for both seed vigour and early root morphology.
Conclusion
The population we examined in this study segregates for a large number of independent QTL controlling the vigour of both the root and the shoot traits at low temperature. The overall organisation of the root system and the major QTL detected proved to be stable across environments, as shown by a comparison of our results with those found in earlier studies in hydroponics. ΦPSII and SPAD were
identified as promising traits for the indirect selection of genotypes with improved plant DW at low temperatures and were also associated with an increase in the root diameters but not with root length. The length of the primary lateral roots was positively associated with germination speed, indicating a genetic relationship between seed vigour and the morphology of the embryonic root system.
Acknowledgements The authors wish to thank Anna and Lilly Stamp for their help in root imaging; Paolo Losio and Lorenz Dürr for their assistance with theROOT DETECTORsoftware. The study was funded by the Swiss Federal Office for Education and Science, International Research Programmes—COST 828.
References
Backhaus K, Erichson B, Plinke W, Weiber R (1994) Multivariate Analysemethoden. Eine anwendungsorientierte Einführung, 7 edn. Springer, Berlin Heidelberg New York
Beauchamp EG, Lathwell DJ (1966) Effect of root zone temperature on corn leaf morphology. Can J Plant Sci 46:593–601 Beavis WD (1998) QTL analyses: power, precision, and accuracy.
In: Paterson AH (ed) Molecular dissection of complex traits. CRC Press, New York, pp 145–162
Blacklow WM (1972) Influence of temperature on germination and elongation of the radicle and shoot of corn (Zea mays L.). Crop Sci 12:647–650
Bowen GD (1991) Soil temperature, root growth, and plant function. In: Waisel Y, Eshel A, Kafkafi U (eds) Plant roots—the hidden half. Marcel Dekker, New York, pp 309–330
Brouwer R (1967) Beziehung zwischen Spross und Wurzelwach-stum. Angew Bot 41:244–254
Cahn MD, Zobel RW, Bouldin DR (1989) Relationship between root elongation rate and diameter and duration of growth of lateral roots of maize. Plant Soil 119:271–279
Cutforth HW, Shaykewich CF, Cho CM (1986) Effect of soil water and temperature on corn (Zea Mays L.) root growth during emergence. Can J Soil Sci 66:51–58
Engels C (1994) Nutrient acquisition by plants and its limitations by low temperatures in maize. In: Dörffling K, Brettschneider B, Tantau H, Pithan K (eds) Crop adaptation to cool climates. COST 814 workshop. ECSP-EEC-EAEC, Brussels, pp 503– 510
Engels C, Marschner H (1990) Effect of sub-optimal root zone temperatures at varied nutrient supply and shoot meristem temperature on growth and nutrient concentrations in maize seedlings (Zea mays L.). Plant Soil 126:215–225
Feix G, Hochholdinger F, Park WJ (2000) Maize root system and genetic analysis of its formation. In: Waisel Y, Eshel A, Kafkafi U (eds) Plant roots: the hidden half. Marcel Dekker, New York, pp 205–220
Fracheboud Y, Ribaut J-M, Vargas M, Messmer R, Stamp P (2002) Identification of quantitative trait loci for cold-tolerance of photosynthesis in maize (Zea mays L.). J Exp Bot 53:1967– 1977
Fryer MJ, Andrews JR, Oxborough K, Blower DA, Baker NR (1998) Relationship between CO2assimilation, photosynthetic
electron transport, and active O2metabolism in leaves of maize
in the field during periods of low temperature. Plant Physiol 116:571–580
Guingo A, Hébert Y, Charcosset A (1998) Genetic analysis of root traits in maize. Agronomie 18:225–235
Haldimann P, Fracheboud Y, Stamp P (1996) Photosynthetic performance and resistance to photoinhibition of Zea mays L. leaves grown at sub-optimal temperature. Plant Cell Environ 19:85–92
Haley CS, Knott SA (1992) A simple regression method for mapping quantitative trait loci in line crosses using flanking markers. Heredity 69:315–324
Hodges DM, Andrews CJ, Johnson DA, Hamilton RI (1997) Sensitivity of maize hybrids to chilling and their combining abilities at two developmental stages. Crop Sci 37:850–856 Hund A (2003) Genetic analysis of the response of maize (Zea mays
L.) seedlings to long-term mild chilling stress: a morpho-physiological approach. PhD thesis, ETH no. 15181, Zurich, Switzerland
Ihaka R, Gentleman R (1996)R: a language for data analysis and graphics. J Comput Graph Stat 5:299–314
Jansen RC, Stam P (1994) High resolution of quantitative traits into multiple loci via interval mapping. Genetics 136:1447–1455 Jansen RC, Van Ooijen JW, Stam P, Lister C, Dean C (1995)
Genotype by environment interaction in genetic mapping for multiple quantitative trait loci. Theor Appl Genet 91:33–37 Jiang C, Zeng ZB (1995) Multiple trait analysis of genetic mapping
for quantitative trait loci. Genetics 140:111–127
Landi P, Giuliani MM, Darrah LL, Tuberosa R, Conti S, Sanguineti MC (2001) Variability for root and shoot traits in a maize population grown in hydroponics and in the field and their relationships with vertical root pulling resistance. Maydica 46:177–182
Landi P, Sanguineti MC, Darrah LL, Giuliani MM, Salvi S, Conti S, Tuberosa R (2002) Detection of QTLs for vertical root pulling resistance in maize and overlap with QTLs for root traits in hydroponics and for grain yield under different water regimes. Maydica 47:233–243
Lebreton C, Lazic Jancic V, Steed A, Pekic S, Quarrie SA (1995) Identification of QTL for drought responses in maize and their use in testing causal relationships between traits. J Exp Bot 46:853–865
Leipner J, Fracheboud Y, Stamp P (1999) Effect of growing season on the photosynthetic apparatus and leaf antioxidative defenses in two maize genotypes of different chilling tolerance. Environ Exp Bot 42:129–139
Miedema P (1982) The effects of low temperature on Zea mays. Adv Agron 35:93–128
Mock JJ, Eberhart SA (1972) Cold tolerance in adapted maize populations. Crop Sci 12:466–469
Mock JJ, McNeil MJ (1979) Cold tolerance of maize inbred lines adapted to various latitudes in North America. Crop Sci 19:239–242
Openshaw S, Frascaroli E (1997) QTL detection and marker-assisted selection for complex traits in maize. In: ASTA (ed) Proc 52nd Annu Corn Sorghum Res Conf. ASTA (American Seed Trade Association), Washington D.C., pp 44–53 Perry DA (1987) Handbook of vigor test methods. International
Seed Testing Association, Zurich
Revilla P, Butron A, Malvar RA, Ordas A (1999) Relationships among kernel weight, early vigor, and growth in maize. Crop Sci 39:654–658
Revilla P, Malvar RA, Cartea ME, Butron A, Ordas A (2000) Inheritance of cold tolerance of emergence and during early season growth in maize. Crop Sci 40:1579–1585
Richner W, Soldati A, Stamp P (1996) Shoot-to-root relations in field-grown maize seedlings. Agron J 88:56–61
Richner W, Kiel C, Stamp P (1997) Is seedling root morphology predictive of seasonal accumulation of shoot dry matter in maize? Crop Sci 37:1237–1241
Ritchie SW, Hanway JJ (1984) How a corn plant develops. Special Report No. 48. Cooperative Extension Service, Ames, Iowa. http://maize.agron.iastate.edu/corngrows.html
Sanguineti MC, Giuliani MM, Govi G, Tuberosa R, Landi P (1998) Root and shoot traits of maize inbred lines grown in the field and in hydroponic culture and their relationship with root lodging. Maydica 43:211–216
Smith SD, Millet AH (1964) Germination and sprouting responses of the tomato at low temperatures. Proc Am Soc Hortic Sci 84:480–484
Stamp P (1979) Spross- und Wurzelmerkmale junger Maispflanzen verschiedener Konform in Abhängigkeit von der Temperatur. J Agron Crop Sci 148:99–108
Stamp P (1984) Chilling tolerance of young plants demonstrated on the example of maize (Zea mays L.). Adv Agron Crop Sci, vol 7
Stirling CM, Nie GY, Aguilera C, Nugawela A, Long SP, Baker NR (1991) Photosynthetic productivity of an immature maize crop: changes in quantum yield of CO2 assimilation, conversion
efficiency and thylakoid proteins. Plant Cell Environ 14:3905– 3914
Stone PJ, Sorensen IB, Jamieson PD (1999) Effect of soil temperature on phenology, canopy development, biomass and yield of maize in a cool-temperature climate. Field Crops Res 63:169–178
Tuberosa R, Salvi S, Sanguineti MC, Landi P, Maccaferri M, Conti S (2002a) Mapping QTLs regulating morpho-physiological traits and yield: case studies, shortcomings and perspectives in drought-stressed maize. Ann Bot 89:941–963
Tuberosa R, Sanguineti MC, Landi P, Giuliani MM, Salvi S, Conti S (2002b) Identification of QTLs for root characteristics in maize grown in hydroponics and analysis of their overlap with QTLs for grain yield in the field at two water regimes. Plant Mol Biol 48:697–712
Utz HF, Melchinger AE, Schön CC (2000) Bias and sampling error of the estimated proportion of genotypic variance explained by quantitative trait loci determined from experimental data in maize using cross validation and validation with independent samples. Genetics 154:1839–1849
Walter S, Bürgi H (1996) Report on the project ROOT DETECTOR: computer aided evaluation of scanned images of roots. ETH, Institute of Plant Sciences, Zurich, Switzerland
Zeng ZB (1994) Precision mapping of quantitative trait loci. Genetics 136:1457–1468