\\ST.
OF
TECHNR
JUL 6 1965
LI8RA R1~I THE DYNAMICS OF THE WORLD COCOA MARKETby
FRANK HEI4UT WEYMAR
S.B., Massachusetts Institute of Technology
(1958)
SUBMITTED IN PARTIAL FULFILLMENT OF THE REQUIREMENTS FOR THE
DEGREE OF DOCTOR OF PHILOSOPHY at the MASSACHUSETTS INSTITUTE OF TECHNOLOGY February, 1965 zl A/ 7 A Signature of Author . . .
Department of Economics, Sept er 20, 1964
Certified by ...
Thesis Supervisor
Accepted by ... ... ...
38
ERRATAPage,
Line
1v 11 124
from bottom 28 97 117 120 321 156 162 175 Error ... I was writing .* a confectionery manufacturer ... ... contact with ... ... Dr. Tosta Filho ..... Brennan's article (2a) .. .. (F0 .. F)/h, (PF - P)/h,
... is exhibited in the curve for futures
speculation, it reflects saturation in
0.. for manufacturer ... - 0.008700 a ... .. -t 3.768
(May) coefficient on the September ratio,
and the final (August) coefficient on the to be constant, ...
In ( f) *
t
The cocoa quantities in Table A-1, as well as in all of the remaining tables in this appendix,
are in thousands of long tons.
Second C column is estimated consumption, C
., through April of ...
. simulations ..
.. (ct+L - c )
... exists no real world counterpart ...
8
footnote 2 3 last line 13 equation A-i equation A-33 12 4 from bottom equation 20 new footnote Table 8 from bottom 3 from bottom vertical axis label 6 from bottom 2762957
346
371Abstract
The Dynamics of the World Cocoa Market
by-Frank Helmut Weymar
Submitted to the Department of Economics on September 23, 1964, in partial fulfillment of the requirements for the degree of Doctor of Philosophy.
The thesis concentrates on that portion of the world cocoa
industry's system structure which determines the dynamic res-ponses of cocoa prices and consumption to changes in cocoa pro-duction. In order to set the context for the subsequent sta-tistical research, a play-by-play account of cocoa market events over the 1952-63 interval is given, in the form of monthly ex-cerpts from various market reports and letters.
In order to study cocoa price-consumption dynamics it is necessary to obtain an estimate of the system structure which determines the values of these variables over relatively short time intervals (e.g. one month). The existing economic
litera-ture does not treat short term commodity price mechanisms in a manner directly useful for empirical study. In order to
satisfy this need, the modern literature on commodity price theory is reviewed and extended, providing a general theoretical price equation format subject to empirical testing.
A model of the system structure of interest is obtained in the form of ordinary and generalized least squares estimates of the equations generating: (a) the monthly average cocoa spot price; (b) quarterly world consumption; and (c) monthly forecasts of calendar year world consumption. In the process of obtaining these estimates the thesis presents the collected and in part constructed monthly data over the 1952-1963 interval for the following variables: world cocoa consumption, cocoa sales by the producing nations, world crop forecasts, and world consumption forecasts.
As a further check beyond conventional hypothesis testing
procedures, the response of the estimated price-consumption sub-system to variations in crop expectations and producer sales is simulated. The amplitudes and phase relations of the simulated variables are compared with the corresponding dynamic
charac-teristics of the actual subsystem's behavior. In addition, the simulated and actual crosscorrelation functions between
iii
Acknowledgments
Most of the empirical literature on commodity prices
attempts to explain price movements in terms of variations in various supply and demand variables, without any explicit consideration of the general theory of commodity prices. To
the extent that my thesis escapes this indictment, it reflects the friendly and persuasive cajoling of Professor Paul Cootner. Moreover, his research in supply of storage theory provides much of the basis of the theoretical discussion included in the thesis. Both personally and professionally I am very much in debt to Professor Cootner.
The entire faculty committee on my thesis, which besides Professor Cootner included Professors Franklin Fisher, Charles Kindleberger, and Paul Samuelson, was quite generous with its
time and advice. Despite the fact that he was in the throes of bringing his already noted cable television study to a
close, Professor Fisher offered detailed comments on the eco-nometric aspects of the thesis. Professor Kindleberger went so far in his generosity as to send back comments on part of the draft while vacationing in France. I am in debt to Professor Samuelson not only for his suggestions during the writing of the thesis, but also for his fundamental article on intertemporal commodity price relationships, which article pointed the direc-tion for the theoretical discussion in the thesis. I acknowledge the aid and advice given by each of the committee members,
without wanting to saddle them with any responsibility for such errors as may remain.
The thesis emphasis on studying the dynamic character-istics of the cocoa industry system derives from systems con-cepts with which I became familiar while a member of Professor Jay Forrester's Industrial Dynamics Research Group. The
continuing interest in commodity economics on the part of one of my associates in that group, Professor Willard Fey, had much to do with my own commitment to research in depth in the
commodity area.
During the period when I war writing the thesis I was an employee of the James 0. Welch Company, a confectionary manufacturer which is now a division of the National Biscuit Company. Well over half of my time during this period was spent on my thesis. While the thesis provides the basis for* applications of direct benefit to the campany, I owe a major debt of gratitude to Mr. James Welch and Mr. James Welch, Jr. for the risk which they took in initially underwriting my research, and for the friendship and encouragement which they have offered me since that time. My ties with the Welch Company in turn provided the basis for establishing close
contack with Mr. T. Patrick Aitken and Mr. John Byers of Gill and Duffus, Inc., and with Mr. Jerry Spielman of Bache and Company. These individuals and their firms have been most helpful in providing me with statistical information and
qualitative background knowledge for the tlsesds.
.The comprehensive services of the MIT Computation Center -
-key punching, program consulting, and run processing, with 24 hour access to the last of these.- - were indispensable in achieving the quantitative results presented in the thesis.
Finally, while I have always been convinced that I have been lucky in love, this conviction has grown all the more
during the writing of my thesis. Not only has my wife, Caroline, provided the inspiration and displayed the patience which every married thesis student knows to be necessary, she typed the entire draft and final copy of the thesis, while meeting her obligations as an Assistant Trust Officer in the New England Merchants National Bank.
Table of Contents
Abstract .. . . . ..
Acknowledgments ...
List of Figures ...
List of Tables ... ...
Chapter 1 -- Objectives and Context ... 1.0, Introduction
1.1 A Brief Description of the World Cocoa Economy
1.2 Objective and Outline
List of References
Chapter 2 -- The World Cocoa Market, 1953-1963
.--2.0 Introduction 2.1 1953-54 Bull Market 2.2 1954-57 Bear Market 2.3 1957-58 Bull Market 2.4 1958-62 Bear Market 2.5 1962-63 Price Recovery.
Appendix 2A -- Monthly History of the World Cocoa Market,
1953-1963
Chapter 3 -- Commcdity Price Theory
3.0 Introduction
3.1 The General Commodity Model
3.2 Supply of Storage Theory
3.3 The Spot Price Function List of References
Appendix 3A -- The FAO Cocoa Price Model
Chapter 4 -- The Cocoa Price Mechanism ... 4.0 Introduction
4.1 The Specific Equation Structure
4.1.1 Equilibrium Price Expectations
11 iii ix x 18 20 25 27 31 42 97 98 105 146 154 156 165 165 166 168
vii
4.1.2 Expected Price Change before the Horizon Time 169 4.1-3 Expected Price Change after the Horizon Time 179
4.1.4 The Complete Specified Structure 184 4.2 A Priori Parameter Plausibility Notions 185 4.2.1 Plausible Values for b and b 186
4.2.2 .Plausible Values for 2 188
4.2.3 Plausible Values for Y 189
4.3
Ordinary Least Squares Estimates 1904.4 Stability of the Estimated Structure 205
4.5
Generalized Least Squares Estimate 2124.6 Conclusions 217
List of References 220
Appendix 4A -- The Data for Chapter 4 221
1.0 Cocoa Prices 221
2.0 Current Inventory Ratio 222
2.1 Monthly World Grind 223
2.2 Monthly Producer Sales 229
2.3 Current Inventory 232
3.0 Expected Inventory Ratio 233
3.1 Expected World Grind 234
3.2 Expected Producer Sales 239
3-3 Expected Inventories 241
4.0 Some Comments Regarding the Data 243
List of Data Sources 247
Appendix 4B -- Regression Results for Seasonal Inventory
Behavior 248
Chapter 5 -- World Cocoa Consumption and Consumption Expectations.. 252
5.0 Introduction 252
5.1 World Cocoa Consumption 252
5.1.1 Indirect Estimation Approach 253
5-1.2 Initial Statistical Results 260
5-1-3 Direct Estimation Approach
66
5.1.4 Regression Results Using the Direct Approach 269
5.2 Consumption Expectations 277
5.2.1 Model for Fraction Change Estimates 279
5.2.2 The Data 285
5.2-3 Regression Results 289
List of References 296
Appendix 5A -- Additional Data 297
1.0 Introduction 297
2.0 Populations 297
3.0 National Income Indicators 299
3.1 National Consumption Expenditures 300
3.2 Exchange Rates 305
3-3 Aggregate Consumption Expenditures 305 4.0 Major Nations' Foreign Trade in Cocoa Products 308
viii
6.0 Comments on the Data 313
List of Data Sources 316
Appendix 5B -- The Relationship between the Equations for
Quarterly and Monthly Consumption 317 Appendix 5C -- Indirect Estimation Regression Results 319
Chapter 6 -- Dynamic Characteristics of the Price-Consumption
Subsystem ... 322
6.0 Introduction 322
6.1 The Estimated Subsystem 328
6.1.1 Price Equation 329
6.1.2 Consumption Equation 331
6.1.3 Consumption Expectations Equations 331
6.2 Response of the Estimated Subsystem to the Actual
Exogenous Series 335
6.2.1 Exogenous Inputs 335
6.2.2 Initial Conditions 336
6.2.3 The Simulations 339
6.2.4 The Sales-Consumption Cross-Covariance Function 346
6.3 Natural Dynamic Characteristics of the Subsystem 349
6-3.1 Steady State Exogenous Inputs 349
6.3.2 Steady State Initial Conditions 351
6.3.3 Gain Curve and Linearity 352
6-3.4 Short Term Noise Response 355
6.3-5 Crop Failure Response 359
6-3.6 Crop Noise Response 361
6.4 Conclusions and Qualifications 363
List of References 365
Chapter 7 -- Summary and Conclusions ... ... 366
7.0 Introduction 366
7.1 Summary 366
7.2 Conclusions 369
7.2.1 Commodity Price Theory 369
7.2.2 Cocoa Price-Consumption Dynamics 376
378 Biographical Note ..-...
List of Figures
1-1 Flow Graph of Cocoa Industry Structure 2
1-2 Past Behavior of Several Cocoa Industry Variables. 3
2-1 Monthly Values of Various Cocoa Industry Variables 21
2-2 Seasonally Adjusted Monthly. World Grind 21
2-3 Brazilian Sales Patterns, 1955-56 and 1956-57 29
2-4 Ghanaian Main Crop Purchase Patterns 35
2-5 Average Ghanaian Main Crop Purchase Patterns 3T
2-6 Pertinent Variables, 1958-59 Season 39
2-7 Pertinent Variables, 1961-62 Season
41
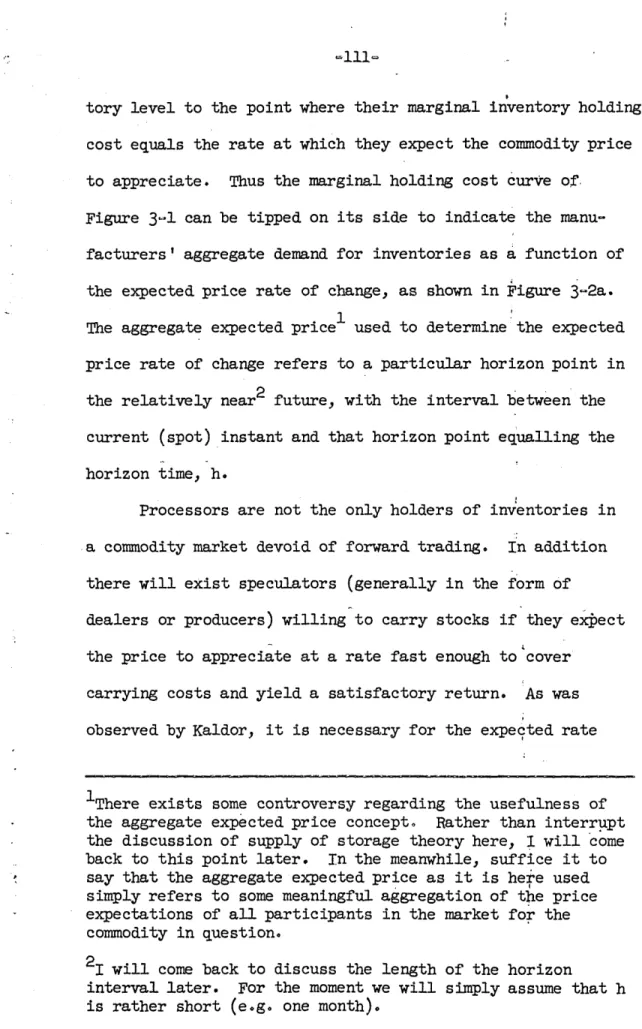
3-1 Marginal Inventory Holding Cost vs. Manufacturer Inventories 110
3-2 Derivation of Supply of Storage Curve, No Futures 112
3-3 Derivation of Supply of Storage Curve, With Futures 118
3-4 Actuals Market and Futures Market Supply of Storage Functions 125
3-5 Futures Market Equilibrium 127
3-6 Theoretical Example of Forward Price Determination 134
3-7 Cocoa Futures Prices, November-December, 1959 136
4-1 Cocoa Short Term Supply of Storage Curve 172
4-2 April Expectations for Inventory Ratio Behavior 177
4-3 Effect of g on Expected Inventory Ratio Behavior 182
4-4a Actual Price vs. Initial Estimate, and Current and
Expected Inventory Ratios 192
4-4b Final Regression Results 192
4-5. Price Trend Multiplier Curve Shapes 198
4-6 -Regression and Smoothed Weighting Functions on Price Trend 201 A-1 Example of Procedure for Constructing Monthly World Grind 226
A-2 Weighting Function 238
5-1 Plausible Price Lag Distribution Shapes 258
5-2 Estimated vs. Actual Consumption 274
5-3 Seasonal Behavior of Consumption Forecast Parameters 286
6-l The Price-Consumption Subsystem 323
6-2 Weighting Function 332
6-3 Simulated Response to Actual Input Data 340
6-5 Gain Curve 356
6-6 Simulated Responses to Test Inputs 357
7-1 Short Term Static Equilibrium 370
List of Tables
2-1 Average Ghanaian Main Crop Purchase Percentages 38
4-1 Coefficients for April Inventory Ratio Expectations 176
4-2 Monthly Coefficients for Inventory Ratio Expectations 178 4-3 Approximate Parameter Plausibility Limits 189
4-4 Regression and Smoothed Parameter Estimates 200
4-5 Subinterval and Total Interval Parameter Estimates 210
4-6 Correlation Coefficients, Independent Variables 211
A-l National Grinds and Estimated World Grind 224
A-2 Example of Procedure for Constructing Monthly World Grind 225
A-3 Monthly World Grind 230
A-4 Sales Data 231
A-5 World Grind Forecasts 235
A-6 World Crop Forecasts 240
B-1 Regression Results for Seasonal Inventory Behavior 249
5-1 Coefficients of Determination 261
5-2 Lag Coefficients 261
5-3 Serial Correlation Coefficients among Lagged Prices 261
5-4 Monthly Seasonal Consumption Constants 273
5-5 Actual vs. Estimated Annual World Consumption 276
5-6 Arrangement of Observations for Regression - 288
5-7 Initial Parameter Estimates 290
5-8 Regression Estimates and Smoothed Estimates of
Consumption Forecast Parameters 292
A-1 Populations 298
A-2 Quarterly Consumption Expenditures, Local Currencies 301
A-3 Exchange Rates 306
A-4 Quarterly Dollar Consumption Expenditures 307 A-5 Cocoa Bean Equivalents of Aggregate Major Nations'
Product Imports 310
A-6 Sugar Prices 312
C-1 Indirect Estimation Results for Various Average Lags 320
C-2 Regression Results Including Sugar Prices, Time, and Income 321
Chapter 1
Objectives and Context
1.0 Introduction
My objective in this paper is to describe and explain the rnature of the dynamic response of the world cocca in-dustry to annual fluctuations in world cocoa production. Before elaborating on this objective, I shall briefly sketch the cocoa industry structure, in order to provide a general context for the remainder of the thesis. Then, after more fully defining the thesis objective, I shall lay out the pLan of attack to be used in the chapters which follow.
1.1 A Brief Description of the World Cocoa Econom The discussion which follows regarding the nature and history of the world cocoa economy is in part factual
(i.e. based on well documented information), and in part
theoretical (i.e. based on what seem to me to be reasonable assumptions). What is fact and what is assumption will be made clear in the more detailed discussions in succeeding
chapters,
Figure 1-1 shows a flow graph indicating the way in which the more important industry variables are related to one another. In the paragraphs which follow I shall describe these relationships. Figure 1-2 shows the history of several
-
z-rcG4, vlOo T-AL NtkCrv-OP/ ~V- rL
-
cocoA
-
O
k~
0k-< R 'b c VA \%Iatl(.IAAIENNIV
L* ~ -VPAV~t>1% 1%WUr' m, .ON 'Oktb\Y--t\OtA
Iq2Ait931?1041
(yta DN.. -P- oARm
c~
3 Otk 4 )C%-.A~,DTv-)-tl 0 '-I 7
z.
'7 -I 0z
4' (000 0'1rVT
trJ 0Zc
1i7f1
Loll V xv otx:t- I
IOMI
-4-Cocoa beans are harvested from cocoa trees, with most (over
90
percent) of today's production coming from the equa-torial regions of Africa and Latin America. Ghana alone accounted for about 37 percent of the 1962-63 crop, while the five leading producers (Ghana, Nigeria, Brazil, Ivory Coast, and Cameroon) together produced about 76 percentof the crop. The planting of new cocoa trees has been found to be influenced by the real price received by cocoa pro-ducers, and by special government incentives aimed at encouraging planting. In addition the real price of
competitive crops (e.g. coffee, or annual crops) likely plays a role here, as do the real costs of planting new
cocoa farms. An acre of newly planted cocoa trees yields little or no cocoa before its fifth year, and then generates a sharp increase in yield until roughly its fifteenth year.
At this point the continued increase in the yield of healthy trees begins to be off-set by the incidence of disease
in some of the less vigorous trees.- Yield per acre con-tinues to increase slowly until roughly the twentieth year,
and then levels off and begins a long decline. The time at which maintenance and harvesting is no longer profitable at normal prices varies between the thirtieth and fiftieth year after planting.
'5-While cocoatrees are afflicted by many types of
disease, the worst of these historically have been "witches
broom" (in the West Indies) and "swollen shoot" (in Africa, and particularly in Ghana). These diseases are both viruses,
for which,,noocure eis currently known. In the case of' swollen shoot, the virus is carried from tree to tree by
insects with the result that the disease can easily spread from a small pocket of diseased trees to an increasingly
large area. The only way of preventing such spreading
is to cut out and burn diseased trees as soon as the infec-tion is observed. The main sympton of swollen shoot is
a decline in yield over a period of from two to ten years until the infected trees yield little or no cocoa.
The yield of an average cocoa tree for any given season can vary significantly depending on weather' and the amount of attention paid by the cocoa farmer. The farmer can increase yield in the short run by weeding -and spraying
more often and more thoroughly. Spraying can substantially
eliminate the two main natural hazards to cocoa bean pods, capsid flies and black pod disease. Various writers claim
that the short term crop care efforts of cocoa farmers
are quite sensitive to producer price variations, but to my knowledge no thorough study has been made on this point.
The plateau in world cocoa production (see Figure 1-2) which took place from 1938 through 1957 has to some degree
-6-been attributed to the increase of swollen shoot disease, especially in Ghana (formerly the Gold Coast). During the early and middle 1950's the governments of both Ghana and Nigeria undertook major programs aimed at arresting the spread of swollen shoot. These efforts involved not only
the cutting out of a substantial number of infected trees, but also the planting of new trees of the high-yield
varieties developed since the war. In addition, the Ghanaian and Nigerian governments offered direct subsidies to farmers
along with educational programs in order to increase the use of sprays combatting capsid flies and black pod disease. These various governmental efforts, aided and perhaps in part caused by the high prices during the late 1940's and early .1950's, are generally credited for the rapid increase
in cocoa production over the 1958-1961 interval. The pro-grams were financed by the marketing boards in the two countries, which in turn derived (and still derive) their revenues by paying the cocoa farmers (who by law must sell
to the boards) less than the farm equivalent of open market prices. To some degree the marketing boards have stabilized
farmer prices, in that they have tended to keep a substan-tially higher portion of the world price during intervals
of high prices than during intervals of low prices, and at
times of rapid price decline have sometimes paid the farmers more than the farm equivalent of the world price.
-7-As the cocoa is harvested (from October through
February in the key African nations) it is generally sold and
exported fairly rapidly (some forward sales take place) to
the major northern hemisphere consuming areas (E.E.C., U.K.,
and U*s.), since cocoa beans tend to deteriorate if stored
for long periods in producing regions. Early harvesting
figures (or more accurately, early purchasing figures
on the part of the marketing boards) form the primary basis
for initial estimates of the entire crop. In addition,
reports regarding weather and disease conditions coupled with a minor amount of statistical sampling are used for crop forecasting purposes. Such forecasts are issued by private sources (primarily Gill and Duffus Ltd., an inter-national cocoa dealer) along with the Food and Agricultural Organization of the United Nations.
The same sources generally begin to issue world con-sumption forecasts for the coming calendar year sometime during the fourth quarter. These forecasts are based on
past consumption trends, and judgements about the influences
of exogenous factors and recent prices on future consumption. The evolving crop and consumption forecasts, and estimates of current and future world cocoa inventories all go together
to provide the primary basis for changes in the world price
of cocoa. If current stocks plus expected bean production are small relative to expected bean grindings, then the bean
price will tend to be high relative to "normal" price ex-pectations, and vice-versa. Normal price expectations reflect aggregate notions regarding the markets long term
equilibrium price level (i.e. the price level at which the long term growth rate in production equals the long term growth rate in consumption), and are based primarily on past price behavior. In the short run cocoa prices are also influenced by technical factors relating to specu-lative activity in the London and New York cocoa futures markets.
In commercial use cocoa beans are first cleaned, roasted, and shelled, and then ground into a liquid mass called chocolate liquor. The liquor is then either used directly in the manufacture of chocolate confectionaries and biscuits, or pressed to yield two separate products, cocoa powder and cocoa butter. Cocoa butter is combined with chocolate liquor in the manufacture of the lighter (milk) varieties of chocolate. Cocoa powder is used in
producing cocoa drinks. In recent years powder has been a surplus product, and at times has been discarded as waste.
Total cocoa grindings can be broken into two cate-gories, grindings for chocolate liquor to be used directly in making chocolate, and grindings for cocoa products (butter and powder) to be used (or sold) separately. This
-19-is a d-19-istinction in intent only. Both types of grinding may go on in the same plant, particularly in the case of those chocolate manufacturers who grind for their own liquor and butter needs, and sell or discard the excess powder.
The decision to grind for chocolate liquor is based
directly on the decision to produce chocolate, which in
turn closely reflects recent sales of chocolate, since
finished chocolate inventories are generally held at low levels and do not fluctuate widely. Thus the chocolate manufacturing rate is determined by the price of chocolate and other demand influencing variables (population, incomes,
tastes, competitive prices, etc.). The price of chocolate, in turn, is determined by ingredient costs (i.e. primarily the prices of cocoa beans, cocoa butter, sugar, and milk powder), along with grinding and manufacturing costs.
The decision to grind for cocoa products is deter,-mined primarily by the profitability of such grinding, namely the grinding margin (the value of the products minus the cost of the beans) minus grinding costs. The prices of powder and butter reflect the inventory levels for these products relative to their respective usage rates. If either product inventory level is low relative
to usage, the corresponding product price will tend to rise, and vice-versa. In the case of butter, the usage
manu-facturing rate. Powder, however, is consumed as a separate product, so that its usage rate is determined directly by its price along with other demand influencing factors
(population, etc.).
As is indicated in Figure 1-l, this rather complicated decision mechanism for the cocoa grinding (consumption) rate can be treated, at least conceptually, as a straight-forward demand mechanism, with cocoa consumption deter-mined by lagged cocoa prices and various exogenous influ-ences (e.g. populations, national incomes, etc.). This is based on the fact that the prices of the three cocoa products - liquor, butter, and powder - all reflect the price of cocoa beans, so that in the final analysis it is the bean price which determines product (and therefore bean)
consumption. The lag in the price effect on consumption
reflects a lag in the response of product prices to changes
in bean prices, coupled with a lag in the adjustment of product usage to changes in product prices.
So much for the general structure of the cocoa economy. We move now to a discussion of the specific objective of
the thesis.
1.2 Objective and Outline
Cocoa price movements can usefully be separated into three categories: long term, intermediate term, and short
-10-term. Each of the three classes of price fluctuations
can be identified with its own causal mechanism.
Long ,termcocoa price fluctuations are generated by the feedback loop linking cocoa prices with the rate of new planting,:planting with production production with
inventories and, finally closing the loop, inventories
with prices. The.,dynamics generated by this loop follow conventional cobweb lines: (1) a period of low prices,
such as the 1930.'s and early 1940's, causes a decline in new planting; e (2) after the substantial delay required to. clear the pipeline of maturing trees, production be-gins ,to level off, and perhaps decline (e.g. the production plateau lasting from 1939 to 1955); (3) with normal growth,
consumption begins to outpace production, causing inven-tories to fallI; (4) cocoa prices climb (e.g. the late
'40Q's and most of the '50's), bringing a revival in new planting, and starting the second half of the cobweb
cycle. The length of the period between successive peaks and troughs in these long term fluctuations is in large measure determined by the average length of the delay between the time of planting and the time of peak
produc-tion of a cocoa tree.
At the opposite extreme, short term month-to-month price fluctuations in part reflect alternating tides of bullish and bearish speculative enthusiasm in the world's
cocoa markets. The speculative element in themarket utends
to focus its attention. for prolonged intervals orone or two background developments which may have
an
important effect on future cocoa prices. Trends in the influence of natural hazards on production, or the recent increaseddesire on the part of the cocoa producing nations for'a
production and/or marketing control agreement provide examples of such background developments. Some particular event, such as an impending meeting among the 'cocoa
pro-ducers, will be judged by the hard core of the docoa trade
to have special potential (say) bullish significance. First a few members of the trade will act on this judge-ment by extending their cocoa positions. The resulting price firmness tends to lend credence to the original judgement, and soon all of the cocoa market media begin to enthuse over the bullish implications of the event under focus. Eventually anyone who is willing to buy cocoa
given the most optimistic general interpretation of the situation has already bought, and the event becomes "fully discounted". The whole process up to this point may take anywhere from a day or two to a month.
As the developments in question unfold, they are likely to fall short of the extreme bullish potential which could be visualized ex ante. The early birds take their profits, and the price begins to fall. With events having
fallen short of hopes, disillusion sets in. The skeptics of 2theoriinal bullish ratiorale ilen or a eas
unheard duringIthe-priced climbno pres t
cases as. the market heads toward the" opiosite extreme .
In-betweerfithe long and short modes 6 behavior" lie the intermediate-tierm movemenrits in ocoa s.rie s '
sumption -and1 inventories These fluctuations, which
will provide the subject off the thesis, represent the
response off the cocoa indu stry system to annual variations in world cocoasproduction Recent examples are provided by the"1953-54tprice rise the-sbsequent decline into
195T, the doubling in the price level culminating-in
1958, and the long decline into 1962.
The nature (or more properly a hypothesis regarding the nature) offthe subsystem off feedback loops which
gene-rates -the intermediate'term behavior of the cocoa economy, and which will becalled the price-consumption subsystem is indicated-in Figure l-l. In response to (say) a weather causedy crop shortage, inventories and expectations regarding future inventories both fall causing the price to rise. After adjustment lags, consumption and consumption ex
ecta-tions decline toward a level more in line with'the short crop, but not before inventories have been further depleted, and-the price-forced still higher. With the continued
rate, and the inventory decline is reversed. The price now begins to fall, but the consumption rate does not end its
decline until after an adjustment lag. By this time the
inventory level is well up from its trough and increasing
further, causing a continued price decline. Consumption finally begins to climb in response to the lower prices as the second half of the cycle begins.
The degree to which such intermediate, term fluctuations are damped is in large measure determined by the nature of the
industry's consumption forecasting procedure* If consump-tion forecasts covering the next 12 months or so accurately reflect the effect of known past prices on future
consump-tion and effectively gauge future price-consumption
inter-actions, then the price overshoot (or undershoot) resulting from an exogenously caused crop variation will be curtailed, and the system's response will be highly damped. If, on the
other hand, consumption forecasts are based on past consump-tion,.*hieh in turn is partially determined by past prices, then the total lags around the relevant feedback loops1 will be long enough to give rise to noticeable intermediate term
fluctuations.
lIn figure 1-1, the (price past prices - consumption - past
consumption - consumption expectations - price) and (price
-past prices - consumption - past consumption - consumption expectations - inventory expectations - price) feedback loops.
In terms of the above framework, my objective in this
paper" has two parts: (a) to determine the quantitaiive nature of the mabsystei of equations which generates inter-mediate tekm fluctuations in the world price,' consuiption rate, and inventory level of codoa in response to'-exbogenous changes lin produicer sales of cocoa, and in word production forecasts;and (b) to study the dynamic cha acteristics of
that subsystem.
In obtaining estimates of the individual equations I shall use data covering the l year intervalfrom September,
1952, through'August, 1963, that being the interval for which
the'full set-of necessary data exists or- is amenable to reasonably reliable construction To provide an historical context for the statistical estimates, Chapter 2 consists of a review of the more important events which took place
in the cocoa market during the data period, with an emphasis on the way in which these events influenced cocoa prices.
Given the desire to study the dynamic characteristics of the price-consumption subsystem, it will be necessary to
estimate the individual equations in such a way that these
equations explain their respective dependent variables on a monthly basis. This requirement arises from the fact that
a month is the largest practical (in terms of available data) time interval which is still small enough to allow the esti-mated difference equations to generate behavior closely
approximating the actual continuous cocoa system. The use
of a..monthly time interval gives rise -to problems in
esti-mating the price equation, since there exists no adequate theory for explaining monthly commodity price behavior., In Chapter 3 I develop such a theory after reviewing the general
commodity price literature. Chapter 4 describes the
statis-tical estimation procedure for the price equation.
Chapter 5 concludes the statistical research in the thesis with estimates of the equations generating world
cocoa consumption and consumption expectations, thus completing the model of the price-consumption subsystem. In Chapter 6- shall first indicate the degree to which the estimated subsystem generates behavior similar to that observed over the data period when driven by the observed time series for producer sales and crop expectations. I
shall then analyze the characteristics of the dynamic behavior generated by the estimated subsystem. Chapter 7
-lT-List of References
1) F.A.O. Cocoa Study Group, The Cocoa Situation: Recent
De-velopments and the Outlook for Production and Demand,
Rome, 1961.
2) Galletti, R., Baldwin, K., Dina, I., Nieriani Cocoa Farmers, Oxford U. Press, London, 1956.
3) Gill and Duffus Ltd., Cocoa Statistics, .(annual), London.
4) , Cocoa Market Reports, (monthly), London.
5) Hill, Polly, The Gold Coast Cocoa Farmer, Oxford U. Press,
London, 1956.
6) O.E.E.C., The Main Products of the Overseas Teiritories: C~oa, Paris, 1956.
7) Viton, A., Cacao: A Review of Current Trends in Production, Price, and Consumption F.A.O. Bulletin No. 27) Rome,
1955-8) Wickizer, V., Coffee, Tea, and Cocoa: An Economic and
Chapter 2
The World Cocoa Market, 1953 - 1963
2.0 Introduction
My objective in this chapter is to review the history of the world cocoa market over the period from 1953 through
1963. The emphasis will be on explaining the major price movements during this period in terms of their apparent
immediate causes.
One important source of information for the history has been the series
of
market reports generally issued monthly during the period under study by Gill and Duffus, Ltd., a London and New York cocoa dealer. These-reports have provided and still provide the most important source of cocoa market news and statistics available to the trade. In addition, cocoa market letters issued by Frank Sweeney Co. (formerly Emil Pick Co.), a New York cocoa broker, and Bache and Co., a commission house, were also used as refer-ences. The appendix to this chapter consistsof a monthly review of the comments made in these three sources from 1953 through 1963, with the primary reference being the Gill andDuffus reports for the months in which they were issued. The comments included in the appendix include not only des-criptions of important cocoa market events, but also market opinions where these were clearly stated. Thus a careful
reading of the appendix should provide an indication of the changing tone of the market opinions-of at least part of the
trade during the period of interest.
Figure 2-1 shows various monthly time series which wil
be refeVred to frequently in the remainder of the chapter:
Soo rice -- The monthly average spot price of Accra cocoa beans in New York
2 Estimated World Production Sometime near the start of eac crop year (October 1) Gill and Ddffus usually begins to issue monthly forecasts of total world production for that year. This series consists of such forecasts in months when
they were made, starting in September of each year. For the
months during which Gill and Duffus did not issue new crop forecasts various substitute figures were used. The nature of such substitutes is explained in Chapter 4, which uses this series in a statistical analysis of price movements.
Estimated World Absorption Gill and Duffus also
issues monthly forecasts of world absorption (i.e. grindings) during each calendar year, usually but not always beginning sometime around January of that year. This series, beginning
n the September preceding each calendar year, is made up of either the Gill and Duffus forecasts when available, or else various substitute forecasts. Again the exact derivation of the absorption series is explained more fully in Chapter 4.
-20-4) Current Inventory Ratio This provides an indication of the current cocoa supply situation, and is equal to the cur-rent level of world cocoa inventories divided by total world grindings over the past 12 months. The details of the
deri-vation of this series are discussed in Chapter 4.
As is evident from Figure 2-1, cocoa prices experienced four broad moves during the period under study: an uptrend
from February, 1953, through July, 1954; a downtrend from July, 1954, through March, 1957; an uptrend from March, 1957o through July, 1958; and finally a downtrend from July, 1958, through the summer of 1962. The sections which follow review the market circumstances which prevailed during each of these
major trend periods, as well as during the 1962-63 price re-covery.
2.1 1953-54 Bull Market
This sharp, 18 month uptrend was unique among recent bull markets in cocoa in that it found its cause initially in a rapid shift in demand, rather than supply, conditions.
As we shall see in Chapter 5, world cocoa consumption under
normal circumstances changes only relatively slowly over time, in response to changes in price, incomes, and population. But in 1953, consumption in the United Kingdom, which during the previous year had accounted for almost 15 percent of
world net imports, increased sharply and unexpectedly in response to the lifting of wartime controls on confectionary
Ri 1 SAa 6. ... ... .... ...
2.0
...
aAW a . . . a . . . . . . . 'A'
*r
V..
x .\j>... .../
...T:o
act~r
SCRPLS
1100.
TOi
0,
mx
...
m
.4
No~~Wdto?
.Qt
0
.T
log
.q
o
:
.
.
.
.
.
..
.
.
.
.
...
...
...
...
...
...
...--..
.
.
.
.
.
.
.
.
.
....
.
..
.
.
.
.
.
.
.
.
.
.
.
.
.
.
.
....
.
..
....
....
...
..
...
...
.
..
...
.
...
....
..
....
....
..
..
_ ig*.. a a h:,90
0i
CROP 1JP4is IiF utr
1
TI
a a a * 00 .s -s a-..i4s - - sea4c.,atvi. 2a -- 952--a3a TaME
-U a~.... ... . . . .
o l.
(4
LPRIPE
4\0.o1
....
....
T
T.
I . .. .. . aa-a
S 5 a.:.. a -9- a .: a a a +
w
m
cz
Atb
MoAT"LN
(CoNS0TIO1
aS .C .t * a * ~ WI
6ETO
Am
SCAL
. . . .. . . I 12 AF
\e-u
e.
-- PM a
-22-consumption. The following excerpts taken from the appendix to this chapter show how the events unfolded through the eyes of Gill and Duffus:
Date Comment
1/5/53 It is estimated that a further small price increase would cause decontrolled U.K. confectionary
con-sumption to level off at the current rationed rate of six ounces per capita per week... It would be
odd indeed if the price were to go into a steep uptrend given that this year's production is almost 10 percent greater than last year's.
2/4/53 Within the past week there was an official
announce-ment that rationing and price control have been
ended in the U.K. for chocolate and sugar
confec-tionary... Cocoa prices and world consumption will probably be roughly equal to last year's levels. 3/4/53 With the lifting of controls in the U.K., there
is likely to be some, adjustment in the prices
of-particular kinds of confectionary, but any general
increase seems unlikely. The initial heavy demand has developed as expected, but there are no signs
of hoarding. Manufacturers generally are stepping up production to meet demand. It is too soon to gauge the level at which demand for sweets is like@N ly to settle, but as the rate of buying declines, competition is expected to revive in the trade. The overall increase in U.K. cocoa bean consumption as a result of decontrol will probably be about 5,000 tons (about five percent) or perhaps some-what more.
4/9/53
Present tentative estimates indicate that U.K. con-sumption may have increased by 8-10,000 tons per- annum (roughly 10 percent) due to decontrol.
5/4/53 Reports regarding U.K. confection demand vary,
with some saying that a new level of eight ounces per head per week has been reached and maintained, as opposed to six ounces before decontrol.
6/17/53 During the first four months of 1953, U.K. cocoa bean consumption was up over 10 percent... Some authorities feel that the new level of
confection-
-23-ary demand will'be nine ounces per head per week.
7/13/53 Inf oxmed estimates of free confectionary demand in
the U.K. now range from 6.1 to T.75 ounces per
head er weekvers 7.25 aouncesbefore'the wax, and six ounces under control.
8/5/53 The U.K. supply-demand situation appears to have become imore normal.
12/113 U cofactonary production hasreached a re' cord level of 10 ounces per head per week;
manu-facturer and:distributor stocks have now been rebuilt following the decline after derationing... U.K. consumption over January -October was over 16
percent ahead of last year.
2/15/54, Final U.K. consumption for 1953 was roughly eight
ounces per head Pe'r week, an increase
of
30 to 40 percent over the two previous years.3/1/54 U.K. confectionary distribution over November,
December, and January was 10.3, 9.3, and 7.9
ounces per head per week; respectively. Apart from a slight reduction in bar size, manufacturers
have not increased retail prices so far.
6/10/54. U.K. confectionary consumption remains at the high level of eight ounces per head per week.
Using the final adjusted figures, U.K. per capita consump-tion figures for 1953 and 1954 were 8.5 and 8.9 ounces per week, versus something less than six ounces during 1952. These fi-gures cover all confectionary, including non-chocolate con-fections. 1953 U.K. cocoa bean grindings were up about 19 percent over 1952 grindings.
As is evident from the above Gill and Duffus comments, the marked increase in U.K. consumption caught the market somewhat by surprise. Yet by October, 1953, when the
magni-
-24-tude of the demand increase was already fairly evident, spot Accra in New York had only reached 40.0 cents per pound, 28.9
cents below its eventual high of 68.9 cents reached in July, 1954. The main cause of the continued increase in prices was a rapid deterioration of the world cocoa production
outlook as the African crops were harvested. Gill and Duffus' forecast of 1953-54 world productioni fell from 756,000 tons in October to 714,000 tons in January. Over the same period their estimate of 1953 world absorption, which had already increased over 100,000 tons in eight months, continued to climb from 783,000 tons in October to 806,000 tons in January. By January the price had reached 54.2 cents per pound.
The continued and dramatic upward trend from January through July is more difficult to explain. Some small French shippers did default on their obligations to ship cocoa, which did not serve to calm an already nervous market, and which may have been interpreted bullishly. More important,
demand, especially in Europe, was holding up quite well in in the face of increased prices. This shows up clearly in Figure 2-2, which indicates the estimated monthly season-ally adjusted world grind (derivation given in Chapter 5)
along with spot Accra in New York, over the period of interest.
kith Brazilian production adjusted to conform to the inter-national crop year.
-25-After falling sharply during the second half of 1953, worid grindings actually increased on a seasonally adjusted basis over the first half of 1954. This led to the somewhat per-plexed statement by Gill and Duffus in February:
Despite the great price increase, demand has so far been well sustained. This level can-not be maintained in 1954 given the amount of cocoa available.
On the other hand the outlook for the Brazilian Temporao crop was rapidly improving, with the result that by June
Gill and Duffus had raised its world production estimate to 740,000 tons, 26,000 tons greater than the January estimate.
Further, in May Gill and Duffus quoted estimates of the decline in U.S. cocoa consumption in 1954 relative to 1953 as ranging
between 25,000 and
60,000
tons, or roughly 10 to 25 percent.2.2 1954-57 Bear Market
As indicated in Figure 2-2, the aggregate seasonally adjusted grind of the five leading consuming nations began to fall off sharply again in June, 1954. This development made the market vulnerable to any bearish break in cocoa news,
since it- decreased manufacturer support. The break came in
the form of a rapid softening of Brazil's marketing policies.
After having made substantial forward sales earlier in the year,
Brazil found her sales lagging badly during the May-June interval as buyers felt that cruzeiro devaluation, with
resulting lower Brazilian export prices, was imminent. Bra-zil's first move came in early August, when the minimum export price for September delivery was lowered from 63-25 cents per pound, FOB, to 62 cents. Then within a week the
cruzeiro was devalued by allowing 20 percent of cocoa
expor-ters' dollar revenues to be exchanged at the free market exchange rate, rather than at the much ;.ower official ex-change rate as had been required earlier* The increase
in the internal cocoa price (in cruzeiros) which this brought
immediately caused a sharp increase in offers by Brazilian exporters. Simultaneously the minimum export prices for
cocoa were eliminated. The result of these steps was a
sharp break in Brazilian export prices for immediate ship-ment from 63.25 cents per pound to 52 cents. At first the British Marketing Board, which had begun its forward sales of the new African crops, lowered its asking price only
slightly to a level nine cents above the Bahia sales level
(versus the normal premium of about one cent). But within' two weeks the British also came down and were making sales at levels competitive with Brazil.
Thus in less than one month cocoa prices had been brought back to their January levels. From there prices entered into a prolonged decline which persisted over some 30 months, ending in March, 195T- The decline found its cause in three
-27-relatively long lag in the reaction of world consumption to the decline in raw cocoa prices. As indicated in Figure 2-1, world production increased from 1953-54 to 1954-55 by some 24,000 tons, while world absorption declined from 730,000 tons
in 1954 to 720,000 tons in 1955. The decline in absorp-tion took place despite a significant drop in prices coupled with an economic boom in the West, and reflected the fact that the high prices which existed during 1954 strongly in-fluenced consumption in 1955. This is indicated in Figure 2-2. Seasonally adjusted world grindings remained at a broad plateau during 1955, apparently reflecting the price plateau at about 49 cents per pound which lasted through most of the marketing season for the 1954-55 African crops.
As the price continued to decline during 1955 and 1956, world absorption resumed its uptrend, finally catching up with and surpassing the more slowly rising rate of world production in 1957, and thereby setting the stage for the
next bull market.
2.3 1957-58 Bull Market
By March, 1957, world cocoa absorption had reached a record level, and cocoa prices were at their lowest levels since 1949. Against this background the Brazilian government
announced a new plan for financing farmer and dealer holding of a major portion of the coming Temporao crop in order to
-28-enable the Brazilian cocoa trade to hold out for higher prices. The plan was announced only after the African pro-ducers had marketed the major portions of their crops, leav-ing Brazil as the only major producleav-ing area with a substan-tial amount of cocoa left to sell over the six month interval before the 1957-58 African crops would become available.
The management of the Brazilian withholding effort was
placed under the direction of Dr. Tosta Filhio, operating out of the Bank of Brazil. In May Dr. Tosta announced a minimum export price some four cents per pound over the then
existing market level, thus effecting a complete withdrawal of Brazil from the world market. The magnitude of the
hold-up relative to the Brazilian marketing pattern which existed during the previous year is indicated in Figure 2-3. By the end of August Brazilian sales lagged the previous year by almost 60,000 tons, or roughly seven percent of the 1956-57 world crop.
As could be expected, the Brazilian withdrawal left the market in a state of confusion. World production had in-creased for three years in a row and there was no reason to expect a reversal in this trend. On the other hand world absorption had almost equaled production in 1956, and by the summer of 1957 was once again in an uptrend in response to the low prices which had existed earlier in the year. More
-p 0 *1'1
r
4.,'4
0 I,d
s O 0 -* Rs: N. ) T TA- M X G ? 1N.-kL~fkk+E;S-Sro ARD
IR :*C-S7
withdrawn from the market. As a result, cocoa prices in June were some eight cents per pound above their March lows.
As developments unfolded regarding the new cocoa crops available to the market, the Brazilian withdrawal took on the aspect of one of the largest and most successful speculations
in the history of the world's commodity markets. First it became evident that the Temporao crop itself would be some
6,000 tons smaller than that of the previous year. Then the Ghana mid crop, initially forecast by Gill and Duffus at 12,000 tons, finally totalled only 2,634 tons. But the most important news was yet to come. In September Ghana issued its official forecast of the new main crop at 235,000 tons; down from 262,000 tons for the previous year. Even this proved optimistic, as the crop finally totalled only 195,000
tons. At the same time Nigeria's main crop fell to 74,000 tons from 122,000 tons during the previous year. Total
world production in the 1957-58 crop year fell over 14 percent from 893,000 tons to 767,000 tons.
As the magnitude of the crop shortage was slowly becoming
evident during the early fall of 1957, world grindings were
still climbing at a rapid pace (see Figure 2-2), reaching a peak in November. As a result cocoa prices continued their
climb and finally caught up with the Brazilian minimum export price, with the result that in September and October Brazil
inven-tories cut to minimum levels prices continued to climb,
though eratically, through June, 1958.
2. 195862 Bear Market
During the late summer and early fall of 1958 crop views evolved in a manner essentially opposite to that of
the previous summer. First it became evident that the Tem-porao crop would be over 15 percent larger than the previous
Temporao crop. Then the Ghana mid crop turned out at 11,851 tons versus 2,634 tons the previous year and an earlier
fore-cast of 4,000 tons. Moreover, the trade generally viewed the outlook for the African main crops as being very bright, which opinion was supported by the official Ghanaian forecast
in September at 237,000 tons, over 20 percenti greater than the previous year's 195,000 ton main crop. As a result of these
developments prices in October were some 10 cents below their August average. of 47.4 cents per pound, basis spot Accra in New York.
The rosy outlook generally held by the cocoa trade re-garding the size of the African crops reversed sharply and
suddenly in early October, with the result that during the five week interval from October 7 to November 17 spot Accra
in New York advanced from 36.9 cents per pound to 46.9 cents per pound. Then, almost as rapidly, the production outlook became rosy again, causing spot Accra in New York to fall to
-32-35.3 cents per pound on February 6. .The events which underlay cocoa price movements from August, 1958, through February, 1959, provide an extreme case of the price determining process which the cocoa market commonly goes through during that season of the year. For this reason it should be interesting to
go into those events in some detail.
The first noteworthy aspect of the usual process is the
heavy emphasis which published and unpublished market views
place on the expected size of the Ghanaian main crop, the har. vest of which begins sometime in September or Ogtober. This emphasis finds its origin in three facts: (1) it is easier to concentrate on estimating the size of one relatively local crop than it is to try to estimate the crops of several nations with differing growing conditions; (2) the Ghanaian main' crop generally accounts for some 30 to 40 percent of annual
world production; and (3) more often than not as far as cocoa
crops are concerned, Africa goes as Ghana goes, and all of
Africa normally accounts for about 70 percent of world pro-duction. In late 1958, the market placed its usual heavy
emphasis on the expected size of the Ghanaian main crop.
Second, before the actual harvest begins, estimates of the size of the forthcoming Ghanaian main crop are quite sub-jective, and are vulnerable to extremely large errors. These
two characteristics of early cocoa crop forecasts arise in turn from two facts: (1) little is known today, at least
--33-in a quantitatively useful form, regard--33-ing the way --33-in which the size of a given crop is determined by nature and the cocoa economy; sand (2) much of the data which one would want to have in making a forecast or in constructing a reliable general forecasting procedure is not available.. For example
in Ghana only very sketchy information exists regarding the number of existing cocoa trees, or the age distribution of the trees, or the planting rate of new trees, or the distri-bution of various strains having different characteristic yields. All of these variables have an important effect on the size of the Ghanaian crops. The data is not
avail-able primarily because of the peasiant nature of the Ghanaian
(and, more generally, African) cocoa economy, which makes the
collection of reliable data difficult. As a result rather subjective estimates of the above variables are coupled with
guesses about the progress of new technology (e.g. the use of sprays and fertilizers) and about the effects of diseases and pests, available weather information, the size of the
previous mid crop (an abnormally large mid crop is often followed by an abnormally large main crop), and any other variables deemed important to arrive at pre-harvest
fore-casts of the main crop. As observed above, in the late summer and early fall of 1958 the early forecasts called for a substantial increase in the size of the Ghanaian main crop, apparently based on the relatively large mid crop,
M34-coupled with what were generally felt to be good weather con-ditions for the main crop.
Third, the source material of crop forecasts quickly shifts from the above subjective information to weekly har-vesting data, as such data begins to become available in
September and/or October. More accurately, the data which is used is the weekly purchase rate by the Ghanaian Marketing Board from the cocoa farmers; this is a lagged version of the harvesting rate. The purchasing rate data receives its
emphasis primarily because of its quantitative form and its direct link to the final crop size, which is simply equal to the sum of all of the weekly marketing board purchases.
More-over, the weekly purchases generally follow a common pattern,
so that after roughly 10 weeks of purchases are known
(gene-r a 1 y near the end of November) one can reasonably guess that a certain percentage of the crop has been harvested, and can base a forecast of the total crop on that notion.
It was such a transition from the initial subjective fore-casts to the later forefore-casts based on purchasing rate data that underlay the violent price fluctuations in late, 1958. Figure 2-4 shows the pattern of accumulated purchases
lIn some years the marketing board has allowed purchases to accumulate for two or three weeks before announcing the first
"weekly" purchase figure. This shows up in the form of a
first week purchase figure substantially larger than the second week's figure, a relationship not representative of the actual harvest pattern. For such seasons I have assumed that the
first announced figures actually represented the first two or
'oo- 7--1' 0 7
-4
IF
4o 20K
2 { t* oo 3% 199-6 95c-b-55 t3 1961- I 1 4--f..L 3.4 ' (. T g i~ lo it \? 4 % 70 oz ~z52 5 .-4
&l4pt9KA RACkA
uCAK\ iT\Ck opt.
Z-4
for six consecutive Ghana main crops starting with the
1956-57 season. Two things are clear from Figure 2-4: (1) all
of the seasons except 1958-59 had rather similar purchase
rate patterns; and (2) in the 1958-59 season the bulk of'
the crop was bought much later than usual. Figure 2-5
shows the average pattern of weekly and cumulative purchases for the six seasons, excluding 1958-59, based on the percen-tages given in columns (b) and (c) of Table 2-1. Column
(d) in Table 2-1 gives the factor by which one would
multi-ply cumulative purchases to date in order to estimate final
crop size on the assumption that the purchase pattern was "normal"(i.e. average). For example, at the end of the llth week 50 percent of the crop has, on the average, been
pur-chased, so that an estimate of the total crop would be equal to twice the cumulative purchases through the 11th week.
Figure 2-6 shows the dynamic behavior of actual fore-casts made of the Ghanaian main crop during the fall and win-ter of the 1958-59 season, along with a forecast series based
on the assumption that the purchase pattern was normal. The similarity in pattern between published forecasts
and the forecasts based on cumulative purchases indicates the degree to which the published forecasts were based
on available purchase data and the assumption that purchases would follow an approximately normal pattern. Another
40
57-oes
toto
x LJJ C AA CkepTable 2-1: Average Ghanaian Main Crop Purchase Percentages (a) (b) Average*
%
Purchased This Week .5 1.5 2.0 3-0 3-5 5-0 5-5 6-5 7.5 7-5 7-5 7-5 7-5 7.0 5-5 5-0 4-5 3-5 2-5 2.5 2.0 1.0 .5 -5 -5 (c) Average%
Purchased To Date .5 2.0 4.0 7-0 10-5 15-5 210C 27-5 35-0 42-5 50-0 57-5 65-0 72.0 77-5 82.5 87-0 90-5 93-0 95-5 97-5 98.5 99.0 99-5 100.0* Based on the seasons from 1956-57 thru 1962-63, excluding 1958-59 1
+ Muliplie =Fraction Purchased to Date
Multiplier+ 14-30 6.45 4-76 3.63 2.86 2-35 2.00 1-74 1.54 1-39 1.29 1.21 1-145 1.105 1-075 1.045 1.025 1-015 Week