HAL Id: hal-02596218
https://hal.inrae.fr/hal-02596218
Submitted on 15 May 2020
HAL is a multi-disciplinary open access archive for the deposit and dissemination of sci-entific research documents, whether they are pub-lished or not. The documents may come from teaching and research institutions in France or abroad, or from public or private research centers.
L’archive ouverte pluridisciplinaire HAL, est destinée au dépôt et à la diffusion de documents scientifiques de niveau recherche, publiés ou non, émanant des établissements d’enseignement et de recherche français ou étrangers, des laboratoires publics ou privés.
Sub Surface Drip Irrigation Using Chapin Tapes : case
stydy for a corn crop under a Mediterranean climate
P. Rosique, Pierre Ruelle
To cite this version:
P. Rosique, Pierre Ruelle. Sub Surface Drip Irrigation Using Chapin Tapes : case stydy for a corn crop under a Mediterranean climate. [Technical Report] irstea. 2009, pp.20. �hal-02596218�
1
Sub surface drip irrigation
using Chapin tapes
Case study for a corn crop
under a Mediterranean
climate
1st experimental campaign
February 2009
P.Rosique, P.Ruelle, M.Khaledian
G-EAU
Cemagref de Montpellier
CemOA : archive ouverte d'Irstea / CemagrefINTRODUCTION
This report is concerning the experimental characterization of the behaviour of the subsurface Chapin tapes (Jain) underneath tilling implemented in Montpellier according to the agreement between Jain and Cemagref. Two main objectives were assigned to this work:
1. the study of its capacity to feed with water a maize crop, the study of the amount of water saved by using subsurface drip irrigation in comparison with a sprinkler irrigation in the Mediterranean climate .
2. the study of the nitrogen fertigation and its capacity to decrease the risk of nitrogen leaching under maize crop while optimizing crop production.
Agriculture must match challenge and environmental issues: “agriculture must produce more food
to meet increasing food needs but using less water … “1 According to FAO, irrigated agriculture will
have to produce 80% of food increase needed for world population growth during next ten years. Drip irrigation is considered as a possible technique to face water savings challenges.
Drip irrigation is now a well known technique, improvement was obtained by burying rigid drip equipment in the soil. But to use subsurface drip irrigation on a large extend for crops such as corn it is necessary to look for new less expensive equipments.
New researches are needed to characterize the behaviour of such equipment in different pedo-climatic conditions over years and elaborate tools for advices on the best way to use it for a sustainable crop production.
This study on subsurface drip irrigation realized in Montpellier at Lavalette experimental station under a Mediterranean climate with an important rainfall inter-annual variability, but there are few rainfalls and a high water demand during summer. These climatic conditions are favorable to achieve research results on irrigation.
The 2008 campaign was the first campaign of a three-year field experiment. A lot of field operations were done. The subsurface drip equipment was installed in April a short time before sowing a corn crop, so due to the modification of soil structure provoked when burying the drip tapes in the soil, the present results should be considered as preliminary ones. However interesting observations were collected.
In the first part of this document, the experimental design and measurement equipment are described. In the second part, agronomic and hydraulic results are analysed and data from the main experimental treatments are used to present soil water transfers. A conclusion summarizes the issues of the first year of experiment and the points to look at.
This work was realized by members of the Joint Research Unit G-EAU (Water Management, Actors, Usages) and has been partly supported by the JAIN IRRIGATION SYSTEMS Co. Ltd
1
ICID congress conclusions, Cairo, Egypt, 1996
CemOA
: archive
ouverte
d'Irstea
1 EXPERIMENTAL DESIGN AND MEASUREMENT EQUIPMENT
1.1 PEDO-CLIMATIC CONTEXT
1.1.1 Location of the experimental site
The crop experimental station of Lavallette in Montpellier (43° 40’N, 3° 50’E, altitude 30m) is situated on the right bank of the Lez River at about 15 km from the Mediterranean sea.
1.1.2 Soil characteristics
The soil is from both colluvial and alluvial origin being very deep, with a water table which is deeper than 5 m in summer and does not contribute to water supply of crops. It has a favorable agronomic quality without any coarse element and a loamy sandy to loamy clayey sandy texture depending on its distance from the river which is in the Northern direction. As shown in table 1, the clay content is about 20% for the upper layer. Near the river there is a small increase of the clay and silt content of the layer 120-150 cm and at the opposite, the sand content is higher in the south part of the field. Due to these characteristics, the soil water storage capacity is high and ranges from 120 to 180 mm/m.
Table 1. Granulometry analysis of Lavalette soil (2002)
Clay (%) Silt (%) Sand (%)
Depth (cm)
North South North South North South
0-30 18.4 22.2 42.0 48.7 39.3 29.1 30-60 17.6 23.7 43.6 48.6 38.8 27.8 60-90 20.2 47.4 32.4 90-120 20.2 54.6 22.2 120-150 26.7 24 48.0 44.0 25.2 32.0
1.1.3 Climate
The climate is of Mediterranean type with a mean monthly temperature of 6°C in January and 22°C in July; rainfalls are variable along the year with a maximum in October (usually) and a total annual amount of 750 mm. There is a huge water deficit during summer of around 350 mm between PET
(potential evapotranspiration)
and rainfall.0 20 40 60 80 100 120 140 Sep t Oct Nov Dec Jan Feb Mar ch Apr il May June Ju ly Aug Sep t Oct R a in fa ll ( m m )
Fig 1a: Monthly rainfall of in 2007-2008
rain events occurred and a total of 200 mm was recorded during the two next months (fig.1b). So the soil was very wet during the beginning of the cropping season and there was no need for
CemOA
: archive
ouverte
d'Irstea
emergence irrigation. Due to that situation, it wasn’t possible to test, as planned, the efficiency of subsurface drip irrigation to wet the seed bed zone.
1.1.4 Measurements equipment and monitoring on the experimental plots
Climatic data were recorded by an agro-climatic station situated near the plots. Irrigation water depth was controlled for drip irrigation as well as for sprinkling irrigation treatments. Soil water status was monitored during the cropping season by a periodic measurement of soil water content with a neutron probe; additional capacitive measurements were used during short periods. During the first part of the season, soil matric potentials, using tensiometers, were determined to evaluate soil water fluxes. Crop growth was monitored by Leaf Area Index measurements. The characteristics of the equipment and sensors are described below.
1.1.4.1 Agro-climatology
An automatic climatologic station, CIMEL Enerco 411 is monitoring ten parameters that are registered at a time step of one hour.
From those values it is possible to access to the
following data that were used for this
experimentation:
- mean daily air temperature - Potential Evapotranspiration - daily rainfall
- daily global radiation
The station is connected to Agroclim INRA Network. This network realizes a continuous monitoring of the values with a validation of the collected data.
1.1.4.2 Irrigation water depth
• Drip Irrigation
Water depths for each plot were evaluated, on one hand, using theoretical discharge of the tape and the registration by a trainee of both the irrigation duration (scheduled by automatic valves) and
the pressure du 0 100 200 300 400 500 600 700 800 20/04/08 20/05/08 19/06/08 19/07/08 18/08/08 17/09/08 17/10/08 W a te r fl u x ( m m ) PET Rain
Fig. 1b: Cumulative value of Rainfall and PET during the cropping season of 2008
CemOA
: archive
ouverte
d'Irstea
In 2008, the climatic conditions were far from the normal year with a dry winter but a rainy spring
(Fig.1a). The amount of rainfall from January to the 20th of April was only 173 mm but then a lot of
ring irrigation. They were compared on the other hand, with the values measured by volumetric water meter.
• Sprinkling Irrigation
A series of three rain gauges with a triangle arrangement around the neutron probe measurement site was used on the two treatments irrigated with a raingun: TS (tillage system) and Direct Seeding.
Rain gauges were regularly raised to be 10 cm higher than the top of crop.
1.1.4.3 Soil water status
• Neutron probe
An aluminium access tube of 2 m was driven down in the soil to realize neutron probe measurements of soil water content on each of the following treatment: SDI 120 South, SDI 120 North, SDI 160, DS DSI 160, TS, TCWI, and Direct Seeding.
The Neutron probe is a 503 DR Campbell Pacific Nuclear; measurements took place every week on Monday morning, after water redistribution during drip irrigation and 5 days after watering on treatments with sprinkler irrigation.
• Capacitive probe
Two treatments were equipped with access tubes for automatic capacitive measurement of soil water content to monitor soil water content evolution during irrigation: SDI 160 and DS-SDI-160. The first access tube was of 15 cm from the tape and the second one on the row between two plants of corn.
The equipment consists in two Envirosmart Sentek Water content profile probes with SDI outputs connected to a Datalogger from Campbell Sci. Ltd. Each probe was customized with 6 sensors at different depths.
Measurements were registered with a time step of 20 min.
• Tensiomers
A series of tensiometers from SDEC (France) were placed from 10 to 150 cm depth in the main treatments. Values were collected every morning between 8:30 and 9:30 to avoid disturbance from temperature
1.1.4.4 Leaf Area Index (LAI) measurement
Measurement of LAI was realized about once a week in each treatment using a LAI 2000, LI-COR Plant Canopy Analyzer. The objective of these measurements was to monitor plant growth and
possible water stress
.
1.2 Experimental design
1.2.1 Tillage and cultural practices
Two types of tillage and cultural practices were used in this experiment: conventional tillage in the West side of the field and no-till with direct seeding into mulch in the East side of the field.
CemOA
: archive
ouverte
d'Irstea
• Conventional tillage
After harvesting of the previous crop (corn for this experiment) a series of tillage operations: incorporation of plant residues, ploughing, fertilizer application and seedbed preparation were implemented before sowing. It’s the classical technique used in the most farm
• No-till with direct seeding into mulch (DS)
With such a technique which belongs to conservation tillage family, the soil should never be bared and a “cover crop” is planted after harvest of the main crop (in our case, a mix of vetch, oat and rapeseed was planted after corn harvesting).
These tillage practices where combined with irrigation techniques to obtain 9 experimental treatments as shown below
1.2.2 Experimental Treatments
Nine treatments were implemented in 2008:
DTS-MET: (1) (Drip Tape Surface control treatment MET) Plot with a row spacing of 80 cm and 8 tapes on the surface of the soil with a spacing of 160 cm; well watered crop: V max.
SDI 160: (2) ( Subsurface Drip Irrigation with a tape spacing of 160 cm ) Plot with a row spacing of 80 cm and 12 tapes buried at a depth of 35 cm in the soil with a tape spacing of 160 cm; restricted irrigation: 70%V max.
SDI 120 N: (3) ( Subsurface Drip Irrigation with a tape spacing of 120 cm ) Plot with a row spacing of 60 cm and 17 tapes buried at a depth of 35 cm in the soil with a tape spacing of 120 cm; restricted irrigation: 70%V max.
SDI 120 S: (4) ( Subsurface Drip Irrigation with a tape spacing of 120 cm ) Plot with a row spacing of 60 cm and 17 tapes buried at a depth of 35 cm in the soil with a tape spacing of 120 cm; restricted irrigation: 60%V max.
DS-SDI-ETM: (5) (Direct Seeding Subsurface Drip Irrigation control treatment MET) Direct Seeding Plot with a row spacing of 80 cm and 7 tapes buried at a depth of 20 cm in the soil with a tape spacing of 160 cm; well watered crop: V max.
DS-SDI-160: (6) (Direct Seeding Subsurface Drip with a tape spacing of 160 cm) Direct Seeding Plot with a row spacing of 80 cm and 12 tapes buried at a depth of 20 cm in the soil with a tape spacing of 160 cm; restricted irrigation: 70%V max.
TCR: (7) (Treatment conventional Raingun irrigation) Plot with conventional tillage and a row spacing of 80 cm, irrigated with a raingun; restricted irrigation: 70%Vmax.
TCWI: (8) (Treatment conventional without irrigation) Plot with conventional tillage and a row spacing of 80 cm: rainfed crop
DSR: (9) (Direct seeding Raingun irrigation) Direct Seeding Plot with a row spacing of 80 cm, irrigated with a raingun; restricted irrigation: 70%Vmax.
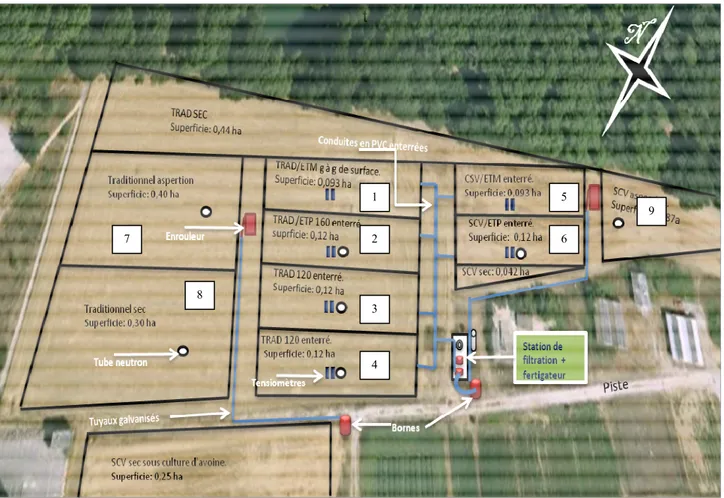
The location of the treatments is indicated in fig. 2.
CemOA
: archive
ouverte
d'Irstea
t
Fig. 2: Experimental design and different plots
1.3 MAIN CROPPING SEASON INFORMATIONS
1.3.1
Crop variety
The corn crop variety was: Pioneer PR33TY65. This hybrid has a high yield potential. With a base temperature of 6 °C, this late variety requires 103 0 degree days from sowing to flowering and 2055 degree days from sowing to harvesting at 32% grain humidity.
1.3.2 Soil preparation and planting
• Soil preparation and fertilization
For conventional tillage plots, ploughing took place on 11/19/2007. Then 400 kg/ha of super phosphate 45% were applied on 03/20/2008 and two crossed harrow passes were done to achieve a relevant levelling of the soil as well as weed destruction. In direct seeding treatments, the cover
crop was partly destroyed using a rototiller and
an herbicide (glyphosate) was applied. The
same amount of fertilizer were applied in these plots.
3 5 8 1 2 7 6 4 9 CemOA : archive ouverte d'Irstea / Cemagref• Planting
Corn was planted on 04/30/2008 for plots with a row spacing of 80 cm with 90 000-100 000
seeds/ha. The pneumatic SEMEATO® drill was used for direct seeding into mulch plots and
conventional plots. During sowing, an insecticide (curater) was applied beneath the sowing line as well as a fertilizer (30 kg N/ha) was applied.
For conventional tillage plots with a row spacing of 60 cm, corn was sown on 05/01/2008 with a pneumatic MONOSEM drill at the same density. In that case, due to drill equipment limitation no fertilizer was applied.
The rows orientation of the whole experiment was West-East. The soil was then packed down with a roller in all plots.
1.3.3 Nitrogen fertilization
The amount of N needed was calculated according to soil N content in the soil at the planting date (see below). On 06/11/2008 nitrogen fertilization (450 kg/ha of ammonitrate 33%) was spread on all plots except plots with subsurface drip irrigation. For those plots fertilizer was applied through drip irrigation (fertigation).
1.3.4 Weed control
Due to a lot of rain events during the first two months of the cropping season weed control wasn’t very efficient. Herbicides couldn’t be applied at the right time and were partly leached. However the effect on crop growth was limited (see below).
1.4 Irrigation and Fertigation
Water for irrigation is delivered by an automatic pumping station with pressure regulation in two points of the experimental field for drip irrigation and for raingun irrigation.
As noticed above, a comparison between theoretical water application depth calculated from equipments characteristics and measured volumes was made; using water meters for drip irrigation and local measurements with raingauge for raingun irrigation.
1.4.1 Irrigation doses for the different plots
For raingun irrigation (TCR and DSR plots) the calculated water application depth was very near the measured value (fig. 2 and table 2). .
For DTS 160 ETM, where the tapes were placed on the surface of the soil, the result was the same: there was no gap between calculated and measured water depth. But it was different for all other plots with subsurface drip irrigation, the calculated values overestimate the water application depth given by the water meters.
CemOA : archive ouverte d'Irstea / Cemagref
0 100 200 300 400 DSR TCR DS-SDI-160 DS-SDI-MET SDI 120 N SDI 120 S SDI 160 SDI 160 MET Cumulated Dose (mm) Measured Calculated
Fig. 2: Comparison of cumulated calculated and measured water application depth on the different plots in 2008
These differences can be explained by the influence of soil pressure on the tape. The outside pressure was not the atmospheric pressure and discharge was less than planed. Values for conventional tillage plots are summarized in table 2.
Table 2 Comparison of calculated and measured water application depth (mm) for drip irrigation
Plots Calculated Measured
SDI 120 N 280 193
SDI 120 S 270 182
SDI 160 281 236
DTS-MET 367 373
TCR 269 280
A control of water pressure for each plot is necessary to apply the planned irrigation dose. A control and a comparison of all manometers and equipments will be done for the next experimentation seasons.
1.4.2 Fertilization
All treatments with drip irrigation were fertilized using a N fertilizer solution which was mixed with irrigation water by a pump (Dosatron). The amount of soil residual nitrogen and of fertilizer applied at sowing are summarized for all conventional tillage plots in fig. 3.
CemOA
: archive
ouverte
d'Irstea
0 20 40 60 80 100 120 140 TCWI TCR SDI 120 SDI 160 SDI 160 MET
Nitrogen ammount (kg N /ha)
N Application at sowing Soil residual Nirogen
Fig. 3. Amount of nitrogen in the soil and of nitrogen applied at sowing in the converntional plots in 2008
According to mineralization previously observed and N crop requirement, a grain yield target of about 15 t/ha can be obtained unless in TCWI, where the yield target was less than 10 t/ha, depending on rainfall during the cropping season.
2 RESULTS AND DISCUSSION
2.1 Agronomic Results
2.1.1 Crop Yields
Due to the modification of soil structure during the installation of subsurface drip irrigation as indicated above, it is not possible to take into account the obtained yield for Direct Seeding plots in comparison with conventional tillage. We noticed that the abundant germination of weeds occurred in DS treatments and corn growth was disturbed and only some information on water monitoring for these treatments will be given farther.
.
0 2 4 6 8 10 12 14 16SDI 120 N SDI160 TCR TCWI
G ra in Y ie ld ( t/ h a ) 0 100 200 300 400 500 600 W a te r d e p th ( m m ) Yield RR+Irr .
15.0 t/ha 15.1 t/ha 12.7 t/ha 3.4 Q/ha
Fig. 4: Comparison of water application depth and yield on main conventional plots
CemOA
: archive
ouverte
d'Irstea
In conventional tillage plots, a lower amount of irrigation with subsurface drip irrigation did not reduce crop yield as shown in fig. 4. The same grain yield of 15 t/ha (for a standard humidity of 15%) was obtained for a row spacing of 80 cm as well as for 60 cm. The obtained yield reached the target yield for these treatments. The yield for the well watered treatment (DTS-MET ) was a few lower (14.5t/ha) due to a late application of N fertilizer.
For the raingun irrigated plot (TCR) water stress was probably most important: a part of the applied water was evaporated at the soil surface and submitted to wind effect.
The plant density was around 80 000 plants/ha at harvest for all plots. Total Dry Matter yield was 24 t/ha for SDI 160 and SDI 120; so the Harvest Index is 0.53 which is a high value.
In the rainfed plot, the yield was very low, with no rain events during the flowering stage. The hypothesis is that this treatment cumulated both water and nitrogen stress.
2.1.2 Leaf Area Index analysis
LAI is a main factor for water consumption, total dry matter production and grain yield. The evolution of LAI depends on water stress but also on fertilizer supply to the plants. A continuous monitoring was done in three treatments (fig. 5) with a time step of around one week. We should remind that this measurement involves in constraint due to the fact that it must be done only under diffuse light, usually during a short time at sunset or sunrise.
0 0.5 1 1.5 2 2.5 3 3.5 4 4.5 5 15 /0 6/2 008 22 /0 6/2 008 29 /0 6/2 008 06 /0 7/2 008 13 /0 7/2 008 20 /0 7/2 008 27 /0 7/2 008 03 /0 8/2 008 10 /0 8/2 008 17 /0 8/2 008 L A I (m ²/ m ²) Trad SDI 160 Trad SDI 120 SCV SDI 160
Fig. 6: LAI evolution during two months for three irrigated plots
According to the values of standard deviation there is no significant difference between the two treatments i.e. SDI 160 and SDI 120 with conventional tillage. The maximum value of LAI is approximately 4.2 . There is a decrease of LAI with a higher variability around the mean value at the beginning of August. As there was a strong lowering of water irrigation, the existence of a short stress period is possible.
For DS SDI 160, the values were lower; crop growth was less satisfactory due to the fact that plant density was lower. CemOA : archive ouverte d'Irstea / Cemagref
2.2 Soil water content analysis
2.2.1 Soil water content profiles
From neutron probe measurements at different depths it is possible to look at soil water profiles and their evolutions during the cropping season. The evolution of the curves of soil water content, in fig. 7, points out the layers contributing to water uptake of the crop for a measurement made exactly on the row of corn plants. Plant water uptake is concerning a depth of 120 cm deeper on raingun irrigated plot (TCR) but the water uptake is limited at that depth. The situation is approximatively the same under drip irrigation. So we can say the soil water reserve was pretty well used with subsurface drip irrigation.
0 20 40 60 80 100 120 140 160 180 200 0.0 0.1 0.2 0.3 0.4
Soil water content (cm3/cm3)
D e p th ( c m ) 20/06/2008 03/07/2008 17/07/2008 21/07/2008 28/07/2008 06/08/2008 13/08/2008 0 20 40 60 80 100 120 140 160 180 200 0.0 0.1 0.2 0.3 0.4 Soil water content (cm3/cm3)
D e p th ( c m ) 10/06/2008 18/06/2008 03/07/2008 16/07/2008 21/07/2008 30/07/2008 04/08/2008 18/08/2008
TCR Treatment SDI 160 Treatment
Fig. 7: Soil water content profile evolutions for raingun and subsurface drip irrigated plots Near soil surface, soil water content remains higher for SDl, especially at 20-30 cm which can be explained by water transfer from the tape (which is about 30 cm from the row and at a depth of 35 cm). No increase of soil water content is seen on TCR because of measurement protocol: neutron probe measurements were made the day before irrigation and the last irrigation had been done a week before. On the contrary for SDI, irrigation was applied only three days before. Such measurements are not sufficient to look for capillary rise up to the soil surface. During summer the surface of the soil above drip tapes was always dry, but we cannot conclude about possible capillary rise at the sowing date with a wet soil and higher application depth.
2.2.2 Water stocks
First we can notice in fig. 8, as foreseen, that water stock for the layer of 0-150 cm was lower for plots near the river where the clay content is lower. So SDI 160 stock was lower than SDI 120 but
CemOA
: archive
ouverte
d'Irstea
as the irrigation scheduling was the same most of the time, the evolution of the water reserve was similar all along the cropping season.
It appeared only a small increase of soil water content on 75th days after sowing due to a rainfall.
Water stock during the cropping season was continuously decreasing: the crop was taking water from soil water reserve to complete water delivery in all plots with deficit irrigation. In rainfed treatment corn wasn’t able to uptake a higher amount of water from the soil.
200 250 300 350 400 450 500 550 30 50 70 90 110 130
Day after sowing
W a te r s to c k ( m m ) DSR DS SDI 160 SDI 120 N SDI 120 S SDI 160 TCR TCWI
Fig. 8: Comparison of water stock evolution in layer 0 -150 cm in different plots
A more complete analysis of this phenomenon will be possible by comparison of other cropping seasons with different water allocation regimes.
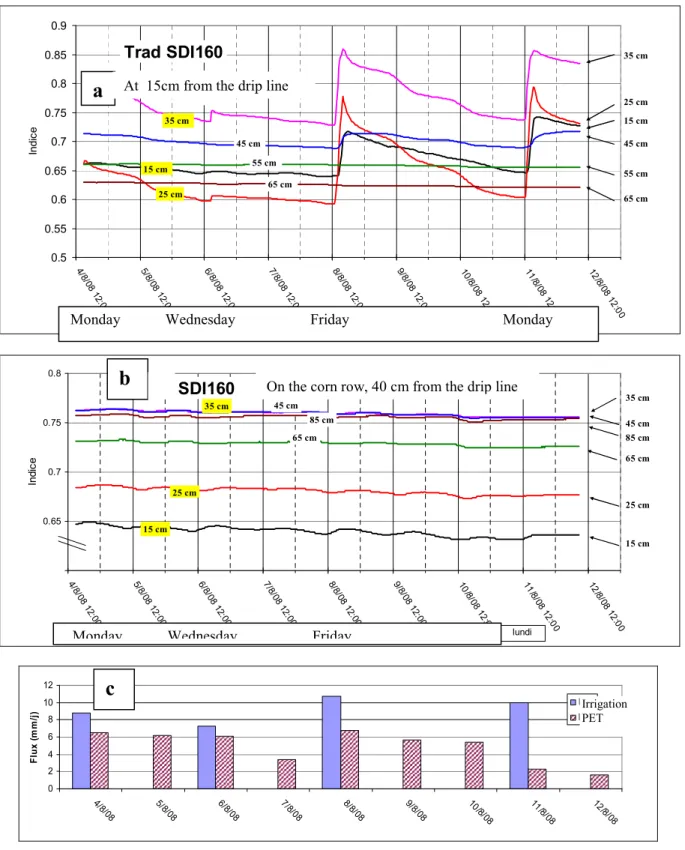
2.3 Characterization of the wetted zone by subsurface drip irrigation
An analysis of the zone wetted by the drip line is possible for SDI 160 where two series of capacitance Envirosmart sensors were placed at the beginning of August. Fig. 9 demonstrates the evolution of soil water content at different depths at a distance of 15 cm from the drip line (a), on the corn row at a distance of 40 cm (b) as well as in relation with irrigations and potential evapotranspiration (c). Irrigation was applied three times a week on this treatment and the dose was doubled on Monday and Friday, due to the fact that there was no irrigation during week-end; such irrigation scheduling allowed to examine the effect of irrigation dose.The vertical distribution of water near the drip line during irrigation can be observed from raw data registered at a time step of 15 min. As shown by the measured signal (fig. 9a) the applied water during the period reached only a depth of 45 cm: there is no increase of the signal of the deeper layers (55 and 65 cm). The higher effect was obtained at 25 cm and a significant one at 15 cm; but as indicated above the surface of the soil was dry.
On the contrary of the phenomenon described on Monday and Friday, only a slight raise of the signals was observed on Wednesday with a single dose of irrigation: the water applied was immediately evaporated by the crop. We can also see that for the three upper depths, the values before next irrigation were equal to initial value: all the water applied was used. For the deeper
CemOA
: archive
ouverte
d'Irstea
layers, there was a small decrease of the signal during the period: the crop uptaked water from soil storage. 0.5 0.55 0.6 0.65 0.7 0.75 0.8 0.85 0.9 4/8/ 08 1 2:00 5/8/ 08 1 2:00 6/8/ 08 1 2:00 7/8/ 08 1 2:00 8/8/ 08 1 2:00 9/8/ 08 1 2:00 10 /8 /08 12 :0 0 11 /8 /08 12 :0 0 12 /8 /08 12 :0 0 In d ic e 15 cm 65 cm 55 cm 45 cm 35 cm 25 cm Trad SDI160 à 15cm de la gaine mercredi
mardi jeudi vendredi samedi dimanche lundi
lundi 65 cm 55 cm 45 cm 15 cm 25 cm 35 cm 0.6 0.65 0.7 0.75 0.8 4/8/ 08 1 2:00 5/8/ 08 1 2:00 6/8/ 08 1 2:00 7/8/ 08 1 2:00 8/8/ 08 1 2:00 9/8/ 08 1 2:00 10 /8 /08 12 :0 0 11 /8 /08 12 :0 0 12 /8 /08 12 :0 0 In d ic e 15 cm 85 cm 35 cm 45 cm 65 cm 25 cm Trad SDI160 à 40 cm de la gaine : sur la ligne de maïs
15 cm 25 cm 35 cm 45 cm 65 cm 85 cm mercredi
mardi jeudi vendredi samedi dimanche lundi
lundi 0 2 4 6 8 10 12 4/8/0 8 5/8/08 6/8/08 7/8/08 8/8/08 9/8/08 10 /8/08 11/8/08 12/8/08 F lu x ( m m /j ) I ETP
Fig. 9: Evolution of the Envirosmart sensors signal in SDI 160 Treatment at different depths for measurements at 15 cm from the drip line at 15 min time step (a), on the corn row, at 40 cm from the drip line (b) in comparison with potential evapotranspiration and irrigation depth in August 2008.
For the curves (b) nearly no variation of the signal is visible, and slight ripples for 15 and 25 cm are difficult to connect to irrigations. So we can say that lateral diffusion did not reach the corn row. During the period the signal was decreasing slowly for all the sensors.
a
Monday Wednesday Friday Monday
Monday Wednesday Friday
b
On the corn row, 40 cm from the drip lineIrrigation PET
c
At 15cm from the drip line
CemOA
: archive
ouverte
d'Irstea
All these observations are in fair agreement with neutron probe measurements, according to the difference of measurement volume between the two methods (some centimeters for capacitance method and about ten to fifteen for neutron probe).
From available data, it is difficult to give a representation of the wetted bulb around the drip tape for the monitored period. A crude representation of the wetted area is given in fig. 10.
.
Fig. 10: Schematic representation of the wetted bulb for SDI 160
The lateral limits are not known. Some more information could be obtained using another Envirosmart equipment in an oblique position, what was done in 2007 for surface drip irrigation. Based on measurements, modelling can also be used to characterize water transfer during irrigation.
2.4 Analysis of root repartition
At harvest, a soil profile was dug by a backhoe to analyze rooting of the crop perpendicularly to the drip lines for SDI 160 and SDI 120. Root repartition was described on a grid of 5x5 cm (fig. 11) using a qualitative index from 0 for no root to 5 for maximum root quantity.
Fig. 11: Position of the grid in the soil profile to analyze root repartition
5x5 cm 40 or 30 cm 35 cm Soil surface
Chapin
drip tape
40 or 30 cm North South Envirosmart Access tube and sensors 15 cm 40 cm 15 cm 35 cmChapin
drip tape 45 cm 40 cm Soil surface CemOA : archive ouverte d'Irstea / Cemagref0 20 40 60 80 100 120 0 1 2 3 4 5 Root Index D e p th ( c m ) North side South side DI 160 0 20 40 60 80 100 120 0 1 2 3 4 5 Root Index D e p th ( c m ) North side South side SDI 160 0 20 40 60 80 100 120 0 1 2 3 4 5 Root Index D e p th ( c m ) North side South side SDI 120 0 20 40 60 80 100 120 0 10 20 30 40 50
Cumulative Root Index
D e p th ( c m ) SDI 160 SDI 120 DI 160 North side South side
Fig. 12: Root index and cumulative root index as a function of depth for DI 160, SDI 160 and SDI 120 treatments CemOA : archive ouverte d'Irstea / Cemagref
A mean value of the index was calculated for each depth and on the North side and South side of the profile to examine possible effect of drip tape and its wet bulb on root repartition.
The value of that index as a function of the depth is presented in fig. 12 for three drip irrigation treatments. We first can see that maximum rooting depth is around 1.2 m and most of the roots are observed in the first 40 to 50 cm. According to the drip tape position on the south side, there was a small increase of root density on that side: near the surface of the soil for DI 160, and approximately at the depth of the drip tape for Subsurface Drip Irrigation Treatments. From cumulative root index (fig. 12 d), we can see that root density was increased from SDI 160 to SDI 120 in comparison with DI 160. It can be a possible effect on reduction of soil compaction by the tool (a chisel) used to insert the tape inside the soil, so this aspect will be examined in 2009.
2.5 Direct seeding and Subsurface drip irrigation
2.5.1 Soil water content profile
As it was said this report presents only some specific aspects concerning water transfer in direct seeding plots.
If we look at soil water content profile (fig. 13) for DS SDI 160, it appears that soil water depletion was less important in comparison with conventional plots. There was few crop water uptake below a depth of 50 cm and nearly no uptake beneath 100 cm.
0 20 40 60 80 100 120 140 160 180 200 0.0 0.1 0.2 0.3 0.4
Soil water content (cm3/cm3)
D e p th ( c m ) 10/06/2008 18/06/2008 03/07/2008 16/07/2008 21/07/2008 30/07/2008 04/08/2008 13/08/2008 18/08/2008
Fig. 13: Soil water profiles during the cropping season for DS SDI plot
Due to this situation it seems useful to analyze water stocks of 50 cm thick layers. The comparison for the plots SDI 160 and DS SDI 160 (fig. 14) points out some difference of behaviour. The two plots are at the same distance of the river and on the tenth of June the values were close for the same layers.
In July the curves for the first layer (0-50 cm) followed a similar evolution and reached the same value at the end of August. But the situation was different for other layers, the crop on DS SDI 160 plot used only a limited amount of the water in 50-100 cm layer on the contrary of SDI 160. In the last layer a small decrease of around 10 mm was observed.
CemOA
: archive
ouverte
d'Irstea
0 20 40 60 80 100 120 140 160 180 01 /06/0 8 11 /06/0 8 21 /06/0 8 01 /07/0 8 11 /07/0 8 21 /07/0 8 31 /07/0 8 10 /08/0 8 20 /08/0 8 S to c k h y d ri q u e ( m m ) 0à50 50à100 100à150 0à50 50à100 100à150 Trad SDI 160 SCVC SDI 160
Fig. 14: Comparison of soil water stock evolution in 50 cm thick layers for SDI 160 and DS SDI 160 plots
These facts confirmed that a direct seeding plot used less water from soil than a conventional plot. The same result was obtained in previous experiments with sprinkler irrigation.
2.5.2 Characterization of the wet zone
Same observations in DS SDI 120 as for DS SDI160 were made. The data were collected one week after measurement analysed above for SDI 160. As for the former plot, at 15 cm from the drip tape, a signal increase was measured for the first four layers (fig. 15) and no variation for the two last ones (53 and 63 cm). So we can confirm that the wet zone did not reached 53 cm depth. On Monday, the amplitude of signal variation was less important in that treatment and on Wednesday, the irrigation took place with a higher value of soil water content than on Monday and we were in the same situation on Friday. At the end of the period there was a slight increase of the value of the signal in the three upper layers that means that the soil water content is higher and a part of the water applied was not used. As shown in fig. 15c, PET was lower during this period of mid August than those observed one week before in SDI 160 plot.
At last we must notice that signal undulation for sensor placed at 15 cm depth proved an increase of soil water content at night time, this can be explained by capillary rise which is favored by a more compacted soil and mulch on the soil surface.
CemOA
: archive
ouverte
d'Irstea
0.6 0.65 0.7 0.75 0.8 0.85 0.9 18 /8 /08 0 :00 19 /8 /08 0 :00 20 /8 /08 0 :00 21 /8 /08 0 :00 22 /8 /08 0 :00 23 /8 /08 0 :00 24 /8 /08 0 :00 25 /8 /08 0 :00 26 /8 /08 0 :00 In d ic e 13 23 33 43 53 63
lundi mardi mercredi jeudi vendredi samedi dimanche lundi
SCV SDI 160 à 15 cm de la gaine 13 cm 23 cm 33 cm 43 cm 53 cm 63 cm 0.6 0.65 0.7 0.75 0.8 20 /8/0 8 0 :00 21 /8/0 8 0 :00 22 /8/0 8 0 :00 23 /8/0 8 0 :00 24 /8/0 8 0 :00 25 /8/0 8 0 :00 26 /8/0 8 0 :00 In d ic e 14.5 24.5 34.5 44.5 64.5 84.5 SCV SDI 160 à 35 cm de la gaine lundi
mercredi jeudi vendredi samedi dimanche
Fig. 15: Evolution, in DS SDI 160 Treatment, of the Envirosmart sensors signal at different depths for measurements at 15 cm from the drip line at 15 min time step (a), on the corn row, at 35 cm from the drip line (b) in comparison with PET and irrigation depth (c) in August 2008
For the measurements on the corn row, being only 35 cm apart from the drip line (and the drip line is place at only 20 cm from soil surface) one can observe an increase of the signal of two upper layers. So lateral water transfers occurred for these layers, and the wetted zone seems to be larger than for conventional tillage
c
b
a
DS SDI 160
DS SDI 160 At 15cm from drip line
At 35 cm from drip line
Monday Wednesday Friday Monday
Monday Wednesday Friday Monday
Monday Wednesday Friday Monday
18 /08 /08 19 /08 /08 20 /08 /08 21 /08 /08 22 /08 /08 23 /08 /08 24 /08 /08 25 /08 /08 I ETP SCV SDI 160 2 6 8 DS SDI 160 CemOA : archive ouverte d'Irstea / Cemagref
2.6 Conclusions and prospects
The implementation of this subsurface drip irrigation experimental set-up opens interesting prospects to identify possible improvements of water and fertilizers productivity in a Mediterranean context for cereals.
Results concerning experimental methods can be resumed as follow:
Equipment used to set up subsurface drip tape in the soil proved to be relevant; water was delivered efficiently but measurement pointed out that delivered volume was lower than planned one, due to possible soil action on drip tape. Complementary observations will be realized to evaluate this effect.
The measurement devices based on tensiometers and neutron probe measurements demonstrated that they are suitable to characterize water flux and plant water uptake. With short time step automatic collect of data, capacitance sensors (Envirosmart from Semtek) gave information about the wetted zone around the subsurface drip tape during an irrigation. It showed that water transfer was limited vertically (< 50 cm) as well as laterally (< 40 cm) for water application depth of around 70% of water demand.
Corn yields were satisfactory in conventional tillage plots with subsurface drip irrigation surface. For drip lines buried at 35 cm beneath soil, the same corn yield of around 15 t/ha was achieved in SDI 160 (subsurface drip irrigation with a distance between drip line of 160 cm) and in SDI 120 plots (distance between drip tapes 120 cm). This yield was higher than that of Sprinkler Irrigation plot (12,7 t/ha).
There was no significant difference between the yields of both SDI treatments. Due to the rainy spring, these results have to be confirmed next year (in 2009).
In SDI treatments, water savings was obtained due to soil evaporation decrease; evaluation on water savings based on modelling are in progress and will be validated during the next cropping season. Corn crop had an efficient utilisation of soil water reserve up to a depth of about 120 cm; this observation was coherent with root profile descriptions.
The results on Direct Seeding plots should be only considered as preliminary ones, because of soil disturbance provoked by subsurface drip line installation (at a depth of 20 cm) and as a consequence the growth of weeds. However data collection and analysis pointed out a satisfactory soil water transfer and crop water uptake around subsurface drip tape in parallel with a lower utilization of soil water reserve below a depth of 50 cm as observed in previous experiment. Observations will pay more attention on the effect of fertilizer placement in the soil by drip irrigation during next cropping season and on water saving.
As resumed above a series of provisional results obtained during this first experimental campaign, will be examined to be completed and validated in 2009.
However the present results enlightened that the use of drip tape subsurface irrigation is feasible e.g. for corn and other seed production. More studies to test the feasibility of this technique for different crops are needed as well as an economic evaluation based on life duration of subsurface drip tape equipment.
An information session for farmer on some new trends in agriculture will take place at the Lavalette station (Cemagref of Montpellier) in June 2009 in collaboration with extension services. A presentation and a visit of the experimentations on subsurface Jain drip tape will be included in the program and organized with the representative of Jain Irrigation System Ltd in France.
CemOA
: archive
ouverte
d'Irstea