HAL Id: hal-03181555
https://hal.sorbonne-universite.fr/hal-03181555
Submitted on 25 Mar 2021
HAL is a multi-disciplinary open access
archive for the deposit and dissemination of
sci-entific research documents, whether they are
pub-lished or not. The documents may come from
teaching and research institutions in France or
abroad, or from public or private research centers.
L’archive ouverte pluridisciplinaire HAL, est
destinée au dépôt et à la diffusion de documents
scientifiques de niveau recherche, publiés ou non,
émanant des établissements d’enseignement et de
recherche français ou étrangers, des laboratoires
publics ou privés.
hollows on Mercury: Implications for origin and
formation process
Océane Barraud, A. Doressoundiram, S. Besse, J. Sunshine
To cite this version:
Océane Barraud, A. Doressoundiram, S. Besse, J. Sunshine. Near-ultraviolet to near-infrared spectral
properties of hollows on Mercury: Implications for origin and formation process. Journal of
Geophys-ical Research. Planets, Wiley-Blackwell, 2020, 125 (12), �10.1029/2020JE006497�. �hal-03181555�
Near-ultraviolet to near-infrared spectral properties of
1
hollows on Mercury: Implications for origin and
2
formation process
3
O. Barraud1, A. Doressoundiram1, S. Besse2and J. M. Sunshine3
4
1LESIA, Observatoire de Paris, Universit´e PSL, CNRS, Sorbonne Universit´e, Universit´e de Paris, 92195 5
Meudon, France
6
2European Space Astronomy Centre, Camino Bajo del Castillo s/n, 28692 Villanueva de la Canada, 7
Madrid, Spain
8
3Department of Astronomy, University of Maryland, College Park, MD 20742-2421, USA 9
Key Points:
10
• Hollows have unique spectral properties in the near-ultraviolet. 11
• The reflectance spectra of hollows have a pronounced curvature between 300 and 12
600 nm.
13
• Eminescu impact crater hollows are seen to grow via scarp retreat. 14
Abstract
15
[Among the geological features revealed by the MESSENGER (MErcury Surface, Space
16
ENvironment, GEochemistry and Ranging) mission on the surface of Mercury, hollows
17
are the most surprising and least understood. Possibly related to volatile components,
18
hollows are small depressions, surrounded by bright halos and are not observed on any
19
other surfaces in our Solar System. Previous analysis of multi-spectral data obtained by
20
Mercury Dual Imaging System (MDIS) has shown that some hollows have weak
spec-21
tral absorption features centered at around 600 nm. In this work, we analyzed four
hol-22
lows with observations acquired by the Mercury Atmospheric and Surface Composition
23
Spectrometer (MASCS) on board MESSENGER with more than 230 spectral channels
24
from the near-ultraviolet to the near-infrared. Unlike previous MDIS multispectral data,
25
the MASCS reflectance spectra exhibit no absorption features in the MDIS wavelength
26
range. However, we found that hollows have unique spectral properties in the near-ultraviolet,
27
with a spectral curvature between 300 and 600 nm that is distinctly different from other
28
geological units. Moreover, we used MASCS observations with the best available
spa-29
tial resolution (less than 0.5 km/pixel) to analyze both parts of a hollow: the flat floor
30
and the surrounding halo. Our results support the hypothesis that hollows form by a
sub-31
limation process and scarp retreat.]
32
Plain Language Summary
33
[The MESSENGER (MErcury Surface, Space ENvironment, GEochemistry and
Rang-34
ing) mission highlighted several geological terrains on Mercury’s surface. Among the
un-35
expected discoveries are small bright depressions, named hollows. Often found within
36
impact craters, hollows have irregular shapes, flat floors and are surrounded by bright
37
halos. Hollows are still poorly understood and their formation remains a mystery for the
38
scientific community. Using observations made by the spectrometer on board the
MES-39
SENGER probe, we show for the first time that the spectra of hollows exhibit unique
40
reflectance properties at near-ultraviolet to visible wavelengths, which spectrally
distin-41
guishes them from other geological terrains. Moreover, the most detailed observations
42
show that their flat floors have different spectral characteristics from the bright halos.
43
Our results provide new knowledge about their formation, nature and differences from
44
other geological terrains and is consistent with them forming from sublimation processes.]
1 Introduction
46
The MESSENGER (MErcury Surface, Space ENvironment, GEochemistry and
Rang-47
ing; Solomon et al., 2007) missions highlighted the complex geological history of
Mer-48
cury’s crust (Denevi et al., 2009). Multi-spectral images returned by the Mercury Dual
49
Imaging System (MDIS, Hawkins et al., 2007) and spectral observations obtained with
50
the Mercury Atmospheric and Surface Composition Spectrometer (MASCS, McClintock
51
& Lankton, 2007) show that Mercury’s surface has steeper spectral slopes and lower
re-52
flectance than the Moon (Robinson et al., 2008; McClintock et al., 2008; Denevi et al.,
53
2009). Mercury’s reflectance spectra exhibit a red spectral slope (i.e the reflectance
in-54
creases with increasing wavelength) without silicates absorption features (Robinson et
55
al., 2008; Izenberg et al., 2014). Although the spectral signatures are few, the surface
56
of Mercury is spectrally and morphologically diverse. Based on spectral variation and
57
morphology, two main terrain types and several smaller units have been identified at the
58
surface of Mercury (Robinson et al., 2008; Denevi et al., 2009; Izenberg et al., 2014).
59
Low Reflectance Materials (LRM) covers approximately 15 % of the planet’s
sur-60
face. They are among the darkest features on Mercury with an absolute reflectance 30
61
% below the average surface (Robinson et al., 2008). LRM have a shallower spectral slope
62
than Mercury’s mean spectrum. They have diffuse margins and are generally associated
63
with impact structures, suggesting that this material has been excavated by impact
cra-64
tering. The smooth plains represent 27 % of Mercury’s surface (Denevi et al., 2013). They
65
exhibit a large range of spectral properties: from high-reflectance red plains to low-reflectance
66
”blue” plains (blue corresponding to a less steep spectral slope than the average surface,
67
but still with an increasing reflectance with increasing wavelength) (Denevi et al., 2009,
68
2013). Smooth plains on Mercury could result from effusive volcanism, impact melting
69
or basin ejecta (Denevi et al., 2009, 2013). The majority of them share the spectral
prop-70
erties of the Northern Smooth Plains (NSP), the more largest (occupying 7% of the
Mer-71
cury’s surface) and continuous area of smooth plains on Mercury (Denevi et al., 2013;
72
Byrne et al., 2018).
73
Besides LRM and smooth plains, which are considered as large units, there are also
74
small units that can be darkest features or high reflectance material. Dark spots are
sub-75
categories of LRM (Xiao et al., 2013), with diffuse edges but covering smaller areas (less
76
than 100 km2 by dark spot) than LRM (often larger than 106km2). They have
spec-77
tral slopes similar to the LRM but a lower reflectance (Xiao et al., 2013). Another
spec-78
tral units are faculae which appear brighter and redder than the Mercury’s average
sur-79
face. Most of faculae are accepted to be pyroclastic deposits emplaced by explosive
erup-80
tion. Brighter than faculae, small depressions named hollows have a reflectance
approx-81
imately twice the average reflectance of Mercury (Blewett et al., 2013). Hollows-like
for-82
mations have never been observed on other airless silicate bodies, which makes them an
83
interesting case study.
84
Hollows are irregularly shaped, shallow, with flat floors. Their edges are usually
85
diffused and brighter. They most often form near or directly within impact craters (Blewett
86
et al., 2011, 2013). Some appear on crater rims, others around central peaks/rings and
87
sometimes even in ejecta (Blewett et al., 2011, 2013). They have been often associated
88
with LRM, Low-reflectance Blue Plains (LBP) or dark spots (Blewett et al., 2013; Xiao
89
et al., 2013; Thomas et al., 2014a). The formation mechanism of hollows is widely
dis-90
cussed in literature (Blewett et al., 2013, 2018), and the loss of a volatile component is
91
the most commonly proposed process. The arguments favoring volatile loss are i) the
im-92
portant abundance of volatile species in Mercury’s crust as measured by X-Ray spectroscopy
93
(Nittler et al., 2011), and ii) the preferable distribution of hollows on Sun-facing-slopes
94
(Blewett et al., 2011, 2013; Thomas et al., 2014a). Blewett et al. (2013) proposed a
for-95
mation scenario based on a vertical growth by loss of a volatile compound to a certain
96
depth, and then an extension of the hollows by scarp-retreat.
Due to the high abundance of sulfur in the sub-surface of Mercury (Nittler et al.,
98
2011), CaS and MgS are commonly proposed as the volatile species (Blewett et al., 2011,
99
2013; Vilas et al., 2016; Lucchetti et al., 2018). This hypothesis is supported by the high
100
concentration of exospheric calcium (Bennett et al., 2016) above the Tyagaraja impact
101
crater in which there is a large field of hollows (Blewett et al., 2011). Vilas et al. (2016)
102
studied in detail the Dominici and Hopper crater hollows and showed a possible
absorp-103
tion band centered around 630 nm in MDIS multispectral observations. This feature was
104
also found in hollows from Canova and Velazquez impact craters (Lucchetti et al., 2018)
105
and Raditladi Basin (Thomas et al., 2016). The absorption feature is often attributed
106
to sulfides-like CaS and/or MgS (Vilas et al., 2016) or a mixture of sulfides and
pyrox-107
enes (Lucchetti et al., 2018). Thomas et al. (2016) compared hollows spectral
proper-108
ties with material in which they form, using MDIS multi-spectral images and the
vis-109
ible spectra of the Mercury Atmospheric and Surface Composition Spectrometer (MASCS).
110
Hollows parent material seems to have lost a component that is inherently has, or a
pro-111
cess that produced, a red spectral slope in the visible. This result is consistent with the
112
presence of sulfides like CaS or MgS as a volatile component (Helbert et al., 2013).
113
Because of their possible association with volatile species, hollows allow a better
114
understanding of the planet’s geochemical evolution. The most often used instrument
115
for spectral analysis of hollows is MDIS, due to its higher spatial resolution than that
116
of the MASCS spectrometer. MASCS footprint sizes are often larger than the
dimen-117
sions of hollows. However, MASCS has a better spectral resolution and wider spectral
118
range than MDIS. MDIS-Wide Angle Camera (WAC) is a multispectral camera with 11
119
usable filters centered between 395 and 1040 nm and with an average spectral
resolu-120
tion around 60 nm (Hawkins et al., 2007), while MASCS spectrometer operates between
121
300 and 1450 nm with a spectral resolution around 5 nm (McClintock & Lankton, 2007).
122
The 5 hollow groups studied with more than 8 MDIS channels are those located in the
123
Hopper, Dominici (Vilas et al., 2016; Lucchetti et al., 2018), Canova, Velazquez (Lucchetti
124
et al., 2018) and Raditladi (Thomas et al., 2016) impact craters. Thomas et al. (2016)
125
studied 9 additional groups using only 2 MDIS channels at about 433 and 749 nm. Some
126
studies (Thomas et al., 2016; Izenberg et al., 2015) used the visible part of the MASCS
127
spectra in the hollows of the Eminescu, Raditladi, Bacho and Tyagaraja impact craters,
128
but the spatial resolution of the observations used was not always sufficient to resolve
129
the hollows. The comparison between the hollows and the surrounding terrain, mainly
130
LRM (Thomas et al., 2016) and Facula (Izenberg et al., 2015), were made using reflectance
131
ratios of 2 channels of MASCS or MDIS.
132
In this work, we used MASCS spectra at the best spatial resolution available (less
133
than 0.5 km/footprint) to improve the spectral resolution and the wavelength range
com-134
pared to previous studies of hollows (Vilas et al., 2016; Thomas et al., 2016; Lucchetti
135
et al., 2018). We found 4 large fields of hollows spatially resolved with MASCS
obser-136
vations located in the Tyagaraja, Hopper, Warhol and Eminescu impact craters. The
137
main objective of this study is to improve our understanding of the spectral
character-138
istics of hollows. In particular, we will characterize the hollows in the near-ultraviolet
139
through near-infrared, using parameters derived from full spectral coverage. In addition,
140
we will examine the MASCS spectra for absorptions such as those observed in MDIS
fil-141
ters (Vilas et al., 2016; Lucchetti et al., 2018), directly comparing the MASCS and MDIS
142
observations in the Hopper crater.
143
2 Datasets and Method
144
The data used in this work are obtained from the final delivery of products at the
145
Planetary Data System (PDS) and have the best calibration (photometric and
radiomet-146
ric) performed by the MESSENGER team (Izenberg & Holsclaw, 2017).
2.1 Selection and correction of the spectra
148
MASCS Visible and InfraRed Spectrometer (VIRS) is composed of two detectors:
149
a visible (VIS) detector operating between 300 and 1050 nm and a near-infrared (NIR)
150
detector sensitive to wavelengths between 900 and 1450 nm. The NIR detector is more
151
dependent on the orbital, seasonal and instrumental temperature variations (Izenberg
152
et al., 2014). Consequently, the signal-to-noise ratio varies substantially between VIS and
153
NIR detector, which complicates analysis (Izenberg et al., 2014).
154
Therefore, we selected the spectra measured in the two lowest temperature regimes
155
of the instrument (≤ 25◦C), except for 2 orbits located in Tyagaraja (see section 2.3)
156
where low temperature data are not available. We selected these ranges of temperature
157
because the reference spectrum (Izenberg et al., 2014) used in this analysis (see section
158
2.2) is based on spectra obtained at temperatures lower than 30◦C. Also, we selected a
159
grating temperature under 40◦C, because if we selected less than 25◦C, 78 % of data
cor-160
responding to the hollows would be removed.
161
Additional processing is applied to the data using the method developed by Besse
162
et al. (2015). This approach, based on 3 main steps (as described below) allows the merger
163
of the VIS and NIR data in a combined spectrum. The first step consists to remove the
164
outliers deviating by more than 2 sigma from the mean. Only the most distant outliers
165
are removed using this method, which represents less than 1% of the measurements by
166
the VIS detector and less than 4% in the NIR. In a second step, a moving average
win-167
dow of three points is applied to the entire VIS and NIR to smooth the data.
Smooth-168
ing implies a loss of information on the signal without consequences on the analysis
per-169
formed in this study. Finally, an offset is applied to the NIR to combine the two parts
170
of the spectrum (Besse et al., 2015). The approach tested on lunar spectra by Besse et
171
al. (2015), has been validated for observations of Mercury’s surface. Moreover, this method
172
allows the scatter of the channel-to-channel reflectance to be reduced, especially in the
173
NIR domain. Besse et al. (2015) and Besse et al. (2020) demonstrated that the NIR
chan-174
nel could be analyzed with reasonable confidence in the study of pyroclastic deposits.
175
2.2 Spectral analysis
176
Our analysis is focused on spectral parameters encompassing the entire spectral
177
range of MASCS from the near-ultraviolet to the near-infrared.
178
• In the near-ultraviolet (UV), the UV-downturn described by Goudge et al. (2014), 179
which characterizes the drop of the reflectance shortward of 350 nm, is calculated.
180
This parameter gives the offset between measured reflectance and the expected
181
reflectance at 3 wavelengths (300, 325 and 350 nm) if the reflectance had the same
182
slope in the UV and in the visible. The mathematical definition of the UV-Downturn
183
is (Goudge et al., 2014):
184
U V − downturn = Depth300+ Depth325+ Depth350
185 where, 186 Depth300= (R(401)− (401 − 303)SV IS)/R(303) 187 Depth325= (R(401)− (401 − 324)SV IS)/R(324) 188 Depth350= (R(401)− (401 − 350)SV IS)/R(350) 189 and, 190 SV IS= R(750)−R(445) 750−445 191
where R(λ) is the reflectance at the wavelength λ given in nanometers.
192
• In the visible, the absolute reflectance at 750 nm (R750), which is an average value 193
of three points due to the smoothing of the data (see section 2.1), is used.
• For the characterization of the spectral slope, we calculate the visible (VIS) slope 195
as defined in Besse et al. (2015) between 445 and 750 nm. We extended the range
196
of wavelength to the NIR domain (1400 nm) to define the visible to near infrared
197
(VISNIR) slope. The slopes are determined by a linear fit:
198
Ref lectance = aλ + b (a=slope)
199
where 445 nm ≤ λ ≤ 750 nm for the VIS-slope and 445 nm ≤ λ ≤ 1400 nm for
200
the VISNIR-slope.
201
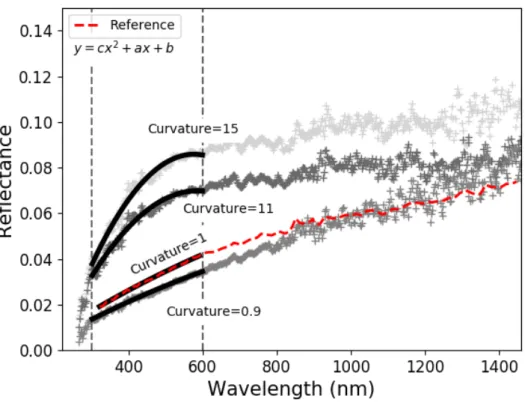
• After a visual inspection of the spectra, a parameter named Curvature was defined. 202
The Curvature is calculated before 600 nm, that is the point at which the
spec-203
trum changes from UV curvature to near-infrared slope (arbitrarily by visible
in-204
spection). This parameter is represented by the coefficient of the squared power
205
of the polynomial fit (degree 2) of the spectrum between 300 and 600 nm:
206
Ref lectance = cλ2+ aλ + b (c=curvature)
207
Random examples are shown in Figure 1.
208
The slopes and the Curvature parameter are normalized to the reference spectrum
209
provided by Izenberg et al. (2014) who computed it from the average of 850,000
spec-210
tra of Mercury’s surface. By definition, slopes and Curvature are equal to 1 for the
av-211
erage surface of Mercury. The UV-downturn parameter previously estimated to 3.0 for
212
Mercury’s background, using Izenberg et al. (2014) reference spectra, was re-evaluated
213
as 3.1 by Besse et al. (2020).
Figure 1. Example of calculated Curvature on MASCS spectra, and on Mercury’s reference spectrum (Izenberg et al., 2014). The black curve represents the polynomial fit (degree 2) of the spectrum between 300 and 600 nm. The Curvature parameter corresponds to the variable c in the equation of the polynomial curve. Furthermore, the Curvature coefficient is normalized to the reference spectra (red, Izenberg et al., 2014) such that the Curvature of the reference spectrum is equal to 1. The spectra with the highest reflectance were randomly selected in Eminescu’s hollows (ob4 14327 010045 and ob4 14326 164731, see section 2.3). The spectrum with the lowest reflectance was randomly selected in the Northern smooth plains (ob2 12187 063041, see section 2.4).
2.3 Hollows observations with MASCS
215
MDIS instrument acquired a global and uniform coverage in 8 of its 11 colour
fil-216
ters of more than 90% of the planetary surface during the orbital phase (Domingue et
217
al., 2017). On the other hand, the MASCS instrument is a point spectrometer and thus
218
only observed discrete areas. Dimensions of MASCS footprints vary between 0.1x3km
219
to over 6x7km (Izenberg et al., 2014). Hollows are small depressions, which range in size
220
between several tens of meters to several kilometers (Blewett et al., 2018), hence, they
221
are less likely to be observed with MASCS.
222
Using the list defined by Thomas et al. (2014a), we found four hollows observed
223
with sufficient spatial resolution by MASCS. They span a large range of longitudes, but
224
a restricted range of latitudes (15◦N to 15◦S). Observable hollows are located in the
Tya-225
garaja, Hopper, Eminescu, and Warhol impact crater floors, as shown in Figure 2.
226
High-resolution images produced by the Narrow Angle Camera (NAC) of the MDIS
227
instrument are used for selecting MASCS footprints. Footprints are represented by an
Figure 2. Hollows analyzed in this work. a) Tyagaraja impact crater (3.89◦N, 211.10◦W; from Wide Angle Camera (WAC)-MDIS image EW1009232948G, 383 m/pixel). b) Zoom on the north-east hollows in Tyagaraja crater (from Narrow Angle Camera (NAC)-MDIS image EN0242713071M, 130 m/pixel). c) Hopper impact crater (12.44◦S, 304.40◦W; EN1048482439M, 110 m/pixel). d) Zoom on hollows in Hopper crater (EN0223616383M, 49 m/pixel). e) Eminescu impact crater (10.66◦N, 245.79◦W; EW0234069376G, 476 m/pixel). f) North-north-east part of the central peak in Eminescu impact crater (EN0251632156M, 35 m/pixel). g) Warhol im-pact crater (2.55◦S, 6.27◦W; MDIS RTM N01 009974 5942839 1, 92 m/pixel). h) North part of Warhol impact crater (EN1034982894M and EN1035068908M, 56 m/pixel).
ellipse on the NAC images and are selected manually. Figure 3 shows footprints used in
229
this study. For each site, at least one footprint located in the host impact crater floor
230
is selected. The spatial resolution of MASCS in the Tyagaraja, Hopper and Warhol
im-231
pact craters allows the analysis of the properties of the hollows group (Figure 3). In the
232
case of Eminescu, a particular hollow can be analyzed. Moreover, the footprint size in
233
Eminescu is sufficient to distinguish the hollow floor from the surrounding halo.
234
As for the Hopper impact crater, data of two orbits are used. For the largest
foot-235
prints, the spatial resolution of MASCS is too large (around 10 km/footprint) to include
236
only material from the hollows (Figure 3). Consequently, the spectra obtained from these
237
footprints are thought to be representative of a mixing between hollows and crater floor
238
material. By superimposing each footprint on the NAC image, we are able to estimate
239
the proportion of hollows field contained in the ellipse with uncertainty of +/- 5 %.
Figure 3. Representation of MASCS footprints used in this study. a) Hopper impact crater floor (ICF) hollows and footprints from 2 orbits (ob2 12268 133540, ob3 13276 093728) with a spatial resolution between 0.6 to 10 km/footprint. The red rectangle shows the area sam-pled by Vilas et al. (2016). b) Tyagaraja hollow’s field, the first orbit (ob4 14128 101058, 0.7 to 2 km/footprint) is used for hollows and impact crater floor (ICF) and the second one (or-ange: orb 11346 182504, 2.5 to 3.6 km/footprint) is used for Tyagaraja facula. c) Warhol impact crater, the orbit used is ob4 15064 011135 (around 2.5 km/footprint). d) Eminescu impact crater central peak (north-west part), the two orbits used are very similar (ob4 14327 010045, ob4 14326 164731) and are obtained one day apart. The spatial resolution varies between 0.3 to 1.7 km/footprint. The NAC images used are the same as in the previous figure. The number in the legends give the number of MASCS observations for each hollows, Impact crater floor (ICF) and facula in Tyagaraja.
2.4 Observations of other geological units
241
Hollows are among the brightest features at the surface of Mercury. In order to
un-242
derstand their spectral characteristics in the near-ultraviolet to near-infrared wavelength,
243
we compare them with MASCS observations of other geological units. Several terrains
244
around the Mercury’s surface are used: Dark spots (DS), Low reflectance material (LRM),
245
faculae and Northern Smooth Plains (NSP).
DS and LRM materials are thought to be potential parent material to hollows (Xiao
247
et al., 2013; Thomas et al., 2016). Due to the elliptical orbit of MESSENGER and their
248
small size, the DS which are resolvable with MASCS are located only in the northern
249
hemisphere at latitudes higher than 20◦N (Figure 4 and Table S1 in the Supporting
in-250
formation) (Xiao et al., 2013). LRM are more extended units, several observed by MASCS
251
were found at latitudes similar to hollows analyzed in this study (Figure 4 and Table S2).
252
Figure 4. Global distribution of hollows (blue dots) analyzed in this work, relative to other geological units. Low reflectance material, northern smooth plains and faculae areas selected are similar to the size of the dots. The background is a MDIS color global mosaic (3-filters) red: 1000 nm, green: 750 nm, and blue: 430 nm (665 m/pixel; Denevi et al., 2018).
Hollows are often found nearby faculae, as in the Tyagaraja impact crater (Blewett
253
et al., 2011). The volatile species causing volcanic eruptions could be a source of volatile
254
material for the formation of hollows as well (Blewett et al., 2011, 2013; Thomas et al.,
255
2014a). To investigate their possible relationship, we compare the spectral properties of
256
hollows and faculae. We selected MASCS observations in the facula of the Tyagaraja
im-257
pact crater (Figure 3). Moreover, spectral properties of faculae were studied by Goudge
258
et al. (2014) and Besse et al. (2015) using the MASCS spectrometer. Besse et al. (2020)
259
determined the diameter of 14 faculae, and 12 of them (Figure 4 and Table S3) have
in-260
strumental conditions (i.e. temperatures, see section 2.1) similar to those determined
suit-261
able in this analysis, and are thus used for comparison to hollows.
262
Northern smooth plains (NSP) occupy more than 7% of Mercury’s surface (Byrne
263
et al., 2018) and are, similarly to faculae, a consequence of volcanic activity. We have
264
selected 3 regions with a large number of MASCS footprints passing through NSP
re-265
gions (Figure 4 and Table S4).
266
Table 1 lists the number of observations used in each unit and illustrates the
dif-267
ficulty in finding MASCS footprints in smaller units like hollows and DS. Although we
268
selected regions in LRM and NSP with the least surface feature heterogeneity (impact
craters, ejecta, rays, possible hollows and dark spots that can modify spectral
proper-270
ties), we eliminated spectra which deviate more than 3 sigma from the median.
271
Table 1. Number of MASCS observations selected per geological unit.
Geological unit Description Number of observations Low Reflectance
Material
Dark material excavated by impact cratering and poten-tially parent material of hollows (Thomas et al., 2016).
1115
Northern Smooth Plains
Largest continuous plains resulting of effusive volcanism (Denevi et al., 2013; Byrne et al., 2018).
1352
Faculae Pyroclastic deposits formed through explosive volcanic processes. (Kerber et al., 2009, 2011)
1377
Dark spots Sub-category of LRM at smaller scale. Hollows commonly occupy the centers of the observed dark spots (Xiao et al., 2013).
6
Hollows (4) Irregularly shaped depressions, shallow, with flat floor and surrounded by bright halo (Blewett et al., 2018).
3 Spectral properties of hollows from near-ultraviolet to near-infrared
272
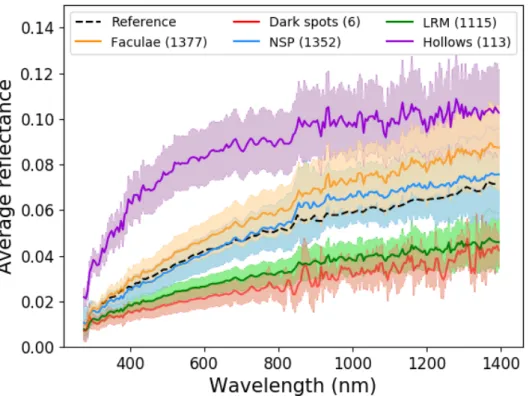
Before starting the analysis with the spectral parameters, the average spectrum of
273
each geological unit is derived from the corrected spectra (see section 2.1). The mean
274
spectrum of hollows differs from others by its unique shape in the near-ultraviolet and
275
a higher reflectance while the others average spectra overlap across the entire spectral
276
range of MASCS (Figure 5).
277
Figure 5. Average reflectance spectrum of each geological unit described in section 2.3 and 2.4. LRM: Low Reflectance Material, NSP: Northern Smooth Plains. The shaded regions are er-ror bars, which correspond to the standard deviation of the spectra around the mean. Reference is the average spectrum of Mercury’s surface (Izenberg et al., 2014).
3.1 Visible to near-infrared properties
278
The MASCS reflectance at 750 nm is approximately twice as high for the hollows
279
than Mercury’s mean spectrum (Figure 5 and 6). While the faculae are also bright
fea-280
tures on the surface of Mercury (Kerber et al., 2009), they have a significant lower
re-281
flectance than the hollows at all wavelengths (Figure 5). These results are consistent with
282
those obtained from MDIS observations, which show that the hollows are among the
bright-283
est geological units on the surface of Mercury (Blewett et al., 2011, 2013).
284
All geological features observed with MASCS in this study have positive spectral
285
slopes (reflectance increases toward longer wavelengths). VIS-slope of hollows ranges from
286
0.38 to 1.45 (Figure 6).
287
Figure 6. VIS-slope parameter versus R750 parameter in hollows and in various geological units: Low Reflectance Material (LRM), faculae, Northern Smooth Plains (NSP), dark spots and Impact Crater Floor (ICF). Black dashed lines show reflectance at 750 nm and value of the VIS-slope parameter for the average surface of Mercury. In general, the hollows are brighter than other units on Mercury.
MDIS spectral analysis showed that the hollows are less red than the Mercury’s
288
mean surface (Blewett et al., 2013; Thomas et al., 2016), i.e. a VIS-slope parameter lower
289
than 1. However, those results were obtained using only two spectral channels (433 and
290
749 nm). Thomas et al. (2016) estimated the visible slope by dividing images at 430 nm
291
by images at 750 nm for MDIS and/or calculating the ratio of reflectance at 445nm/750nm
292
in MASCS data. In our study, the parameter VIS-slope is derived from the best fit line
293
between 445 and 750 nm, that is from around 60 data points. Therefore this
parame-294
ter is more sensitive to the overall shape of the spectra compared to a ratio using 2 bands.
295
The curvature of the hollows’ mean spectrum at the shortest wavelengths (Figure 5) could
296
explain why the VIS-slope is higher than 1 for many of the hollows.
297
At longer wavelengths, the hollows mean spectrum is flatter than that of the mean
298
spectra of other geological units (Figure 5). The VISNIR-slope parameter allows the study
299
of the effect of the near-infrared wavelengths. The hollows spectra have a VISNIR-slope
lower than their VIS-slope (Figure 7). In fact, 76% of the normalized spectral slopes in
301
the VIS to NIR are lower than 1, while only 30% are in the visible. For the other
geo-302
logical units, the difference between VIS-slope and VISNIR-slope is not as significant
(Fig-303
ure 6 and 7), suggesting that the hollows spectra are flatter in the NIR than the
spec-304
tra of the other units.
305
Figure 7. VISNIR-slope parameter versus R750 parameter in hollows and various geological units: Low Reflectance Material (LRM), faculae, Northern Smooth Plains (NSP), dark spots and Impact Crater Floor (ICF). Black dashed lines show reflectance at 750 nm and value of the VISNIR-slope parameter for the average surface of Mercury. In general, hollows have a visible to near-infrared slope less steep than the Mercury’s mean spectrum (Izenberg et al., 2014).
Space weathering affects the reflectance spectra by increasing the spectral slope in
306
the visible-near-infrared due to the presence of submicroscopic iron (smFe) (McCord &
307
Adams, 1972a; McCord & Adams, 1972b; Fischer & Pieters, 1994; Domingue et al., 2014).
308
Hollows are thought to be among the most recent geological units on the surface of
Mer-309
cury (Blewett et al., 2018). Their reduced spectral slope in the VISNIR could be a
con-310
sequence of their relatively young age.
311
Although the spectral parameters in the visible (VIS-slope, VISNIR-slope and R750)
312
allow assumptions to be made about the hollows, they overlap with those of other
ge-313
ological units. Thus at visible wavelengths, no spectral parameters used in this paper
314
allow the hollows to be uniquely characterised.
3.2 Near-ultraviolet properties and spectral curvature as diagnostic of
316
hollows
317
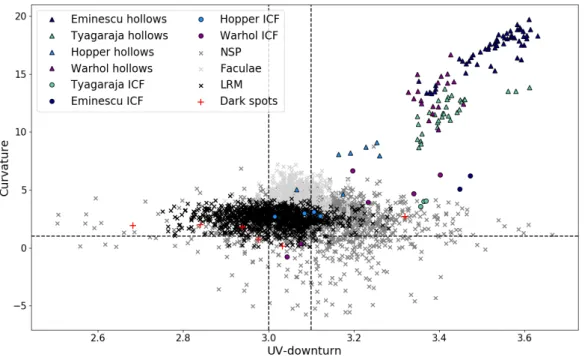
The MASCS reflectance spectra of hollows reveal the highest UV downturn and
318
curvature at wavelengths shortward of 600 nm. The strength of the downturn and the
319
curvature differs among the hollows and are linearly correlated (Pearson coefficient
cor-320
relation of 0.88 with a significance level of 99.9%). For the other geological units, no
cor-321
relation was found between the two parameters. This result implies a process or
mate-322
rial influencing the two spectral parameters in the hollows that would not be found in
323
other geological units. Several factors could potentially influence the downturn of the
324
reflectance in the ultraviolet, we mention three hypotheses here: 1) the space
weather-325
ing, 2) the grain size of the material forming the hollows and 3) the presence of sulfides.
326
As mention on the previous section, space weathering increases the spectral slope
327
in the VISNIR, resulting in a reddening of the spectrum. (Domingue et al., 2014). In
328
the near-ultraviolet, it will start to decrease the slope (bluing), especially between 300
329
and 400 nm (Hendrix & Vilas, 2006; Vilas & Hendrix, 2015). This change of the slope
330
in the near-ultraviolet has been interpreted by Hendrix and Vilas (2006) as the result
331
of the formation of nanophase iron coatings on mineral grains. The hypothesis of space
332
weathering could explain the slopes of the hollows spectra in the near-ultraviolet and
visible-333
near-infrared. Research on the effects (Hendrix & Vilas, 2006; Vilas & Hendrix, 2015)
334
of space weathering on reflectance spectra does not indicate a curvature of the spectrum
335
between 300 and 600 nm, making the idea of space weathering, in the absence of other
336
possible factors, less likely.
337
Another possible contributor to the high UV-downturn in the hollows is a
differ-338
ence in grain size between hollows and other geological units. Laboratory studies have
339
shown that as the grain-size decreases, the UV-downturn increases for common
plane-340
tary minerals (Cloutis et al., 2008). If the particle size is the only one contributing
fac-341
tor to the high downturn of the hollows, then the hollows have finer grain size than the
342
other geological units studied here. Phase ratio analysis suggests that hollows around
343
the central peak of Eminescu crater have finer particle sizes than the surrounding crater
344
floor (Blewett et al., 2014). A second phase ratio analysis confirms on a sample of eight
345
sites that hollows have finer grain size than their adjacent terrains (Thomas et al., 2016).
346
However, hollows often have UV-downturn close to that of their host crater floor, which
347
is particularly the case for Eminescu (Figure 8). Consequently, grain size does not
ap-348
pear to be the only one factor influencing this spectral parameter. In addition, no
stud-349
ies have shown that particle size has an impact on the curvature of the spectrum between
350
300 and 600 nm, making this idea unlikely.
351
An alternative possibility to the specific properties of hollows in the UV is a
spe-352
cific composition. Sulfides are the most commonly cited candidates for the volatile species
353
at the origin of the hollows (Blewett et al., 2011, 2013; Vilas et al., 2016; Lucchetti et
354
al., 2018; Helbert et al., 2013). Laboratory measurements carried out under the
condi-355
tions of MASCS observations show that the spectra of fresh CaS, NaS and MgS (2
sam-356
ples) have a strong absorption band between 280 and 350 nm, centered at 300 nm (Varatharajan
357
et al., 2019). The Mercury daytime temperatures have different implications on the
spec-358
tral features of these samples (Varatharajan et al., 2019). For one of the MgS sample,
359
the absorption features disappear after the thermal processing at Mercury’s surface
tem-360
peratures. The spectral contrast of the absorption features around 300 nm is slightly
sub-361
dued for the heated CaS and the second heated MgS sample while the heated NaS shows
362
stronger UV spectral features (Varatharajan et al., 2019). In consequence, the spectral
363
features of CaS, MgS and NaS, even under the temperature conditions of Mercury, may
364
involve the high UV downturn of the hollows. The curvature of laboratory spectra of
Mer-365
cury analogs has not been studied, however it would be interesting to compare the
Cur-366
vature of spectra measured in the laboratory on materials possibly representative of
hol-367
lows with our values in order to determine if this curvature can be related to the
ence of sulfides or any other minerals. For example, we calculated the reflectance
cur-369
vature for one of the MgS sample presented by Varatharajan et al. (2019) and obtained
370
a value of 22, slightly higher than our hollow values.
371
Figure 8. Curvature versus UV-downturn for hollows and the various geological units: Low Reflectance Material (LRM), faculae, Northern Smooth Plains (NSP), dark spots and Impact Crater Floor (ICF). Black dashed lines show the values of these parameters for the mean spec-trum of Mercury. The UV-downturn estimated at 3.0 for the average surface was re-evaluated at 3.1 (Besse et al., 2020). The hollows stand out slightly by UV-downturn parameter and largely by Curvature parameter.
3.3 Influence of abundance: The Case of Hopper Crater
372
The spatial resolution of the largest MASCS footprints inside Hopper is insufficient
373
to discriminate the hollows from the crater floors (Figure 3). However, these
observa-374
tions can be used to investigate the evolution of the spectral parameters with the
per-375
centage of hollows material in the MASCS footprint (Table 3). We found a linear increase
376
in the absolute reflectance at 750 nm with increasing the percentage of hollows in the
377
footprint area. The same result is observed with the visible slope (Table 3). The orbit
378
with the highest spatial resolution confirms this observation: the footprints covering 100
379
% of the hollows field show higher values of VIS-slope and R750 than the footprints which
380
did not contain the hollows field (Table 4). The evolution of these parameters is
inde-381
pendent of the observation conditions (viewing geometry, in particular emission angle,
382
and temperature).
383
The increasing VIS-slope with the increasing percentage of hollows in the footprint
384
is a surprising result. In fact, the hollows are described in literature as having a less steep
385
slope than the surrounding material (Blewett et al., 2013; Thomas et al., 2016).
How-386
ever, in our study, the calculation of the slope in the visible seems impacted by the shape
387
of the spectrum in the UV (see section 3.1). Although the Curvature is not linearly
cor-388
related with the percentage of hollows in the footprint, footprints containing 0% hollows
389
still have lowest Curvature values. Furthermore, footprints with 100% hollows have the
390
highest Curvature values (Table 3).
391
Table 2. Spectral parameters derived from the observations of the orbit with the largest foot-prints (ob2 12268 133540) in Hopper impact crater (Figure 3).
Area of hollows
in footprint (%) R750* VIS-slope** UV-downturn VISNIR-slope Curvature
0 0.038 0.70 3.08 0.64 3.00
25 0.048 0.77 3.06 0.64 5.04
45 0.049 0.86 3.17 0.72 4.64
80 0.064 0.89 3.19 0.66 8.20
95 0.066 0.95 3.26 0.70 7.97
*Pearson correlation coefficient between percentage of hollows in the footprint and R750: 0.99 (significance level: 99%) **Pearson correlation coefficient between percentage of hollows in the footprint and VIS-slope: 0.98 (significance level: 97%)
Table 3. Spectral parameters obtained from the observations of the orbit with the smallest footprints (ob3 13276 093728) in Hopper impact crater (Figure 3).
Area of hollows
in footprint (%) R750* VIS-slope** UV-downturn VISNIR-slope Curvature
0 0.038 0.72 3.01 0.72 2.72 0 0.037 0.70 3.11 0.65 3.09 0 0.037 0.68 3.12 0.59 2.75 100 0.069 0.99 3.16 0.64 8.07 100 0.069 1.01 3.23 0.63 8.72 100 0.073 1.06 3.25 0.73 9.09
*Pearson correlation coefficient between percentage of hollows in the footprint and R750: 0.99 (significance level: 99%) **Pearson correlation coefficient between percentage of hollows in the footprint and VIS-slope: 0.98 (significance level: 97%)
4 Investigation of absorption bands in hollows
392
Previous analysis of MASCS spectra did not identify any absorption features,
sug-393
gesting that Mercury’s surface is dominated by silicates with low ferrous iron content
394
(Izenberg et al., 2014). Thomas et al. (2016) did not find any absorptions in the MASCS
395
spectra obtained in the hollows of Eminescu and Raditladi. However, they found a weak
396
absorption band in the MDIS data for Raditladi centered around 600 nm, as observed
397
in the Dominici, Hopper, Canova and Velazquez impact craters by Vilas et al. (2016) and
398
Lucchetti et al. (2018). In this study, we performed a detailed analysis in order to
in-399
vestigate absorption features specific to hollows in the four studied samples.
400
4.1 Searching absorption bands with MASCS
401
A continuum removal has been applied to the MASCS spectra of hollows to
high-402
light the absorption bands observed with MDIS between 528 and 828 nm with a
max-403
imum depth of 4% (Vilas et al., 2016; Lucchetti et al., 2018) and towards 1000 nm (Lucchetti
404
et al., 2018). The shape of the MASCS spectra of hollows in the visible is not linear
(Fig-405
ure 5), thus the continuum is approximated by a polynomial fit of degree 2 between 400
406
and 828 nm, and a straight line between 828 and 1400 nm. Continuum removed
spec-407
tra are flat and lack absorption bands (Figure 9). The noise of the MASCS VIS
detec-408
tor is stable between 400 and 700 nm and seems to be related to the instrument. At longer
409
wavelengths, the noise increases and differs between observations. A strong signal
vari-410
ation occurs between 800 and 900 nm, and is not related to the junction of the spectra
411
obtained by the 2 detectors (Besse et al., 2015). This small jump in reflectance is reported
412
in spectra obtained in various units and is also observable on the Mercury’s reference
spec-413
tra obtained using more than 850 000 spectra (Izenberg et al., 2014). We interpreted this
414
variation in reflectance as a residual error in the calibration related to a change in the
415
response of the instrument in this wavelength range. As expected, in the NIR the
signal-416
to-noise ratio decreases and no conclusion can be made about the existence of a weak
417
absorption band towards 1000 nm.
418
The large phase angles of the MASCS data could be the source of the lack of
ab-419
sorption bands in the MASCS spectra. However, Varatharajan et al. (2019) has shown
Figure 9. a) MASCS spectra obtained in hollows (113). The two spectra close to the ref-erence spectrum are measured in Hopper impact crater and contain 25% and 45 % of hollows (cf. Table 2). b) Continuum removed hollows spectra. The thick vertical black line shows the junction of the two detectors of MASCS VIRS spectrometer. The two vertical dashed lines are the wavelengths used by Vilas et al. (2016) and Lucchetti et al. (2018) to define the absorption bands in MDIS filters. The horizontal dashed lines highlight a band depth of 4% as reported in Lucchetti et al. (2018). No absorptions above the noise are seen in these MASCS spectra.
that the phase angle has only minor effects on sulfides spectral features in the UV and
421
VIS. Residual calibration error is a possible factor explaining the differences between the
422
two instruments. For example, a calibration error could create an absorption band in MDIS
423
or remove one in the MASCS data. Another hypothesis to explain the lack of
absorp-424
tion features is a low content of pure sulfides in the MASCS footprints. In fact, Izenberg
425
et al. (2014) showed that at least 75% of pure sulfides are needed in the MASCS
field-426
of-view to be detectable in the spectra. The absorption band around 600 nm observed
427
in several hollows has a maximum depth of 4% (Vilas et al., 2016; Lucchetti et al., 2018),
428
if the concentration of pure sulfides is too low the band is within the noise of MASCS
429
spectra.
430
However, the absence of a band at 600 nm does not exclude the presence of
sul-431
fides. Helbert et al. (2013) showed that the thermal processing at Mercury daytime
tem-432
perature reduces the spectral contrast of the diagnostic features of sulfides around 600
433
nm. In addition, recent laboratory measurements under MASCS observing conditions
434
show that the sulfides (fresh or heated) proposed in section 3.2 (CaS, NaS and one MgS
435
sample) to explain the high values of UV-downturn in hollows spectra, do not exhibit
436
absorption bands in the visible range (Varatharajan et al., 2019).
437
4.2 MDIS and MASCS comparison of Hopper’s hollows
438
Intrinsic change in the composition of the hollows could explain why we do not
ob-439
serve an absorption band in the spectra obtained by MASCS. Vilas et al. (2016)
stud-440
ied the western part of the group of hollows in Hopper impact crater while MASCS looked
441
at the eastern one. In order to investigate possible spectral changes within Hopper, we
442
compared MDIS observations in the two parts of the hollows. Moreover, we compared
443
MDIS measurements with MASCS spectra directly. We used the Experiment data record
444
(EDR) of MDIS-WAC (Hawkins et al., 2007), and applied a radiometric and
photomet-445
ric calibration (Hapke, 1981; Domingue et al., 2015; Bott et al., 2019). Average reflectance
446
obtained in both areas (the original area studied by Vilas et al. (2016), and the area
served with MASCS) of the hollows is represented in Figure 10. The absorption feature
448
seems to be homogeneous in the hollows field from the MDIS observations, which excludes
449
the hypothesis of an intrinsic spectral variation. The lack of spectral features in the MASCS
450
spectra is then mostly likely linked to residual calibration errors in one of the two
instru-451
ments or a pure sulfides concentration too low to be detected with the MASCS
instru-452
ment (see section 4.1). Moreover, the absorption band observed by Vilas et al. (2016)
453
in Hopper is the weakest of the hollows they studied. MASCS observations in the
Do-454
minici crater, where the band is deeper, do not have sufficient spatial resolution.
455
Figure 10. a) WAC-MDIS image (EW0211022288D) of Hopper crater with the red rectangle marking the area sampled by Vilas et al. (2016) and orange rectangle marking region observed with MASCS (Figure 3). b) Normalised reflectance of the two areas as observed by MDIS, and one example of normalized MASCS spectra in the same region. The two black dashed lines bound the upper and lower wavelength limits of the absorption band identified by Lucchetti et al. (2018) and Vilas et al. (2016). The aspect ratio is different from Vilas et al. (2016) however the depth of the absorption band is similar.
5 Discussion
456
5.1 Origin of hollows volatile components
457
5.1.1 Are volatile components of hollows linked to pyroclastic deposits?
458
The geological history of the Tyagaraja crater seems to be complex given that the
459
crater floor is covered both by hollows and facula (Blewett et al., 2011). Unfortunately,
460
the spatial resolution of images is insufficient to distinguish if the surface of the bright
461
patches is fully covered by hollows material (Figure 3). Consequently, the spectral
vari-462
ability of Tyagaraja hollows could be due to different proportions of materials within the
463
instrument footprint area (e.g. hollows, crater floor, facula). Tyagaraja’s facula and crater
464
floor have similar values of UV-downturn (Figure 11b). The hollows tend toward high
465
UV downturns (Figure 11b). However, these units are clearly distinct in the Curvature
466
and the VISNIR-slope (Figure 11c and d). As expected, the spectral slope of facula is
467
redder than Mercury’s average, while the spectral slope of hollows is generally less red.
468
The Curvature parameter of hollows is much higher than the Curvature of the facula.
469
In section 3.1 and 3.2, we proposed several factors that can influence the spectral
470
properties. These contributors can also influence the spectral properties of the
pyroclas-471
tic deposits. If we considered the space weathering, resulting in a reddening of the
tral slope in the visible-near-infrared, as the only contributing factor for the VISNIR slope,
473
the chronological sequence of events would therefore be: 1) formation of the facula, 2)
474
crater formation and finally 3) the formation of the hollows. However, it is impossible
475
for the facula to be older than the crater in which it formed. A physical difference (e.g.
476
grain size) between each geological unit could play a role in the near-ultraviolet (Cloutis
477
et al., 2008). However, space weathering or grain size is not known to create a curvature
478
of the spectrum between 300 and 600 nm (see section 3.2). Compositional differences
be-479
tween each geological unit seem necessary to explain the different effects on the spectra.
480
Figure 11. a) MASCS spectra obtained in the Tyagaraja impact crater for three geological units: facula, hollows and impact crater floor. Each spectra correspond to a footprint shown in Figure 2. b, c and d) Spectral parameters versus R750 for the spectra shown in (a). Hollows and facula in the Tyagaraja impact crater have distinct spectral properties.
Blewett et al. (2011, 2013) proposed that volatile species could be trapped under
481
the pyroclastic deposits during the lava emplacement and after be at the origin of the
482
hollows formation. Hollows formed under these conditions could have different
proper-483
ties than hollows formed on LRM or impact melt, for example, because the origin and/or
484
nature of the volatile component could be different. However, in our study, the Tyagaraja
485
hollows do not have spectral properties that are different from other hollows. In
partic-486
ular, they have spectral properties close to those of Warhol hollows (Figures 6, 7 and 8),
487
yet no faculae are identified in Warhol impact crater. Thus, the volatile compound
re-488
sponsible for the formation of Tyagaraja’s hollows is probably similar to the others. This
489
result suggests two hypotheses:
1. The material forming hollows has a close composition to volatile material that can
491
be condensed or trapped after/during an explosive eruption on Mercury. Nittler
492
et al. (2014) showed that the largest pyroclastic deposit on Mercury is depleted
493
in S and C compared to their surroundings. These elements could be the volatile
494
species driving the explosive eruptions on Mercury (Blewett et al., 2018) and also
495
responsible for the formation of hollows.
496
2. The parent material of the hollows would be the crater floor, even if it is covered
497
by faculae. In this case, the heat of the pyroclastic deposit on the impact crater
498
floor could be responsible for the formation of the hollows, which could explain
499
why hollows are often found near faculae. This hypothesis is supported by the
dif-500
ferences in curvature and VISNIR-slope between faculae and hollows that suggest
501
differences between material forming these units. Some faculae would have to be
502
relatively young, as hollows are identified among the youngest formations on the
503
surface of Mercury. Thomas et al. (2014a) showed that faculae occurred until less
504
than 1 Ga, and Blewett et al. (2018) dated hollows as up to 1 Ga. Therefore, on
505
a geological time scale, the formation of hollows and faculae could be close,
sup-506
porting our hypothesis.
507
5.1.2 Are volatile components of hollows linked to the host-crater?
508
MASCS observations allow the comparison of the spectral properties between the
509
hollows and their parent material: crater floor. We found a strong linear correlation
be-510
tween UV-downturn in the host-craters and their associated hollows (Figure 12). The
511
same correlation is observed for the Curvature. This result is consistent with the
cor-512
relation found before between UV-downturn and Curvature (see section 3.2). The
spec-513
tral slopes are uncorrelated between hollows and the host crater floor.
514
This correlation could be explained by two hypotheses:
515
1. A mixing between hollows and local crater floor material in the MASCS footprints.
516
We have shown in section 3.3 that a mixing can have an effect on spectral
prop-517
erties.
518
2. The physical and/or chemical properties of the hollows material are dependent on
519
the parent material. If the volatile rich layer is created during the differentiation
520
of the impact melt, as proposed by Vaughan et al. (2012), there is no reason for
521
the composition of this layer to be the same for all the impact craters. In fact, the
522
composition of the volatile-rich layer can vary for example with the depth of
ex-523
cavation, the material excavated and also with the temperature of the impact melt.
524
The differentiation of a possible sulfide layer will therefore be different in terms
525
of composition for each impact melt and crater, especially if heterogeneity is present
526
in the crust even before the impact. Our analysis is in agreement with a
differ-527
ent volatile layer depending on each impact crater. These interpretations exclude
528
the presence of a global volatile rich layer with unique composition.
529
5.2 Formation and evolution of hollows
530
The high spatial resolution of MASCS observations and NAC-MDIS images around
531
the central peak of Eminescu impact crater offers the opportunity to investigate the
spec-532
tral properties across the different parts of this particular hollow (Figure 3). Some
foot-533
prints are located in the interior of the hollows and others on the surrounding bright part.
534
We found that all the parameters have higher values in the halo than in the hollows floor.
535
In the VIS to NIR, the two parts of the hollows have less steep slopes than the impact
536
crater floor (Figure 13). The UV-downturn in the hollows floor is close to the UV-downturn
537
of the impact crater floor (Figure 13). The UV-downturn in the halo is greater than the
538
UV-downturn in the host-crater. In the halo, all the parameters (VIS-slope,
VISNIR-539
slope, UV-downturn and curvature) are correlated with the R750, and we can observe
Figure 12. Linear correlation between parameters in the host crater and parameters of its associated hollows field. Dots represent the median value of all spectra used and the error bars correspond to the standard-deviation. Near-ultraviolet properties of hollows are dependent on the host crater.
a linear change between the hollows interior and the bright halo (Figure 13). Spectral
541
parameters are not correlated to the observation conditions (incidence, emission, phase
542
angles), so this evolution is not an artifact of varying viewing geometry.
543
Several hypotheses can explain this gradual change in spectral parameters between
544
the two parts of the hollows: 1) The bright halo and the hollows interior have very
dif-545
ferent spectral properties, which at the spatial resolution of MASCS footprints results
546
in spectra that are geographical mixtures between hollow floors material and halo
ma-547
terial that create intermediate values of spectral parameters, 2) The bright halo tends
548
gradually to have the same spectral properties of the hollows interior. The physical and
549
chemical properties of the material can change along the halo from the inner part of it
550
to the edges.
551
Blewett et al. (2013) proposed several explanations on the presence of the bright
552
halo around hollows. Among these hypotheses are the destruction of nanophase sulfides
553
and physical properties modified during the formation of the hollows. In this analysis,
554
we showed that halo has also steeper slopes and higher curvature. The destruction of
555
nanophase sulfides increases the reflectance and decreases the spectral slope and that could
556
explain why hollows interior have higher reflectance and less steep VIS to NIR slope than
557
parent material (crater floor). In addition, as mentioned in section 3.2, the particular
Figure 13. MASCS footprints in the Eminescu hollows (ob4 14327 010045,
ob4 14326 164731). The spatial resolution is from 0.3 to 1.7 km/footprint, so the length of the footprint is approximately four times larger than the dot. The color code shows increasing values of UV-downturn (a), curvature (b) and VISNIR-slope (c) from blue to yellow. The three parameters gradually increase between hollow floor and bright halo.
spectral properties of hollows may be related to the presence of an absorption band
tred around 300 nm associated with the sulfides CaS, NaS and MgS (Varatharajan et
560
al., 2019). The results shown in Figure 13 are consistent with the loss of sulfides
pro-561
gressively decreasing the depth of the absorption band, and thus decreasing the UV-downturn
562
and curvature during the hollows formation.
563
Moreover, the loss of a volatile component could result in a change in grain size.
564
Thomas et al. (2016) showed differences in grain-size in Eminescu’s hollows: grains seem
565
to be finer in the halo than in the hollow floors. The reflectance increases when the grain
566
size decreases (Crown & Pieters, 1987). This result could explain the very high reflectance
567
in the halo.
568
These observations support the scenario of a formation by scarp retreat proposed
569
by Blewett et al. (2013). In fact, some favorable physical conditions could lead the
for-570
mation process of hollows in a given spot. After the destruction of the volatile
compo-571
nent, new material is exposed on the surface. The evolution of the reflectance spectra
572
according to the growth of the hollow is represented in Figure 14. In the place where the
573
hollows begins to grow, the reflectance, UV-downturn, and Curvature increases and the
574
VISNIR-slope starts to slightly decrease (spectrum 3 compared to spectra 1, 2 in
Fig-575
ure 14a). This variation seems to be related to the beginning of the loss of the volatile
576
element. At this point, unaltered material present under the regolith and rich in volatile
577
elements seems to be exposed at the surface. Then, as the volatile element is destroyed
578
in the unaltered material exposed, the reflectance, UV-downturn and Curvature begin
579
to decrease (Spectrum 2 in figure 14c). The slope of the spectrum continues to decrease.
580
The destruction of volatile-rich material changes the physical structure of the material
581
exposed on the surface and makes it unstable. Some parts begin to destabilize and then
582
collapse along the hollow escarpment exposing unaltered material on the surface. When
583
the volatile phase is lost, the vertical progression of the hollows stops.
584
Determination of the nature and rate of hollows formation process is one of the
ob-585
jectives of the BepiColombo mission to Mercury (Rothery et al., 2020). In particular,
586
VIHI (Visual and Infrared Hyperspectral Imager) on the instrumental suite
SIMBIO-587
SYS (Spectrometer and Imaging for MPO BepiColombo Integrated Observatory
SYS-588
tem, Flamini et al., 2010; Cremonese et al., 2020) should be able to confirm the
valid-589
ity of the scenario proposed in figure 14. The spatial resolution of this instrument (up
590
to 100m/pixel) is represented on the figure 14 panel c. Observations of hollows with VIHI
591
will certainly make it possible to define the spectral characteristics of each hollows
fa-592
cies (floor, bright halo and background terrain) more distinctly than the MASCS
instru-593
ment and increase the number of hollows observed with sufficient spatial resolution to
594
resolve each facies.
Figure 14. A schematic illustration of possible hollows growth and the evolution of re-flectance spectra. Diagrams a, b and c are in chronological order. The red spectrum is the Mercury’s reference (Izenberg et al., 2014). The small circles on panel c represent the spatial resolution of future hyper-spectral observations with BepiColombo.
6 Conclusion
596
Images from MESSENGER revealed the presence of hollows on the surface of
Mer-597
cury; however their origin and nature remained unconstrained. Multispectral data showed
598
that hollows are among the brightest features on the surface of Mercury and exhibit
pos-599
sible absorption features associated with sulfides. From the highest spatial resolution
ob-600
servations with the Mercury Atmospheric and Surface Composition spectrometer (MASCS)
601
examined here, several important conclusions about the hollows can be made.
602
1. Hollows have unique spectral properties in the near-ultraviolet. Their reflectance
603
spectra are quite distinct from other geological units. Hollows have a steeper
down-604
turn in reflectance between 300 and 350 nm and are characterized by a distinct
605
spectral curvature between 300 and 600 nm. These properties may be related to
606
the absorption feature of certain sulfides such as CaS, NaS and MgS, centered around
607
300 nm (Varatharajan et al., 2019).
608
2. Hollows reflectance spectra exhibit no clear evidence of absorption features in the
609
visible in MASCS data as was observed in the MDIS multi-color data. The lack
610
of consistent absorption bands seems to be related to calibration errors in one or
both instruments, or could be attributed a lack of sufficient concentration of
sul-612
fides in the MASCS field-of-view.
613
3. The evolution of spectral properties throughout the Eminescu hollows are
consis-614
tent with a formation by destruction of nanophase sulfides. In addition, the
spec-615
tral properties are correlated with the morphology of the hollows supporting the
616
suggestion that hollows grow by scarp retreat.
617
4. Faculae and hollows have distinct spectral properties. This suggests that the volatile
618
species driving explosive eruption and formation of hollows on Mercury have
dif-619
ferent nature and origin. On the other hand, near-ultraviolet and Curvature
prop-620
erties of hollows are correlated with properties of host crater floor implying that
621
the composition and/or physical properties of the hollows material depend on those
622
of the host crater. This supports the hypothesis of the differentiation of a volatile
623
rich layer in the impact melt.
624
The Bepicolombo mission is equipped with an instrumental suite (Flamini et al.,
625
2010; Cremonese et al., 2020) including a hyperspectral imager: VIHI (Visual and
In-626
frared Hyperspectral Imager). This instrument has higher spatial resolution (up to 100
627
m/pixel), a higher signal-to-noise ratio and a wider range of wavelength (0.4 to 2µm)
628
than MASCS. The future VIHI global coverage (at 480m/pixel) and high resolution
im-629
ages (which will cover 20% of the surface) will extend the MASCS results obtained in
630
hollows (Cremonese et al., 2020). These observations of different hollows will provide
ad-631
ditional insight into the nature and processes of hollow formation. In addition, these data
632
will be essential in differentiating the effects of composition, grain size and space-weathering
633
on hollow spectra. Together with observations from the spectrometer MERTIS (Mercury
634
Radiometer and Thermal Infrared Spectrometer, Hiesinger et al., 2010), BepiColombo
635
may lead to the discovery of new spectral characteristics of hollows at infrared wavelengths
636
(7 to 14µm) not observed by MASCS.
637
Acknowledgments
638
The authors acknowledge the Centre National des Etudes Spatiales (CNES) for
contin-639
uous and long term support. O. Barraud acknowledges the support of the European Space
640
Astronomy Centre (ESAC) faculty council for funding a visit to ESAC as part of this
641
work. J. M. Sunshine was a visiting scientist at LESIA -Observatoire de Paris during this
642
study. Special thanks to Sylvain Cnudde for the drawing in Figure 14. The data used
643
in this work are available at the PDS Geosciences Node of Washington University, St.
644
Louis, USA. The data set https://pds-geosciences.wustl.edu/messenger/mess-e v
h-mascs-645
3-virs-cdr-caldata-v1/messmas 2101/data/ddr/ was used which contains the latest
cal-646
ibration provided by the MESSENGER science team. The authors thank the reviewers
647
for their constructive reviews and Jasinghege Don P. Deshapriya for his careful
proof-648
reading.
649
References
650
Bennett, C. J., McLain, J. L., Sarantos, M., Gann, R. D., DeSimone, A., & Orlando,
651
T. M. (2016). Investigating potential sources of mercury’s exospheric
cal-652
cium: Photon-stimulated desorption of calcium sulfide. Journal of Geophysical
653
Research: Planets, 121 (2), 137-146. doi: 10.1002/2015JE004966
654
Besse, S., Doressoundiram, A., Barraud, O., Griton, T., L. Cornet, M˜unnoz Crego,
655
C., Varatharajan, I., & Helbert, J. (2020). Spectral properties and physical
656
extent of pyroclastic deposits on mercury: Variability within selected deposits
657
and implications for explosive volcanism,. Journal of Geophysical Research:
658
Planets. doi: 10.1029/2018JE005879
659
Besse, S., Doressoundiram, A., & Benkhoff, J. (2015). Spectroscopic
proper-660
ties of explosive volcanism within the caloris basin with messenger