HAL Id: hal-03256855
https://hal.sorbonne-universite.fr/hal-03256855
Submitted on 10 Jun 2021
HAL is a multi-disciplinary open access
archive for the deposit and dissemination of
sci-entific research documents, whether they are
pub-lished or not. The documents may come from
teaching and research institutions in France or
abroad, or from public or private research centers.
L’archive ouverte pluridisciplinaire HAL, est
destinée au dépôt et à la diffusion de documents
scientifiques de niveau recherche, publiés ou non,
émanant des établissements d’enseignement et de
recherche français ou étrangers, des laboratoires
publics ou privés.
complex at membrane contact sites
Eugenio de la Mora, Manuela Dezi, Aurélie Di Cicco, Joëlle Bigay, Romain
Gautier, John Manzi, Joël Polidori, Daniel Castaño-Díez, Bruno Mesmin,
Bruno Antonny, et al.
To cite this version:
Eugenio de la Mora, Manuela Dezi, Aurélie Di Cicco, Joëlle Bigay, Romain Gautier, et al.. Nanoscale
architecture of a VAP-A-OSBP tethering complex at membrane contact sites. Nature
Communica-tions, Nature Publishing Group, 2021, 12, pp.3459. �10.1038/s41467-021-23799-1�. �hal-03256855�
Nanoscale architecture of a VAP-A-OSBP tethering
complex at membrane contact sites
Eugenio de la Mora
1,2,5
, Manuela Dezi
1,2,5
✉
, Aurélie Di Cicco
1,2
, Joëlle Bigay
3
, Romain Gautier
3
,
John Manzi
1,2
, Joël Polidori
3
, Daniel Castaño-Díez
4
, Bruno Mesmin
3
, Bruno Antonny
3
✉
&
Daniel Lévy
1,2
✉
Membrane contact sites (MCS) are subcellular regions where two organelles appose their
membranes to exchange small molecules, including lipids. Structural information on how
proteins form MCS is scarce. We designed an in vitro MCS with two membranes and a pair of
tethering proteins suitable for cryo-tomography analysis. It includes VAP-A, an ER
trans-membrane protein interacting with a myriad of cytosolic proteins, and oxysterol-binding
protein (OSBP), a lipid transfer protein that transports cholesterol from the ER to the trans
Golgi network. We show that VAP-A is a highly
flexible protein, allowing formation of MCS of
variable intermembrane distance. The tethering part of OSBP contains a central, dimeric, and
helical T-shape region. We propose that the molecular
flexibility of VAP-A enables the
recruitment of partners of different sizes within MCS of adjustable thickness, whereas the T
geometry of the OSBP dimer facilitates the movement of the two lipid-transfer domains
between membranes.
https://doi.org/10.1038/s41467-021-23799-1
OPEN
1Laboratoire Physico Chimie Curie, Institut Curie, PSL Research University, CNRS UMR168, Paris, France.2Sorbonne Université, Paris, France.3CNRS UMR
7275, Université Côte d’Azur, Institut de Pharmacologie Moléculaire et Cellulaire, Valbonne, France.4BioEM Lab, C-CINA, Biozentrum, University of Basel,
Basel, Switzerland.5These authors contributed equally: Eugenio de la Mora, Manuela Dezi. ✉email:manuela.dezi@curie.fr;bruno.antonny@ipmc.cnrs.fr;
daniel.levy@curie.fr
123456789
M
embrane contact sites (MCS) are subcellular regions
where two organelles associate to carry out non-vesicular
communication
1–6. MCS involve almost every organelle,
are present in all tissues, play important roles in lipid exchange,
calcium signaling, organelle
fission, inheritance, and autophagy, and
are implicated in metabolic diseases.
In MCS, the two facing membranes are closely apposed,
typi-cally 15‒30 nm apart, over distances up to micrometers.
Conse-quently, MCS are highly confined spaces but their molecular
organization is poorly understood, notably with regards to
pro-tein stoichiometry, density, orientation, and dynamics. Propro-teins
involved in membrane tethering display a wide variety of
orga-nizations: single or multiple polypeptide chains, complexes of two
proteins, each of them associated with a different organelle, or
multimeric assemblies such as the ERMES complex between the
ER and mitochondria
1.
To date, no complete structure of tethers involved in MCS
formation has been solved. In general, structural information is
limited to protein domains such as those involved in lipid transfer
or organelle targeting
7–13. Because these domains are often
con-nected by disordered linkers, this leaves numerous possibilities for
how the full-length proteins orient and move between the two
facing membranes. Moreover, all structures have been determined
in the absence of membranes, resulting in an incomplete view
of MCS.
Thanks to advances in cryo-electron microscopy (cryo-EM)
and in situ cryotomography (cryo-ET),
first images of MCS at
medium resolution have been obtained. Synaptotagmins and their
yeast orthologs tricalbins are rod-shape 15–20 nm long structures
that bridge the ER and the PM
14–16.
Here, we address the general question of the formation of MCS
at a molecular scale by studying a model MCS formed by VAP-A
and OSBP. VAP-A and its homolog VAP-B are transmembrane
ER proteins that interact with
≈100 cytosolic partners. They do so
through a common mechanism: the cytosolic Major Sperm
Protein (MSP) domain of VAP-A/B recognizes FFAT (two
phe-nylalanine in an acidic track) or FFAT-like motifs in partner
proteins
17–21. The large spectrum of VAP-A interactants and
their involvement in many MCS make the structure of VAP-A at
MCS an important open question.
OSBP and OSBP-related proteins (ORPs) constitute a large
family of lipid transfer proteins (LTPs). Several ORPs
transport-specific lipids in a directional manner owing to the counter
exchange and hydrolysis of the phosphoinositide PI4P. OSBP that
contains an FFAT motif and that binds VAP-A drives
choles-terol/PI4P exchange at ER-Golgi MCS
22,23and is the target of
several anticancer and antiviral compounds
24,25, pointing to its
key role in cellular homeostasis.
In this work, we designed an in vitro system adapted for
cryo-EM and cryo-ET analysis of MCS formed by VAP-A and
either OSBP or a shorter construct, N-PH-FFAT, containing
OSBP tethering determinants. By sub-tomogram averaging,
we obtained 3D models of VAP-A and N-PH-FFAT between
facing membranes, which reveal the organization of membrane
tethering.
Results
We studied the structure of minimal MCS formed by two purified
proteins, VAP-A and OSBP. The domain organization of these
proteins is schematized in Fig.
1
a.
VAP-A is inserted in the ER membrane using a single
C-terminal transmembrane helix (TM) and exposes its N-C-terminal
globular domain of the MSP family to the cytoplasm. The MSP,
which recognizes proteins that contain FFAT or FFAT-like
motifs, is separated from the TM by a predicted coiled-coil region
(CC)
13,19. Together with the TM, the CC promotes the
dimer-ization of VAP-1/B proteins
26.
OSBP contains
five functional regions: an N-terminal
intrin-sically disordered region, a PH domain, a putative central CC
domain, an FFAT motif, and a C-terminal OSBP-related domain
(ORD), which exchanges cholesterol for PI4P
23,27. OSBP bridges
ER and TGN via its FFAT motif, which recognizes VAP-A, and
via its PH domain, which recognizes Arf1-GTP and/or PI4P
present in the Golgi membrane
23. A simplified N-PH-FFAT
construct of OSBP, lacking the ORD, recapitulates the tethering
function of OSBP
23,28. N-PH-FFAT and OSBP were purified as
reported
23.
Purification/biochemical and functional characterization of
full-length VAP-A. In this study, we used full-length OSBP or
N-PH-FFAT to reconstitute MCS and analyze their architecture
by cryo-EM and cryo-ET. To better mimic the cellular
condi-tions, we used full-length VAP-A with its TM inserted into the
liposome bilayer.
We expressed full-length VAP-A in Escherichia coli and
purified it in a micellar form using the mild detergent
n-dodecyl-β-
D-maltoside (DDM) (Fig.
1
b). Size exclusion
chroma-tography showed a single peak at MW ~ 420 kDa. As observed for
membrane proteins, the apparent MW was higher than that
expected for a VAP-A monomer (27.9 kDa) or dimer (54.8 kDa)
owing to the presence of the DDM micelle. In sodium dodecyl
sulphate–polyacrylamide gel electrophoresis (SDS-PAGE) gel and
in the presence of reducing agents, VAP-A preparation showed
two bands at ~55 kDa and ~25 kDa, whereas a single band was
found when the samples were heated revealing dimers of VAP-A
in the preparation (Supplementary Fig. 1a).
We reconstituted VAP-A in liposomes by adding to the
VAP-A in DDM, a solubilized mixture of egg
phosphatidylcho-line (PC) and brain phosphatidylserine (PS) at a 95/5 mol/mol,
a ratio similar to what found at the ER, followed by detergent
removal (Fig.
1
c). We chose a high lipid/protein ratio (LPR
≈
1400 mol/mol) to ensure that proteins were present at low
density in the membrane. Cryo-EM showed that the
proteoli-posomes were spherical, unilamellar, and displayed a diameter
ranging from 40 to 200 nm. After
flotation on a sucrose
gradient, the proteoliposomes were recovered in a single low
sucrose density band, suggesting a homogeneous population
(Fig.
1
c, lanes 6–11). No protein aggregates were found at the
bottom of the gradient (lane 23 in Fig.
1
c).
To test if VAP-A in proteoliposomes was able to functionally
interact with OSBP (Fig.
1
d), we used an assay that follows the
transfer of PI4P from Golgi-like to ER-like liposomes in real
time
23. Previous biochemical reconstitutions and cellular
obser-vations indicated that interaction with membrane-bound VAP-A
determines the lipid exchange activity of OSBP
23.
We incubated the VAP-A proteoliposomes with Golgi-like
liposomes containing 4% PI(4)P and Rhodamine lipid
(Rho-PE), and used the probe NBD-PH as a
fluorescent
reporter of the membrane distribution of PI(4)P. At the
beginning of the experiment, the
fluorescence of NBD-PH
was quenched by Rhodamine lipid (Rho-PE), as both PIP4 and
Rho-PE were present in the same liposomes. The addition of
OSBP triggered a large increase in the
fluorescence of NBD-PH
due to the transfer of PI(4)P to the VAP-A proteoliposomes,
which did not contain Rho-PE (Fig.
1
d). PI4P transfer rate
increased with the amount of OSBP and was inhibited by
OSW1, a specific OSBP inhibitor.
These results show that full-length VAP-A purified in DDM is
well folded, can be incorporated in lipid membranes, and is
functional.
VAP-A extends at increasing distances from the membrane
with its concentration. We reconstituted VAP-A at LPRs ranging
from 2800 to 50 mol/mol. We expected that increasing VAP-A
density could favor protein–protein interaction in the membrane
plane. We visualized the reconstituted proteoliposomes by
cryo-EM. When the starting mixture was at LPR 70 mol/mol, i.e a high
protein density, the reconstituted proteoliposomes were
hetero-geneous in shape and size. We observed (i) spherical vesicles, (ii)
non-spherical vesicles displaying angular shapes or tubulation,
(iii) fragments of open membranes resembling ribbons with
proteins on both side of the bilayer, and (iv) multilayered vesicles
(Fig.
1
e, Supplementary Fig. 1b, f). When the concentration of
VAP-A was reduced to LPR 350 mol/mol, the fraction of
sphe-rical vesicles increased at the expense of ribbons and deformed
vesicles (Supplementary Fig. 1c). At high LPR (700–1400 mol/
mol), all proteoliposomes were spherical or slightly deformed
(Supplementary Fig. 1d, e). Thus, vesicle morphology depended
on the concentration of VAP-A in the membranes. High protein
density shapes the membrane probably by crowding effect and/or
lateral protein–protein interactions, as shown for other
trans-membrane proteins reconstituted at high density for electron
crystallography and AFM
29,30.
Even though VAP-A has a small size for cryo-EM, electron
densities of VAP-A extending out of the membrane of vesicles
were clearly visible. We measured the length of the
extramem-brane domain of VAP-A in different types of vesicles after
reconstitution at LPR 70 mol/mol using the well-resolved electron
density of the external lipid leaflet. VAP-A extended 10 ± 2 nm
d
a
N-PH-FFAT (37.4 kDa) VAP-A (27.9 kDa) MSP coiled-coil TM 5 7 9 11 13 15 17 19 21 23 25 MW Stre p- VAP-A VA P-Ab
Elution volume (mL) Absorbance (a.u.) 120 100 80 60 40 20 0c
1 6 7 8 9 10 1112 23 Proteoliposome VAP-A 5 10 20 30 % Su cr ose detergent removal 1 23 6 7 8 9 10 11 12 Fra c tio n # VAP-A MW 70 100 55 35 25 130 250 55 43 26 34 100 1a’’ 2a’’ 2a’1
2
3
1a’ OSW-1PI4P
LG LE OSBP VAP-A 4 3 2 1 PI4 P tr a n sf e rre d (N o rm .) 0 500 1000 1500 2000 Time (s) VAP-A OSBP (nM) 200 100 100 +OSW-1 buffere
f
Ribbons Vesicles Onions
20 18 16 14 12 10 8 0 VA P -A le n g th (n m ) 70 kDa kDa PH CC ORD FFAT OSBP (89.4 kDa) PH CC FFAT
*
*
440 158 75 43(n
= 284 measurements, 50 vesicles) from the outer lipid leaflet of
deformed vesicles. In some cases, individual proteins with an
elongated shape were identified (Fig.
1
f,
1
a’–1a”, white arrows).
At the protein tip, dark dots were followed by a region toward the
membrane without a defined structure. Previous structural
studies
13,26,31and our model of VAP-A (see below Fig.
4
) suggest
that the dark distal densities are likely to correspond to the MSP
domain. These dark dots were also found closer to the membrane
suggesting that VAP-A and/or its MSP domains adopted various
orientations with regard to the membrane plane. In the case of
ribbons (Figs.
1
f,
2
a’–2a”), VAP-A appeared more compact
and perpendicular to the lipid bilayer, extending up to 17 ± 2 nm
(n
= 422 measurements, 50 ribbons).
The multilayered vesicles were made of concentric membrane
layers separated by protein densities, suggesting that they were
held together by VAP-A homotethers (Fig.
1
e3). This
organiza-tion was reminiscent of that of Ascaris suum MSP dimers, which
assembled antiparallel owing to 3D crystal packing
32. VAP-B
homotether existence has been suggested to explain stacked ER
cisternae phenotype in Nir2/VAP-B-expressing cells
33. The
separation between facing membranes in multilayered vesicles
was 22–28 nm, suggesting that VAP-A molecules extend 11–14
nm from the membrane.
In summary, VAP-A extends at variable distances from the
membrane, adopting either a compact and tilted conformation at
low surface density or an extended conformation at high surface
density, suggesting a highly
flexible molecule.
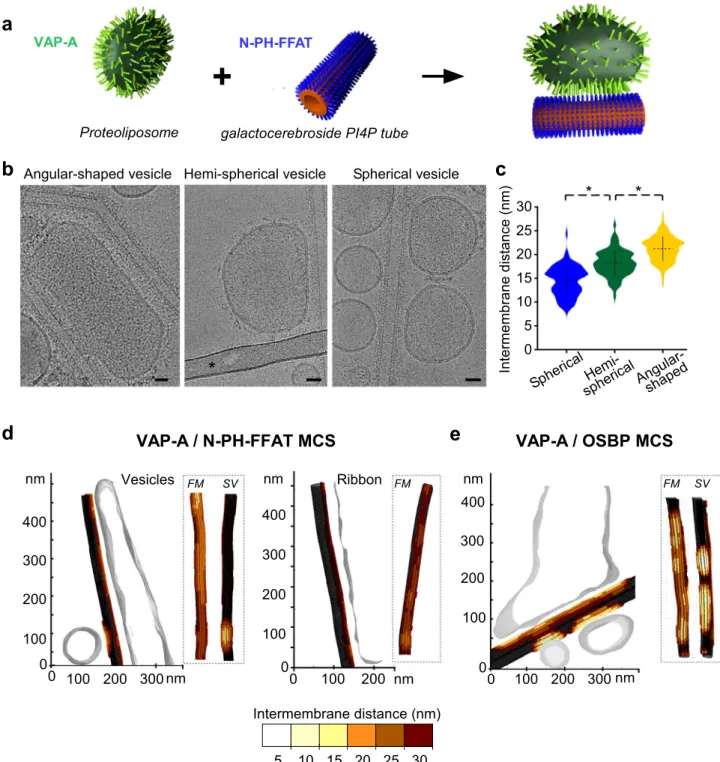
Formation of MCS with VAP-A and OSBP. We next studied
how VAP-A binds partners and forms a MCS.
Because VAP-A and N-PH-FFAT are small, we suspected that
the putative VAP-A/N-PH-FFAT complex of 130.6 kDa might be
difficult to recognize within a contact zone where proteins are
densely packed. We thus designed an in vitro system that could
allow us to assign the membrane system to which each protein
was bound. Specifically, we mixed two morphologically different
membranes: VAP-A was incorporated in egg PC/brain PS
liposomes, whereas N-PH-FFAT was bound to lipid tubes made
of galactocerebroside (GalCer) containing PI(4)P (Fig.
2
a). The
lipid tubes were also doped with PC and PS to increase
membrane
fluidity
34. They had a constant diameter of 27 nm
and showed variable lengths of several hundreds of nanometers
(Supplementary Fig. 2a). N-PH-FFAT or OSBP were bound at
high concentrations to the tubes as shown by the protein densities
covering the external lipid leaflet and extending 5–6 nm from the
membranes.
We incubated VAP-A proteoliposomes with PI4P tubes
decorated with N-PH-FFAT and froze the mixture for cryo-EM
observation. After 2 min incubation, we observed massive
aggregation of vesicles and tubes suggesting fast tethering of the
two membranes (Supplementary Fig. 2b, d). To reduce
aggrega-tion, we added sequentially both components directly onto the
cryo-EM grid, before freezing within <30 seconds (Supplementary
Fig. 2c, e). Contact areas were recognizable at low magnification
with remodeled vesicles in close proximity of tubes
(Supplemen-tary Fig. 2e). This protocol resulted in an ice layer that was thin
enough for cryo-EM or cryo-ET and was therefore selected for
further analysis of MCS architecture and formation.
The MCS intermembrane distance depends on the local
con-centration of VAP-A. VAP-A is present along with the ER and
concentrates in MCS where FFAT-containing proteins are
present
23,35. However, the number of VAP-A molecules engaged
in MCS is not known. We analyzed how MCS assembled when
the concentration of VAP-A in the membrane varied.
We reconstituted VAP-A at a low LPR ratio (70 mol/mol)
to obtain a mix of spherical vesicles, deformed vesicles, and
membrane ribbons.
After incubation with N-PH-FFAT tubes, different types of
contact areas were observed depending on the morphology of the
VAP-A-containing bilayer. We identified (i) angular-shaped
proteoliposomes with high protein density on the surface and
with membrane lying along the tubes, (ii) hemispherical vesicles
with deformations restricted to a part of the vesicles, and (iii)
spherical liposomes in tangential contact with the tubes (Fig.
2
b, d).
The separation between the facing membranes was not constant
and depended on the class of contacting vesicles. Measurements
from 2D images showed that the intermembrane distance
between the tubes and the VAP-A-containing membranes
increased from 15 nm ± 5 nm for the spherical vesicles to 20 ± 5
nm for the highly deformed vesicles (Fig.
2
c). Larger distances up
to 30 nm were measured in cryo-tomograms of VAP-A ribbons
(Fig.
2
d). This trend was similar to that observed for increasing
concentrations of VAP-A in membranes, suggesting an effect of
VAP-A density on membrane separation in MCS.
Fig. 1 VAP-A extends from the membrane with increasing protein density. a Domain organization of VAP-A, of OSBP, and of the N-PH-FFAT construct. b Purification of full-length VAP-A with its transmembrane domain after solubilization in n-dodecyl-β-D-maltoside (DDM). SDS-PAGE analysis of purified strepII-TEV-tag VAP-A before and after TEV proteolysis. Size exclusion chromatography of VAP-A. The red marker is BmrA, a 130 kDa membrane protein solubilized in DDM.c The scheme describes the principle of proteoliposome formation by detergent removal. Lipid/protein molar ratio (LPR) before detergent removal was adjusted to change the amount of VAP-A in proteoliposomes. Floatation of VAP-A proteoliposomes doped with afluorescent lipid. SDS-PAGE analysis shows that VAP-A is incorporated in a single population of vesicles. Cryo-EM images of VAP-A proteoliposomes. Fractions from the sucrose gradient were not heated at 95 °C as done in 1B in the denaturation buffer explaining the presence of the band at 60 kDa corresponding to the non-dissociated dimer of VAP-A. Bar= 250 nm. d The scheme describes the principle of PI4P translocation between Golgi-lipid vesicles and VAP-A proteoliposomes as catalyzed by OSBP. Real-time measurement of PI(4)P transfer in the presence of VAP-A proteoliposomes at LPR 4000 mol/mol. NBD-PH (3μM) was mixed with Golgi-like liposomes (250 μM lipids containing 4 mol % PI(4)P and 2 mol % rhodamine lipid (Rho-PE)) and VAP-A proteoliposomes (250μM lipids, 0.17 nM Vap-A). At t = 300 sec, OSBP was added at 100 or 200 nM as indicated. OSW1 (1 μM) an inhibitor of OSBP was used to inhibit PI4P transfer.e Reconstitution of VAP-A at high protein density (LPR 70 mol/mol) leading to the formation of deformed vesicles (1), ribbons (2), onions (3). Violin plots showing the length distribution of the extramembrane region of VAP-A. The plot shows the complete distribution of values analyzed. The horizontal and vertical lines show the average value and the standard deviation, respectively.∗ indicates p < 0.01 by unpaired t test. 50 vesicles (n = 78 measurements), 45 ribbons (n = 421 measurements), and 6 onions (n = 78 measurements) were analyzed. Bar = 25 nm. f Close-up views of regions 1a’, 2a’ where electron densities of VAP-A are a visible and schematic representation of protein concentration and orientation in the membrane in deformed vesicles 1a” 2a” (tubular region of e1) and ribbons (e2). Some individual proteins are resolved (white arrowheads). The extramembrane region of VAP-A is visible and extends at increasing distances from the membrane. Bars= 10 nm (e, f). Figure1e. Type of analysis, unpaired (independent), two-sided (two tails),t test, valid for all plots. p p value, CI confidential interval. Plot vesicles vs onions: p = 3.3788e-23, CI = [−2.4715, −1.7642], plot onions vs ribbonsp = 6.8058e-14, CI = [−4.3753, −3.9233]. A representative result or micrograph is shown from at least three replicates.
100 200 300 nm
nm
0
0
100
200
300
400
FM SVVesicles
5
10 15 20 25 30
Intermembrane distance (nm)
0
0
100 200 300 nm
100
200
300
400
nm
FM SVSpherical vesicle
Hemi-spherical vesicle
Angular-shaped vesicle
*
+
a
Proteoliposome
VAP-A
N-PH-FFAT
galactocerebroside PI4P tube
b
d
*
*
30
Int
e
rm
e
m
br
ane
di
sta
n
ce
(nm)
0
25
20
15
10
5
c
Sp
herical He
mi
-sp
her
ica
l
Ang
ular
-sh
ap
ed
VAP-A / N-PH-FFAT MCS
e
VAP-A / OSBP MCS
0
100
200
0
nm
Ribbon
FM100
200
300
400
nm
Fig. 2 VAP-A density tunes the separation between facing membranes in reconstituted membrane contact sites (MCS). a Scheme of the reconstitution of MCS between VAP-A proteoliposomes and N-PH-FFAT (or OSBP) bound to galactocerebroside tubes doped with PI4P.b Representative images of the different types of contacts made between VAP-A proteoliposomes (lipid/protein ratio LPR 70 mol/mol) and N-PH-FFAT bound to tubes. The bar labeled with * in the central panel is a carbon grid bar. Bars= 25 nm. c Violin plots of the distance between facing membranes in reconstituted MCS (LPR 70 mol/mol). The plots show the complete distribution of values analyzed. The horizontal and vertical lines show the average value and the standard deviation, respectively.∗ indicates p < 0.01 by unpaired t test. Intermembrane distance between tubes and spherical vesicles (n = 90), hemispherical vesicles (n = 122), and angular-shaped vesicles (n = 128) were analyzed. d 3D reconstruction of VAP-A/N-PH-FFAT and e VAP-A/ OSBP MCS from cryo-tomograms. Distances between angular shape and spherical vesicles and tubes and ribbons and tubes are depicted in color codes on tubes.FM indicates the tube side in contact with a flattened region of large vesicles and SV the tube side in contact with small spherical vesicles. Figure2c. Type of analysis, unpaired (independent), two-sided (two tails),t test, valid for all plots. p p value, CI confidential interval. Plot spherical vs hemispherical vesicles:p = 3.9588e-1, CI [−4.5561, −2.9464]. Plot hemispherical vs angular-shaped: p = 1.3549e-20, CI = [−3.6377, −2.4378]. A representative micrograph or result is shown from at least three replicates.
MCS made with VAP-A can accommodate proteins of different
sizes. To assess whether the presence of the bulky ORD (42 kDa)
of OSBP modified the MCS architecture, we compared MCS
formed with either N-PH-FFAT or full-length OSBP.
We
first reconstituted VAP-A at LPR 70 mol/mol to obtain
proteoliposomes with various VAP-A densities. Then, they
were mixed either with N-PH-FFAT or OSBP bound to PI4P
Galcer tubes. The resulting MCSs were analyzed by cryo-ET.
As shown by trypsin digestion, VAP-A was symmetrically
oriented in proteoliposomes (Supplementary Fig. 1g) but only
VAP-A pointing outward from the vesicles was engaged in
MCS formation.
Figure
2
d and Supplementary Movies 1, 2 show tomographic
reconstruction of an MCS formed by VAP-A and N-PH-FFAT as
determined by cryo-ET. The 3D reconstruction revealed a long
contact region of ca. 500 nm between a large VAP-A vesicle and a
tube, as well as a small contact region of <50 nm with a spherical
vesicle (see also Fig.
3
a, c and Supplementary Fig. 3 for other
examples). As observed in 2D images, the separation between
facing membranes was larger when a
flattened VAP-A-containing
vesicle was in contact with tubes, compared to a spherical VAP-A
vesicle; the intermembrane distances were 20–25 nm and 15 nm,
respectively. We also found VAP-A ribbons forming contact
regions, which represent the membrane system with the highest
VAP-A density, formed MCS with tubes with an intermembrane
distance of 25–30 nm. Both flattened vesicles and ribbons showed
an even separation along the whole MCS, suggesting homogenous
distribution of tethers.
MCS made with OSBP showed differences with that observed
with N-PH-FFAT. First, OSBP promoted smaller surfaces of
contact between tubes and vesicles, even when large VAP-A
vesicles were spread along tubes (Fig.
2
e, supplementary Movie 3).
Second, spherical VAP-A vesicles in which VAP-A is present at
low density were involved in 48% of OSBP MCSs (n
= 89) as
compared with 30% in the case of the MCSs induced by
N-PH-FFAT MCSs (n
= 226). In contrast, no MCSs were found between
OSBP and the A ribbons, i.e., the membrane in which
VAP-A is present at the highest density. Third, the membrane
separations in MCSs induced with OSBP were shorter than that
observed with N-PH-FFAT. In
flat contacting regions, between
proteoliposomes and tubes, we measured intermembrane
dis-tances of 10–20 nm in the presence of OSBP, as compared with
15–25 nm in the presence of N-PH-FFAT.
All these results suggest that the ORD of OSBP imposes space
between proteins, thereby preventing high packing and
elonga-tion of VAP-A proteins.
Membrane remodeling during the formation of MCS. After
contact formation between VAP-A vesicles and PI4P tubes in
the presence of OSBP or N-PH-FFAT, we observed significant
remodeling of the vesicles, notably their
flattening along
the major axis of the tubes. When several tubes were involved
in the contacts, vesicles
flattened to face the tubes (Fig.
2
b,
Supplementary Fig. 3a, b).
We never observed VAP-A liposomes engulfing a tube; vesicles
were either in reduced contact or formed tongues that partially
YZ plane
YZ plane
*
*
70 lipids/VAP-A
a
b
350 lipids/VAP-A
c
30
Inter
mem
br
an
ed
is
ta
n
c
e(
nm
)
25
20
15
10
5
0
70
175
350
1400
LPR lipids/VAP-A
d
v
t
v
t
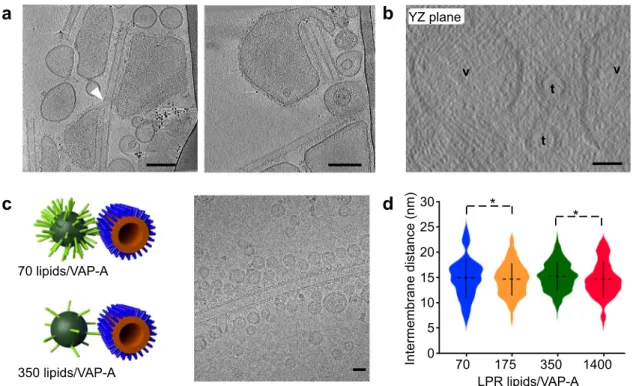
Fig. 3 Membrane deformation upon MCS formation. a Tomographic XY slice from two tilt series showing that VAP-A vesicles spread along the long axis of tubes, form tongue (leftfigure, white arrow) around the tubes, but in general avoid the high curvature short axis of tubes (right figure). Bars = 100 nm. b Tomographic YZ slice from a third tilt series showing theflat membrane of vesicles (v) facing tubes (t). Bars = 25 nm. c Small and non-deformable VAP-A proteoliposomes at varying LPR and bound to N-PH-FFVAP-AT tubes. Representative MCS with VVAP-AP-VAP-A vesicles of 30 nm diameter at 70 and 350 lipids/VVAP-AP- lipids/VAP-A mol/mol. Cryo-EM image of small liposomes of Vlipids/VAP-AP-lipids/VAP-A at LPR350 lipids/Vlipids/VAP-AP-lipids/VAP-A forming contact with N-PH-FFlipids/VAP-AT coated tubes. Bar= 25 nm. d Violin plots showing the distribution of distances between small vesicle of VAP-A at varying LPR and N-PH-FFAT tube. The plots show the complete distribution of values analyzed. The horizontal and vertical lines show the average value and the standard deviation, respectively.∗ indicates p < 0.05 by unpaired t test. Intermembrane distance between tubes and vesicles at LPR 70 (n = 55), LPR175, (n = 240), LPR350 (n = 491), and LPR1400 (n = 152) were analyzed. Figure3d. Type of analysis, unpaired (independent), two-sided (two tails),t test, valid for all plots. p = p value, CI = confidential interval. Plot LPR175 vs LPR350:p = 0.0145, CI = [−1.0367, −0.1143]. Plot LPR350 vs LPR1400: p = 0.0375, CI = [0.0341, 1.1404]. A representative result is shown from at least three replicates.
surrounded the tube (Fig.
3
a, right, white arrow, supplementary
Movie 4). In some cases, contact-forming vesicles bypassed high
curvature areas of tubes (Fig.
3
a, left). In the YZ plane, the
VAP-A membranes facing the tubes were
flat and did not bend around
the tube, whereas they could clearly curve outside the contact area
(Fig.
3
b). Moreover, VAP-A membranes in contact with the tubes
did not show peaks of local deformation, in contrast to what has
been reported for tricalbins by in situ cryo-EM of ER-plasma
membrane contacts in yeast cells
14.
We hypothesized that VAP-A molecules concentrated in
flat
regions of MCS to avoid highly curved membranes. To test this, we
analyzed how MCS formed when high curvature VAP-A vesicles
were too tense to be remodeled (Fig.
3
c). We reconstituted VAP-A
at LPR 70 mol/mol and at 4 °C instead of 20 °C, leading to small
and tense proteoliposomes that were homogeneous in diameter
(25 ± 10 nm; n
= 300, 30 images). After incubation with
N-PH-FFAT tubes, VAP-A vesicles showed no deformation upon binding
along the tubes. Thus, VAP-A can form MCS even between highly
curved membranes. However, the distance between the facing
membranes was quite short, 15 ± 2 nm (n
= 52, 4 images).
Considering a lipid with a molecular surface of 65 Å
2, a vesicle
with a diameter of 20 or 30 nm would contain 3800 or 8700 lipids,
respectively, and therefore 52–114 VAP-A molecules at the given
LPR. When the proteoliposomes were prepared at a high LPR
(1400 lipids/VAP-A), leading to on average 2–4 VAP-A molecules
per vesicles, the intermembrane distance was similar (ca. 15 nm).
These observations suggest that, in an MCS between highly
curved membranes, only a few homodimers of VAP-A were
involved in the contact (as schematized in Fig.
3
c). In contrast,
when the VAP-A-containing membrane was deformable, proteins
seemed to concentrate in a
flat region of MCS, leading to larger
separation between facing membranes, owing to the
flexibility of
VAP-A.
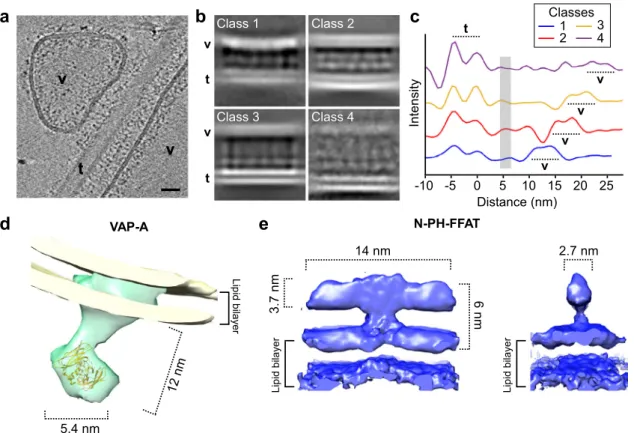
3D models of membrane VAP-A/N-PH-FFAT contact site. To
determine the architecture of the contact site at the molecular
scale, we performed sub-tomogram averaging. The principle
consists of extracting sub-volumes containing identical proteins
and associated membranes, followed by averaging them to
increase the signal-to-noise ratio. We focused on MCS formed
between VAP-A vesicles reconstituted at LPR 70 mol/mol and
N-PH-FFAT-decorated PI4P tubes because they were more
homogeneous than those formed in the presence of OSBP.
Protein densities were visible in the contact areas between
N-PH-FFAT-containing tubes and hemispherical or
flattened
VAP-A vesicles (Fig.
4
a). In some cases, we observed
con-tinuous densities joining the two membranes. However, the
distance between facing membranes of MCS varied, even in
flat
regions and we could not unambiguously attribute the densities
to defined protein domains.
To circumvent these difficulties, we determined major 3D
classes of MCS as a function of membrane separation (Fig.
4
b).
The different classes showed electron densities at three levels: (i)
the tube membrane, which was well resolved, (ii) the vesicle
membrane, which was more diffuse, and (iii) proteins between
the two membranes. A plot of the electron densities
perpendi-cular to the membrane plane is shown in Fig.
4
c, in which we
aligned the electron densities at the level of the lipid tube. The
density of the VAP-A membrane was at increasing
intermem-brane distances from class 1 to 4. In contrast, a protein density
was found at a constant distance of 5–6 nm from the tube
membrane in all four classes. This density could be attributed to
N-PH-FFAT as it was also present in the regions of the tubes not
engaged in contacts. This observation suggests that the variable
distance within the contacts resulted from the ability of VAP-A
molecules to adopt conformations of varying length and/or
orientation.
We determined the architecture of the proteins present in class
3, which was the most homogeneous class by sub-tomogram
averaging. During the analysis, we observed that the position and
densities of N-PH-FFAT were more constant than those of
VAP-A (Supplementary Fig. 4). Consequently, we treated the two
proteins separately and obtained 3D models of VAP-A and
NPH-FFAT at 19.6 Å and 9.8 Å, respectively (Supplementary Table 1).
VAP-A showed a rod-like shape of 14 nm long (Fig.
4
d). The
density attributed to the MSP domain could encompass a dimer
confirming a dimeric organization of VAP-A in MCS. The
N-PH-FFAT 3D model showed a T-shaped organization with a central
stem extending 3 nm from the membrane and joining a 14 nm
long and 2.7 nm wide rod-shaped structure parallel to the
membrane (Fig.
4
c). The axial symmetry was consistent with
a dimer, in line with biochemical observations on OSBP and its
N-PH-FFAT moiety
27,28.
Models of a homolog of the PH domain (aa 80–190 in OSBP)
and of the complex between the disordered region G346-S379
containing the FFAT motif (aa 358–361) and VAP-A MSP are
available
11,36. In addition, we have shown that the N-terminal
region of OSBP (aa1–80) is disordered
28. However, there is no
structural information on the region connecting the PH domain
and the FFAT motif.
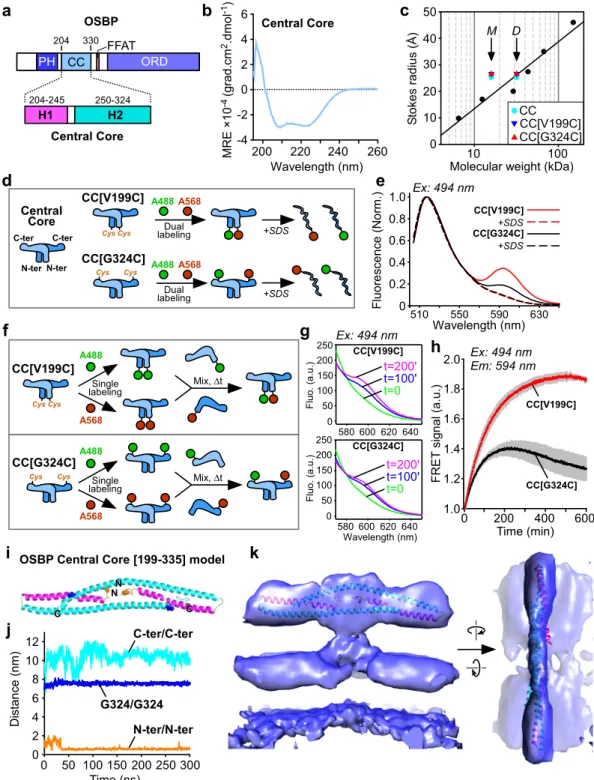
We performed structure predictions with several programs,
which suggested similar secondary structures: two helices
encompassing T204-S244 (H1) and E250-G324 (H2), followed
by a long disordered region encompassing the FFAT motif
(aa 325–408) (Fig.
5
a, Supplementary Fig. 5b). We hypothesized
that these two helices made the main contribution to the electron
density of the T structure, whereas the PH domains would lie on
the membrane. The PH domain and the unstructured parts
should not visible at this resolution. To test this model, we
expressed and purified an OSBP construct encompassing aa
199–324, hereafter termed Central Core (CC). The circular
dichroism (CD) spectrum of this construct showed a 86%
alpha-helical content, whereas gel-filtration chromatography suggested
a dimeric organization (Fig.
5
b, c).
In order to better understand the organization of the CC region
of OSBP, we designed experiments to study the proximity of the
N-termini and the C termini of this dimeric construct by
intermolecular
fluorescence resonance energy transfer (FRET)
(Fig.
5
d–h). We reasoned that if the aa chosen for fluorescent
labeling on one chain was close to the cognate aa on the other
chain, this should result in a high FRET signal.
We replaced the endogenous cysteines of OSBP CC (C224 and
C276) with alanines and we introduced a cysteine either at the
N-terminus (CC[V199C] construct) or at the C-terminus (CC
[G324C]). All mutants behaved similarly by gel-filtration,
suggesting no effect on the structure (Fig.
5
c). After purification,
each construct was labeled with a donor probe (AF-488), with an
acceptor probe (AF-568), or with an equimolar ratio of the
two dyes.
In the
first set of experiments, we compared doubly labeled CC
[V199C] and doubly labeled CC[G324C]. The
first form showed a
large FRET signal at 594 nm, suggesting proximity of the two
N-termini in the dimer. The FRET peak vanished upon
destabiliza-tion of the dimeric structure by SDS addidestabiliza-tion (Fig.
5
d, e). Dually
labeled CC[G324C] showed a 2.7-times smaller FRET peak,
which was also abolished by SDS addition (Fig.
5
e). The
difference in FRET between the two mutants suggests that the
C termini are more distant than the N-termini within the dimer.
In the second set of experiments, we mixed equal amounts of
CC[V199C] labeled with AF-488 with CC[V199C] labeled with
AF-568 (Fig.
5
f). A slow FRET signal with a half-time of about
100 min appeared over time, indicating that monomer exchange
between dimers occurred within several hours. Performing the
same experiment with the CC[G324] mutant resulted in similar
slow kinetics but with a threefold lower FRET signal confirming
that the C termini are more distant than the N-termini within the
dimer (Fig.
5
g, h).
We generated 3D models of 195–335-OSBP with Robetta
37. All
models shared similar organization with H1 and H2 helices, H2
helix being continuous (e.g., model 1) or discontinuous (e.g.,
model 2) (Supplementary Fig. 5b). We used molecular dynamics
(MD) simulations to analyze the dimer stability and found that
model 1 formed a stable dimer (Fig.
5
i). The distances between
C-termini and N-C-termini along the MD trajectory (300 ns) are
depicted in Fig.
5
j. Within the dimer, the N-termini and the
C-termini were close and distant, respectively, in agreement with the
FRET experiments. This model was
fitted in the EM envelop
(Fig.
5
k). Thus, this model seemed as the most likely but since the
resolution was not enough to assign secondary structures, we
cannot exclude that other models are possible. Finally, the stem of
the T that connects to the membrane remains to be assigned.
Discussion
When VAP-A is not engaged in contact, it appears as a
flexible
protein, extending its MSP domain at increasing distances that
correlate with protein density. At a medium density, VAP-A
shows various orientations with regards to the membrane plane,
with its MSP domain exploring a 10 nm-thick region. At a very
high density that leads to ribbons-like membranes, the MSP
extends to 17 nm away from the membrane (Fig.
1
f). Structure
predictions propose that two unstructured regions
flank the
predicted CC domain of VAP-A: region 135–171 between the
MSP domain and the CC, and region 208–226 between the CC
and the TM domain (Supplementary Fig. 5a). These regions,
which are also present in VAP-B, might provide VAP-A/B dimers
with bending and stretching capacity, allowing exploration of a
larger space than a rigid molecule on the surface of the membrane
(Supplementary Fig. 5c).
A most striking feature of VAP-A/B is their ability to interact
with a myriad (currently estimated at
≈100) of cytosolic protein
domains. VAP-A/B are in fact the only known receptors that
anchor proteins on the ER surface. Importantly, the proteins
that are recruited by VAP-A/B have very different domain
organization and function. Some effectors are simply retained
at the ER, others bridge the ER to various organelle membranes,
as is the case for OSBP. For example, the Opi1 repressor
interacts with the yeast VAP-A homolog as well as phosphatidic
acid at the ER surface, whereas MIGA2 bridges ER to
mitochondria
38,39. These different molecular contexts might
require different orientations and positioning of the MSP
domain of VAP-A/B. Therefore, we propose that the structural
flexibility of VAP-A/B enables a large spectrum of protein
assemblies. This effect of protein
flexibility is reminiscent of
what has been observed in other membrane interfaces. Thus,
flexible region of golgins, are essential for the capture of vesicles
2.7 nm Li p idb ila y e r L ip id b ila y e r 14 nm 6 n m 3. 7n m N-PH-FFAT
v
v
v
v
tt
5.4 nm 12 nm L ip id b ila y e r VAP-A v v t t t v v v v Class 2 Class 1 Class 4 Class 3a
b
Int e nsi ty -10 Distance (nm)c
-5 0 5 10 15 20 25 Classes 1 2 3 4d
e
Fig. 4 3D molecular architecture of VAP-A N-PH-FFAT in reconstituted membrane contact sites (MCS). a Tomographic slice of VAP-A/NH-FFAT membrane contact site. Hemispherical vesicles (v) and large andflat vesicles (v) contact a tube (t) decorated with N-PH-FFAT bound to. The lipid bilayer of both vesicles is visible while the lipid bilayer of the tube is out of the plane. Tiny protein densities tether v and t. Bar= 25 nm. b Classes of membrane contact sites after 3D classification. Electron densities of the lipid bilayer and proteins are depicted in white. The distance between facing membranes increases from class 1 to 4. Class 1–3 correspond to MCS formed with VAP-A vesicles and class 4 with VAP-A ribbons. c 2D plot of electron densities perpendicular to MCS of classes 1–4. The outer leaflets of the tubes were aligned at 0 nm. The two lipid leaflets of the tube are well resolved while the VAP-A membrane is less defined and appears at increasing distance from class 1 to 4. In all classes, a protein density assigned to N-PH-FFAT domain is found at 5–6 nm from the tubes (gray line). d 3D volumes of VAP-A and e of N-PH-FFAT at 19.6 Å and 9.8 Å resolution, respectively. A representative tomographic slice or micrographs is shown from at least three replicates.
a
PH CC ORD FFAT 204 330 OSBP 204-245 250-324 H1 H2 Central Core 50 40 30 20 10 0 St o k es ra di us (Å ) 10 100Molecular weight (kDa)
c
CC CC[V199C] CC[G324C] M D MRE × 1 0 -4 (g rad.cm 2.dmol -1) 0 6 4 2 -2 -4 200 220 240 260 Wavelength (nm)b
i
OSBP Central Core [199-335] model0 Dist a n ce (n m ) 0 2 4 6 8 10 12 50 100 150 200 250 300 C-ter/C-ter N-ter/N-ter Time (ns)
j
k
G324/G324 Central Core N N C C Cys Cys Cys Cys CC[V199C] CC[G324C] Dual labeling A488A568 N-ter N-ter C-ter C-ter Central Core Dual labeling A488A568 +SDS +SDS 590 630 550 510 0 0.2 0.4 0.6 0.8 1.0 F luor e scence (N or m.) Wavelength (nm) CC[V199C] Ex: 494 nm +SDS CC[G324C] +SDS Cys Cys CC[V199C] A488 A568 Single labeling Mix,Δt Mix,Δt CC[G324C]Cys Cys Single
labeling A488 A568 Ex: 494 nm Fl uo. (a .u .) 0 150 250 580 600 620 640 200 50 100 t=0 t=100' t=200' 0 150 250 580 600 620 640 Wavelength (nm) 200 50 100 t=0t=100' t=200' F lu o .( a. u.)
g
CC[V199C] CC[G324C]d
e
f
200 400 0 Time (min) 600 CC[V199C] CC[G324C] F R E Ts ign a l( a.u.) 1.0 1.2 1.4 1.6 1.8 2.0 Ex: 494 nm Em: 594 nmh
Fig. 5 3D architecture of the central core domain of OSBP. a Domain organization of OSBP with its central core (CC) region and the predicted H1 and H2 helices.b Circular dichroism spectroscopy of OSBP CC region. Circular dichroism CD spectra minima at 208 and 222 nm indicative of significant α-helical content.c Stokes radius versus MW of OSBP CC constructs (WT, light blue dot; V199C/C224A/C276A, blue triangle; C224A/C276A/G324C, red triangle) and standards (black dots) as determined by gelfiltration. The arrows indicate the expected positions for monomers (M) or dimers (D) according to their MW.d Principle and (e) spectra of dual labeled AF-488 and AF-568 OSBP CC on the N-ter (V199C) or the C-ter (G324C) region analyzed byfluorescence resonance energy transfer (FRET). FRET signal vanished after dissociation of dimers of OSBP CC region with SDS. f Principle of OSBP CC monomer exchange experiment as analyzed by FRETg spectra and h kinetics analyses of monomer exchange between mono labeled AF-488 and mono labeled AF-568 OSBP CC region. Labeling was performed and a Cys introduced either on the N-ter (V199C) or the Cter (G324C) of a construct having endogenous Cys substituted to Ala (C224A/C276A).i Structure of the dimer OSBP CC after 300 ns MD simulation colored by chains.j Plot of the distances between C-termini, N-termini, and G324/G324 along the MD trajectory (300 ns). k Fit of the dimer OSBP CC after 300 ns MD simulation in the 3D EM model of N-PH-FFAT. A representative result is from at least three replicates.
on the surface of the Golgi
40. In Ist2, a yeast MCS tether, a long
intrinsically disordered region is responsible for membrane
tethering, spatial freedom and protein recruitment
41,42. Model
studies of the interaction between streptavidin-coated vesicles
and
flat surfaces coated with either flexible PEG-biotin or rigid
casein–biotin ligands have shown that molecular flexibility can
increase the rate of adhesion between two surfaces by three
orders of magnitude
43.
When VAP-A is engaged in a MCS with N-PH-FFAT, 3D
classification reveals that, again, VAP-A is variable in length and
determines the separation between membranes; in contrast,
N-PH-FFAT displays a
fixed length (Fig.
4
c). The intermembrane
distance increases with the concentration of VAP-A in MCS from
10 nm when a few VAP-A molecules are reconstituted in small
vesicles to 30 nm when VAP-A molecules are densely compacted
in ribbons (Figs.
2
c,
3
d).
VAP-A forms MCS with OSBP or its membrane tethering
moiety N-PH-FFAT. However, less VAP-A molecules are
engaged within MCS formed with OSBP than N-PH-FFAT as
shown by the shorter intermembrane distance suggesting
that the bulky ORDs decrease the accessibility of MCS to
VAP-A (Fig.
2
D). VAP-A is thus strikingly different from a rigid
tethering protein that imposes a
fixed distance between the
facing membranes. In that case, as shown by model mixtures of
binding and non-binding proteins of variable lengths, a
dif-ference in length of only 5 nm of the non-binding proteins is
sufficient to drive exclusion from MCS
44. The much larger
range of intermembrane distance in VAP-A mediated MCS
suggests that VAP-A adapts its density and dimension to the
size of its interactor within a contact area (Supplementary
Fig. 5d).
At ER-Golgi MCS, VAP-A recognizes several LTPs including
OSBP, CERT, Nir2, and FAPP2, which deliver cholesterol,
cer-amide, PI, and glucosylceramide to TGN, respectively
22. They all
encompassed a PH or a LNS2 (Nir2) domain that binds PI4P at
the Golgi and a FFAT motif. As a result, these LTPs could bind
simultaneously to both organelle membranes and thus act as
bridging factors. It is not known if VAP-A has different affinity
for these different LTPs and if all LTP could coexist within the
same MCS. However, our results suggest that the
flexibility of
VAP-A could support the coexistence of different partners
involved in lipid transfer within the same MCS. Similarly, it has
been shown by confocal microcopy that the phosphoinositide
transfer protein Nir2 is recruited at ER-PM neuronal contact sites
made by VAP-A and the potassium channel Kv2:1. Nir2 and
Kv2:1 bear a FFAT and FFAT-like motif, respectively. Such
tri-partite ER-PM junction is proposed to play a role in the
pho-phoinositide homeostasis in brain neurons
45.
During in vitro formation of MCS, large VAP-A vesicles spread
along the major axis of the PI4P containing tubes until they were
no longer deformable (Fig.
3
a). This suggests the participation of
several VAP-A/N-PH-FFAT tethering complexes in an MCS,
which could compensate for the moderate affinity (Kd 2 μM) of
FFAT-bearing proteins for MSP
11. On the other hand, we
observed no wrapping of VAP-A vesicles around the highly
curved tubes, which would require strong interaction between
VAP-A and N-PH-FFAT or OSBP. When membrane curvature is
too high, like in small and tensed proteoliposomes, the separation
is small and independent of the initial density of VAP-A in the
proteoliposomes (Fig.
3
c). Thus, the high curvature in small
proteoliposomes prevents VAP-A molecules from forming a
dense protein area as observed in
flat membranes (Supplementary
Fig. 5d). In situ cryo-EM has shown that Scs2, the yeast ortholog
of VAP-A, also accumulates in ER sheets, whereas tricalbins
accumulate in tubular ER
15,46. This difference was attributed to
the cylindrical shape of Scs2 with a single TM and an elongated
cytosolic domain as compared with the conical shape of
tri-calbins, which insert in the membrane via a hairpin and display
bulky C2 domains.
Once in
flat regions, how VAP-A concentrate in MCS remains
an open question. Clusters of VAP-A have been reported as a
consequence of domains of Kv2.1 potassium channel in the PM
and binding of VAPs to form ER-PM contact site
35.
Concentra-tion of VAP-A might also result from geometrical constraints:
when an elementary VAP-A/N-PH-FFAT pair forms, similar
pairs should concentrate in the vicinity as the intermembrane
distance is optimal for assembly. VAP-A might also concentrate
in lipid nano-domains present in ER as reported recently for
other MCS
47. However, our liposome composition was not prone
to form membrane domains. Whatever the process of
con-centration of VAP-A, our results suggest that it should have an
impact on the separation of facing membranes within MCS.
The tethering region of OSBP is organized as a T-shaped
with a 14 nm elongated domain parallel to the membrane and a
short
≈3 nm stem. The resolution is not enough to assign a
specific domain of OSBP but since it connects to the membrane,
it probably contains part of the two PH domains. Biochemical
analysis indicates that the region between the PH domain and
FFAT motif is dimeric, alpha-helical and has its N-termini very
close together, whereas its C-termini are more distant (Fig.
5
).
Regardless the exact atomic structure, which will require
further studies, the consequence of this organization is that the
tethering and lipid transfer moieties of each monomer are
separated by a large distance, akin to the jib of a tower crane.
Moreover, the two ORDs of the OSBP dimer should be well
separated from each other, which might facilitate their
inde-pendent movements.
Following the T domain, a long sequence G324-R408 is
pre-dicted to be unstructured (Supplementary Fig. 5b). The
first part
of this sequence, G324-N357, i.e., 31 aa before the FFAT motif,
might extend up to 10 nm beyond the T domain to interact with
VAP-A (considering a 3.5 Å step per residue). As a result, the
orientation and position of the T domain relative to VAP-A
might vary. This is what we observed when analyzing a single 3D
class as defined by the fixed intermembrane distance: the
VAP-N-PH-FFAT complexes were not at
fixed positions thus limiting the
resolution of the whole complex. The second part of the sequence
A362-R408 (47 aa), which unifies the FFAT motif to the ORD,
could further extend 14 nm away and should define the action
range of the ORD between the MSP of VAP-A and the two facing
membranes. This ball-in-chain geometry could allow a movement
of up to 28 nm of the ORD between the ER and TGN membranes,
which might be enough to exchange lipids between the two facing
membranes, considering that MCS at the ER TGN interface have
an intermembrane distance of 5–20 nm
48. In addition, the
flex-ibility of VAP-A as revealed here by cryo-EM could further
facilitate the movement of the ORD.
We have previously shown that the intrinsically disordered
N-terminal region of OSBP controls its density under confined
conditions, which facilitates lateral diffusion of proteins within
MCS
28. Here, we highlighted the
flexible properties of VAP-A
and the ordered and disordered domains of OSBP. Thus, the
molecular actors of VAP-A/OSBP MCS carry interfacial
recog-nition information, and also contain regions that are intrinsically
disordered and
flexible, which is likely crucial for MCS dynamics
and supramolecular assembly.
Methods
Microbe strains. Recombinant VAP-A proteins were expressed in C41 (DE3) E. coli strain, which were grown in 2×YT medium at 30 °C. Recombinant OSBP proteins were expressed in Bl21 (DE3) E. coli strain, which were grown in LB/ Ampicilin medium at 37 °C and induced at 16 °C.
Reagents. Egg PC, brain PS, brain PI(4)P, C24:1 Galactosyl(ß) Ceramide, Texas Red 1,2-dihexadecanoyl-sn-glycero-3-phosphoethanolamine, triethylammonium salt (Tx-DHPE) were from Avanti Polar Lipids. Anapoe-X-100 (Triton X100), DDM was purchased from Anatrace. Peptidol:HS-PEG capped gold nanoparticles of 6 nm were prepared by Dr. L. Duchenes49; 50 mesh BioBeads were purchased
from Bio-Rad and prepared according to ref.50. Lacey carbon electron microscopy
grids were purchased from Ted Pella (USA).
Plasmids and proteins expression. Human VAP-A (8-249) fragment was cloned into pET-His6-TEV-LIC then sub-cloned into pET16b for inducible expression as N-terminal His-StrepII-TEV-Vap-A. Vap-A expression was performed in C41 (DE3) E. coli strain. Full-length VAP-A expression was performed in presence of 0.5 mM IPTG for 4 h at 30 °C.
OSBP central region (198–324) were PCR amplified as either (V199C/C224A/ C276A) or (C224A/C276A/G324C) mutants and sub-cloned via BamH1/ Xma1 sites into pGEX-4T2 for expression as GST-tag proteins. Proteins were expressed in Bl21gold E. coli after induction with 1 mM IPTG and overnight culture at 16 °C. The list of all primers is supplied in Supplementary Table 2. Proteins purification. VAP-A: VAP-A-expressing cells were collected and passed twice through a Cell Disrupter at 2k bar pressure. The resulting cell lysate was centrifuged to purify membranes. Membranes were solubilized for 2 h at 4 °C with DDM:protein ratio of 2.5 (w/w) and then centrifuged to collect solubilized proteins. VAP-A was purified on Strep Tactin beads (IBA superflow sepharose) in batch. Eluted proteins were incubated overnight with TEV protease to eliminate the double tag, followed by purification on a Superdex 200 (GE healthcare) size exclusion chromatography in Tris 50 mM pH 7.5, NaCl 150 mM, DDM 0.03 mol/, 10% glycerol. Purified VAP-A was collected at concentration ranging from 1.5 to 2 mg/ml without any additional concentration step,flash frozen in liquid nitrogen and stored at−80 °C.
OSBP and N-PH-FFAT were purified according to refs.23,28. GST-OSBP
(199–324) mutants expressing cells were pelleted and resuspended in 50 mM Tris (pH 7.5), 300 mM NaCl, 5 mM DTT buffer. The bacteria were lysed through a Cell Disrupter at 2k bar pressure and cell lysate was ultracentrifuged. Soluble GST-tagged proteins werefirst purified on Glutathion-Sepharose 4B (GE healthcare) beads, eluted after thrombin clivage, and then further purified on a MonoS HR5/5 column (GE healthcare). Proteins were eluted from the column with a 0 to 1 M NaCl gradient (25 column volume) in 25 mM MES (pH 6.0), 3 mM DTT buffer. Protein fractions were pooled, concentrated on Amicon Ultra 4 (10 kDa cutoff), injected on a Superpose 12 HR 10/30 column (GE healthcare) and eluted with Tris 25 mM pH 7.5, NaCl 120 mM, supplemented with an antioxydant (3 mM DTT or 0.5 mM TCEP). Proteins fractions were pooled, concentrated on Amicon Ultra 4 (10 kDa cutoff), and supplemented with 10% glycerol beforeflash freezing in liquid nitrogen and stored at−80 °C.
Analytical gelfiltration. Purified proteins (100 μl, 10 μM) were applied to a Superdex 75TMcolumn (GE Healthcare) and eluted at aflow rate of 0.5 ml min−1 in 25 mM Tris pH 7.5, 120 mM NaCl, and 1 mM DTT. The column was calibrated using the following standards (MW/Stokes radius): Bovine serum albumin (67 kDa/3.5 nm), Ovalbumin (43.5 kDa/2.7 nm), Carbonic anhydrase (25 kDa/2.1 nm), Cytochrome C (12.4 kDa/1.7 nm) and Aprotinin (6.5 kDa/0.9 nm). The elution volume and Stokes radius of the standards were used to establish afirst calibration curve, from which the Stokes radius of the OSBP constructs were determined. Thereafter, we plotted the Stokes radius as a function of MW for both protein standards and for OSBP constructs.
Fluorescent labeling. DTT present in OSBP (199–324) CYS mutants was removed by buffer exchange on a NAP-5 column (GE healthcare). Proteins were incubated with a 10-fold mol excess of Alexa Fluor (AF) dyes (AF-488 or AF-568) for 1 min at room temperature and then 30 min on ice. For dual labeling, proteins were similarly treated but with afivefold mol excess of each Alexa dye (488 and AF-568). In this particular case, TCEP-containing protein were diluted to reduce TCEP concentration below Alexa dye concentration (1.5 µM total dye/1 µM TCEP). Reaction was stopped by addition of a 100-fold excess ofL-cystein. Excess unbound
dye andL-cyst were removed by elution on a NAP-5 column (GE healthcare). The extent of AF-labeling was estimated by spectrophotometry and by SDS-PAGE analysis on a gel imaging system adapted forfluorescent proteins.
CD. Circular dichroism spectroscopy was performed on a Jasco J-815 spectrometer at room temperature with a quartz cell of 0.05 cm path length. Each spectrum is the average of 10 scans recorded from 195 to 260 nm with a bandwidth of 1 nm, a step size of 0.5 nm and a scan speed of 50 nm min–1. The purified construct OSBP (198–324) was dialyzed in Slide-A-Lyzer dialysis cassette (Thermo) against KCl 150 mM, Tris 10 mM pH 7.5, DTT 1 mM, and was used at 48 µM. Control spectra of buffer alone was subtracted from the protein spectra.
Reconstitution of VAP-A in proteoliposomes. VAP-A was reconstituted in lipid mixture made of 9.5/0.5 w-w egg PC/brain PS by detergent removal using BioBeads
(see refs.51,52). Briefly, DDM solubilized VAP-A was mixed at room temperature
with egg PC/PS liposomes solubilized in Triton X100, detergent/lipid ratio of 2.5 w: w, in 50μl volume. Detergent was removed by additions of wet BioBeads at Bio-Beads/detergent ratio of 20 w:w 2 h/20 w-w 1 h/20 w-w 1 h at room temperature or at a ratio of 40 w-w for 2 h and a second addition of 20 w-w for two more hours at 4 °C. This amount of BioBeads allowed a complete detergent removal50.
Recon-stitution buffer was 50 mM Hepes pH 7.4 and 120 mM potassium acetate (HK buffer), 1 mg/ml lipid, 2.5 mg/ml Triton X100. Protein was added at LPR from 70 to 2800 mol/mol. After reconstitution, proteoliposomes were kept at 4 °C for a maximum of 2 days before use.
VAP-A incorporation into proteoliposome. VAP-A was reconstituted as described above in 9.5/0.5 w:w egg PC/brain PS and 0.5 w/w offluorescent Tx-DHPE, at LPR1400 mol/mol. Then 100μl of VAP-A proteoliposomes were mixed with freshly prepared ice cold 50% w/w sucrose in gradient buffer (Tris pH 7.4, 50 mM, NaCl 150 mM) to getfinal 575 μl of 30% sucrose concentration fraction and loaded at the bottom of a gradient tube (2.5 ml, Ref. 347357 Beckman Coulter). Then 575μl fraction of 20, 10, and 5% sucrose concentration were carefully loaded one after the other to create a discontinuous gradient. Gradient preparation was performed at 4 °C to allow a good separation of sucrose fractions and avoid any mixing.
PI4P transport. Golgi-like liposomes were prepared with 64 mol % egg PC, 17% liver PE, 8% liver PI, 4% PI4P, 5% brain PS supplemented with 2 mol % Rho-PE and 4 mol % PI4P. VAP-A proteoliposomes were reconstituted at LPR 1450 mol: mol in 95% egg PC/5% brain PS, supplemented with 10% cholesterol. Golgi-like liposomes (250 µM lipids) were incubated at 37 °C in HKM buffer with 0.3 µM NBD-FAPP1 PH domain (NBD-PH) and with VAP-A proteoliposomes (250 µM lipid–0.17 µM VAP-A) in a cylindrical quartz cuvette (total volume 600 µl). The sample was continuously stirred with a magnetic bar. PI(4)P transport was fol-lowed by measuring the NBD emission signal at 530 nm (bandwidth 10 nm) upon excitation at 460 nm (bandwidth 1 nm) in a JASCOfluorimeter. At the indicated time, 0.1 or 0.2 µM OSBP was added.
FRET measurement. Fluorescence resonance energy transfer (FRET) was mea-sured in a JASCOfluorimeter. Dual AF-labeled constructs were used at 200 nM. Spectra emission was recorded from 500 to 650 nm (5 nm bandwidth) upon excitation at 494 nm (1 nm bandwith) in the absence or in the presence of 0.5% SDS. Three spectra per condition were normalized at maximal directfluorescence of the donor dye. For measurement of monomer exchange within dimers, we mixed equimolar amounts (100 nM) of AF-488 and AF-568 CC constructs. Spectra were measured every 10 min for CC[V199C] and every 5 min for CC[G324C] (total 20 spectra each). Alternatively, emission was continuously recorded at 594 nm (5 nm bandwidth).
Preparation of galactocerebroside tubes. Galactocerebroside (Galcer) tubes doped with PI4P were prepared according to34. In brief, a mixture of Galcer, egg
PPC, brain PS, brain Pi4P was dried under vacuum. Galcer/egg PC/PS/Pi4P (80/10/ 5/5) tubes were formed at room temperature after resuspension of the driedfilm at 5 mg/ml lipid concentration in HK buffer followed byfive cycles of 10 min vortex, 2 min at 40 °C. GalCer tubes were aliquoted and stored at−20 °C.
Formation of in vitro MCS. VAP-A/N-PH-FFAT and VAP-A/OSBP MCS were formed directly on the cryo-EM grid at room temperature. VAP-A proteoliposomes were diluted at 0.05 mg/ml in HK buffer. Galcer tubes were diluted at 0.15 mg/ml and mixed with NPH-FFAT or OSBP at 70 lipids protein mol/mol ratio.
A 2μl drop of NPH-FFAT or OSBP tubes was immediately loaded on the grid and let incubate for ~1 min, followed by the addition of 2μl VAP-A liposomes. After 30 seconds incubation, grid was blotted and immediately frozen. For cryo-ET experiments, 6 nm gold beads were added before plunging. This protocol was used for all reconstitutions of VAP-A with LPR ranging from 70 to 2800 mol/mol. Cryo-EM experiments. Lacey carbon 300 mesh grids (Ted Pella, USA) were used in all cryo-EM experiments. We found that lacey networks with holes ranging from 20 nm to few microns entrapped different reconstituted material more than cali-brated Quantifoil grids. In all experiments, blotting was carried out on the opposite side from the liquid drop and plunge frozen in liquid ethane (EMGP, Leica, Germany). Samples were imaged using different electron microscopes. Data and 2D images depicted in Fig.1c, Supplementary Fig. 1b–f, Supplementary Fig. 2a–e,
Fig.3c and Supplementary Fig. 3d were acquired with a Tecnai G2 (Thermofisher, USA) Lab6 microscope operated at 200 kV and equipped with a 4k × 4k CMOS camera (F416, TVIPS). Image acquisition was performed under low dose condi-tions of 10 e−/Å2at a magnification of 50,000 or 29,500 with a pixel size of 2.1 or 3. 6 Å, respectively. Plots depicted in Figs.1e,3d were derived from images taken with the Tecnai G2 electron microscope. Data and 2D images depicted in Figs.1e, f,2b, plot Fig.2b were acquired with a Polara (Thermofisher, USA) FEG 300 kV microscope with a K2 Gatan camera in counting mode with 40 frames during 6 sec, total dose 80 e−and at 0.96 Å/px.