Publisher’s version / Version de l'éditeur:
Desalination, 105, 1996
READ THESE TERMS AND CONDITIONS CAREFULLY BEFORE USING THIS WEBSITE. https://nrc-publications.canada.ca/eng/copyright
Vous avez des questions? Nous pouvons vous aider. Pour communiquer directement avec un auteur, consultez la première page de la revue dans laquelle son article a été publié afin de trouver ses coordonnées. Si vous n’arrivez pas à les repérer, communiquez avec nous à [email protected].
Questions? Contact the NRC Publications Archive team at
[email protected]. If you wish to email the authors directly, please see the first page of the publication for their contact information.
NRC Publications Archive
Archives des publications du CNRC
This publication could be one of several versions: author’s original, accepted manuscript or the publisher’s version. / La version de cette publication peut être l’une des suivantes : la version prépublication de l’auteur, la version acceptée du manuscrit ou la version de l’éditeur.
Access and use of this website and the material on it are subject to the Terms and Conditions set forth at
Membrane performance with plug screw feeder pressate: operating
conditions and membrane properties
Dal-Cin, M. M.; Striez, Carolyn; Tweddle, T. A.; McLellan, F.; Ramamurthy,
P.
https://publications-cnrc.canada.ca/fra/droits
L’accès à ce site Web et l’utilisation de son contenu sont assujettis aux conditions présentées dans le site LISEZ CES CONDITIONS ATTENTIVEMENT AVANT D’UTILISER CE SITE WEB.
NRC Publications Record / Notice d'Archives des publications de CNRC:
https://nrc-publications.canada.ca/eng/view/object/?id=c3d5d99f-afbc-488e-a6e0-b123a8ebc946 https://publications-cnrc.canada.ca/fra/voir/objet/?id=c3d5d99f-afbc-488e-a6e0-b123a8ebc946DESALINATION
E L S E V I E R Desalination 105 (1996) 229- 244
Membrane performance with plug screw feeder pressate"
operating conditions and membrane properties*
M . M . D a l - C i n a'*, C.N. Striez a, T.A. T w e d d l e a, F. M c L e l l a n b , P. R a m a m u r t h y ~ ~Institute for Chemical Process and Environmental Technology, National Research Council of Canada, Ottawa, Canada
Fax (613) 941-2529
bAbitibi-Price, Sheridan Park Technology Center, Mississauga, Ontario, Canada cPAPRICAN, Pointe Claire, Quebec, Canada
Received 21 September 1995; accepted 3 December 1995
Abstract
Membrane performance can be significantly affected by operating conditions. The effects of transmembrane pressure and cross flow velocity are discussed for various membranes during ultrafiltration of a pulp mill effluent. The effluent contained suspended solids, colloidal particles such as resin and fatty acids and materials with a wide molecular weight distribution. This effluent had severe membrane fouling characteristics, the nature of which complicated interpretation of the results. A variety of commercially available membranes made with different polymers and pore sizes were evaluated. Permeation experiments were performed using thin-channel, flat sheet, test cells. Cross-flow velocities varied from 0.4 to 1.2 m/s and the transmembrane pressure from 345 to 1,035 kPa. Flux decline occurred by several mechanisms and the selection of the membrane material, pore size and the operating conditions determined the relative contribution of these mechanisms. A modified series resistance model using flux loss ratios qualitatively explained changes in membrane performance under different operating conditions.
Keywords: Ultrafiltration; Fouling; Series resistance model; Pulp mill
1. I n t r o d u c t i o n Pressure-driven membrane processes, including reverse osmosis (RO), nano-, ultra- and micro- M e m b r a n e operations is one o f several
filtration, are o f interest in such applications. c o m p e t i n g technologies which can be used in
These are primarily distinguished by the the pulp and paper industry to meet increasingly increasing pore size or molecular weight c u t - o f f stringent requirements for effluent treatment.
(MWCO). The acceptance o f m e m b r a n e *Issued as NRCC No. 37603. technology has been hampered by fouling which **Corresponding author, results in a decline o f the permeate flux with
0011-9164/96/$15.00 Copyright © 1996 Published by Elsevier Science B.V. All rights reserved
230
M.h/L Dal-Cin et al. /Desalination 105 (1996) 229-244
operating time. This results in larger membrane salinity can be changed or flocculants added to surface area requirements and shorter membrane the feed. Pore plugging is best controlled by life leading to higher capital and operating costs, preventing the solute from entering the membrane Membrane flux decline observed during matrix. This requires selecting a membrane with a permeation is the cumulative effect of several MWCO much smaller than the solute(s). The pore mechanisms. These include adsorption, steric size distribution of the membrane and size hindrance, permeate viscosity, pore plugging, distribution of the feed, if any, should not overlap concentration polarization and gel layer formation, or at least be minimized. Concentration Flux decline due to adsorption can result in pure polarization and gel layer formation are water flux reductions of 80-90% [1]. Steric determined by the hydrodynamics of the hinderance occurs when solutes of sizes membrane module, flux, solute concentration and comparable to the pore sizes retard the flow of molecular weight. Efficient mass transfer at the solvent through the pores [2,3]. If the viscosity of membrane surface minimizes driving force losses the permeate is higher than that of water, fluxes due to osmotic pressure effects and minimizes the will be lower than the pure water permeability thickness of the gel or deposited layer. Mass even in the absence of fouling. Pore plugging can transfer at the membrane surface can be improved occur by adsorption or physical entrapment of a by increasing the shear rate with higher cross flow solute in the pore. The degree of pore plugging is velocities, using turbulence promoters [7] or determined by the relative size of the solute and unsteady flow [8-10].
pore as well as the operating conditions [4]. In this work we have evaluated membrane Concentration polarization describes the accumu- performance with plug screw feeder pressate, lation of solutes at the surface of a membrane due PSFP, under different operating conditions by to the preferential transport of solvent through the varying the mass transfer or cross-flow velocity membrane. The higher solute concentration atthe (CFV) at the membrane surface and the surface increases the osmotic pressure, thereby transmembrane pressure (TMP). Changes in reducing the effective driving force. In an extreme membrane performance observed by varying these case, the concentration at the membrane surface conditions are related to the membrane material may reach levels at which the solute precipitates, and pore size by the contributions of the fouling forms a gel or exhibits non-Newtonian behavior mechanisms. These are measured using a modified [5]. Gel formation may occur over a longer time series resistance model based on flux loss ratios. frame compared to osmotic effects [6] and is
highly dependent on the feed and module
hydrodynamics. In these cases the deposit or gel 2. Theory
can determine the retention characteristics and 2.1. F l u x m o d e l s
represents an additional hydraulic resistance to
permeate flow. The pure water permeation rate through a new Minimization of membrane fouling has membrane can be described by:
obvious benefits; the means to achieve this goal
depend on the dominant fouling mechanisms. The AP
descriptions above suggest when fouling can be J0 - I ~ , , ) (1) expected and point to possible solutions.
Adsorption can be controlled by understanding where AP is the transmembrane pressure drop, and manipulating the membrane-solute inter- is the permeate viscosity and R,, is the resistance actions. This can be accomplished by selecting an due to the membrane alone.
appropriate membrane material or by altering the Flux losses during ultrafiltration occur through properties of the feed, for example, the pH or various mechanisms, which can be modelled
231
M.M. Dal-Cin et al. / Desalination 105 (1996) 229-244
phenomenologically using a series resistance The Rm term can be determined from the pure model. The model has been used in various water flux after rinsing the membrane without forms, consisting of a single hydraulic resistance washing, Jf, using the previously calculated R~ due to the polarized layer to a more general form term. Rcp can be calculated in a similar manner attributing individual resistances to different using Jr. Resistances calculated in this manner are fouling mechanisms [11,12]: often expressed as a percentage of the overall resistance, Rt. The resistances in Eq. (2) have been A P shown (under review) to be dependent on the
Jv = ].t (R m + R a + Rpp + R cp) (2) numerical sequence of their evaluation. Typically, the effect of adsorptive fouling is underestimated and that due to concentration polarization is where Jr is the product rate, Ra, Rpp and R~p are overestimated. The flux loss ratios, D, , for each the resistances to flow due to adsorptive fouling, fouling mechanism are determined as a fraction of pore plugging and concentration polarization or the overall fouling resistance and more accurately gel layer formation, respectively, describe the importance of each fouling mechanism Assuming the permeate viscosity to be the to flux decline. They are expressed as a same and taking the ratio of J0 and Jr gives percentages, including a term for the membrane
itself:
Jo = --Rt - Rrn+Rf - 1 + Rf (3) R f x Jo-J~
J~ R,, R m R m D a = - - x 100 (4)
e,
so-.z,
where R s is the resistance due to all possible fouling mechanisms (Ra+Rpp+Rcp). The individual
resistance components can be determined from the Dpp = - - Rf x J a - J r x 100 (5) pure water permeabilities for membranes at Rt J o - J v
various stages of testing.
The R a term is determined using the pure Rf J f - L
water flux after contacting the membrane with the D~p = - - x x 100 (6)
R, So-L
feed material, Ja, in the absence of a transmembrane pressure for 3 h. Adsorptive
fouling may be more severe under permeation R
conditions with the PSFP. This would be a result D,, = m x 100 (7) of the higher concentrations at the membrane Rt
surface due to polarization. Permeation may also
2.2. Operating variables: effect on flux
expose surfaces deep in the membrane structure to
the effluent which were not accessible in the Operating variables can include parameters such absence of a transmembrane pressure. However, as transmembrane pressure, cross-flow velocity, this would have most likely compromised the temperature and pH. This work concentrated on the estimate for Rpp, particularly for more open (high effects of the transmembrane pressure and cross MWCO) membranes. Concentrating the feed flow velocity. The effects o f p H or additives (such material to simulate polarization conditions was as flocculants or lime) were not studied as they not possible without altering its composition (i.e., may present problems in other unit operations at evaporation would have removed volatile the pulp mill or generate a new waste stream. The components, RO could have removed trace operating temperature will have a significant effect components etc.), on flux via the diffusivity of solutes and fluid
232
M.M Dal-Cin et al. / Desalination 105 (1996) 229-244
viscosity on the retentate side. The most and Schmidt numbers are given by pronounced effect will be on the permeate
viscosity as predicted by the Hagen-Poiseuille dhuo p
flow. R e - and Sc - (10)
With pure water or solvents, the flux will be g pD
proportional to the TMP as described by Eq. (2). where uo and p are the feed velocity and density, The effect of the transmembrane pressure on the respectively. The exponent of R e varied from 0.5 flux with solutions can be described by a mass to 1 depending on the conditions and range of R e
balance of the film theory at the membrane under consideration, but was generally close to surface [13]: 0.75 for turbulent flow and 0.33 for laminar flow. The film theory has been criticized for being ( C p ) ( C _ p p ] overly simplistic. The porosity and roughness of
o
c o -
J~ = ~ In = kin (8) the membrane and changing physical properties
C b - C p ) C b - C p ) are not accounted for. Gekas and Hallstr6m
proposed a friction factor, f , to account for the membrane surface roughness. The changing where Cm, Co, and Cp are the solute concentra- physical properties, viscosity and diffusivity, were tions at the membrane surface, bulk and permeate accounted for by a correction factor (Sc/Scm)
TM,
respectively. D, 6 and k are the solute diffusivity, using properties of the solution at the membrane thickness of the polarized layer and mass transfer surface and in the bulk fluid. Aimar and Field co-efficient. In actual practice the flux increase is [15] criticized this correction factor because it is often much less than expected for a given based on heat transfer analogues for heating. In pressure increase and in some cases the flux may such a situation the fluid viscosity at the wall is remain constant. As the product rate increases, C m lower than the bulk, which is the opposite of that also increases, resulting in a higher osmotic encountered during concentration polarization. pressure. Eventually, increases in the osmotic They suggest an alternative correction factor pressure negate any further gain in the product which can be estimated by
rate and the limiting flux is attained. In the case
o f gel/cake formation, a limiting flux is also \ 027
attained in which the gel/cake layer thickness g ? ] (11) and/or density increase at higher pressures, k = k 0
Increasing the mass transfer coefficient either by changing the cross-flow velocity or module
design results in a higher flux. Gekas and According to Eq. (11), the effective mass transfer Hallstr6m [14] reviewed existing correlations for at the membrane surface will always be less than the Sherwood number and applied them to that predicted by Sherwood number correlations. membrane operations. The Sherwood number is Lahoussine-Turcaud et al. [16] and others have related to the mass transfer co-efficient which is described the deposition of particles by comparing in turn related to the Reynolds and Schmidt their transport velocities towards the membrane numbers, surface to their back transport by Brownian diffusion (uB), lateral migration (uL) or shear in- duced diffusion (Us). The transport velocity to the
Sh - kdh - (constant)Re " S c b (9) surface is approximated by the permeate flux
D
while the back transport velocities can be where d h is the hydraulic diameter. The Reynolds estimated from
233
M.M. Dal-Cin et al. / Desalination 105 (1996) 229-244
kB T 2 u B - ( 1 2 ) --,--- Brownian 3 ~ g r d p o " - - - ° - - - L a t e r a l
S
- - * - - S h e a rpu:a"
o3)
t
32 g r 2 -4 n~ = 2s LMH 0"05 u°d~ (14) D S - 4r2 ~ -swhere kn is the Boltzman constant, r is the radius -10 o f a hollow fiber or the center line distance
between parallel plates, u0 is the center line
-12 . . . .
maximum velocity and dp is the particle diameter.
-3 -2 -1 0 2 3
The particle velocities are approximated in Fig. 1
for the test cells used in this work and using the log (particle diameter)gm
properties of water at 25°C. A typical low Fig. 1. Back transport velocities for lateral migration,
ultrafiltration flux observed in this work was 25 Brownian and shear induced diffusion. Particles smaller LMH, corresponding to 6.94x 10 -6 m/s. The lateral than A will deposit on the membrane surface for a flux of migration velocity determines which particles will 25 LMH.
deposit on the membrane surface for fluxes >25
LMH. Using Eq. (13), this corresponds to particle observed retentions as Cp increases and Cb re- diameters <2.6 microns. Larger particles will mains constant.
deposit at higher fluxes. The effect of the transmembrane pressure or mass transfer on retention with gel layer
2.3. Operating variables: effect on retention formation is difficult to predict. If the gel layer
determines the retention characteristics, the effect When the intrinsic retention, f = I-Cp/C,~, is of pressure may be negligible or cause F to assumed to be constant, then Eq. (8) can be increase. The effect of higher mass transfer rates rewritten to show the effect of the product rate may also be difficult to predict. If the gel is stable and mass transfer coefficient on the observed or thick, then the retention would not be expected
retention, F: to change significantly. When the gel layer is
unstable or very thin, increasing the mass transfer
F = f may disrupt the gel layer. In this situation the
r tent,on may c an e w i .
f + (1 - f ) exp the membrane properties.
The observed retention will decrease if the
3 . M a t e r i a l s
product rate is increased and k is constant. The
observed retention will also decrease when the The feed material used in this work was the mass transfer coefficient decreases. In both PSFP from the chip digester of a semi-chemical situations the solute concentration at the mechanical pulping mill. Samples of PSFP were membrane surface increases, resulting in lower taken during regular operation o f the pulp mill
234
M.M. Dal-Cin et al. /Desalination 105 (1996) 229-244
Table 1 8,300
Composition of PSFP, 100-mesh filtrate
4 , 1 0 0
pH 5.7
Electrical conductivity, I.tf] 5,100 400,000 Dissolved solids, mg/l 12,600
Suspended solids, mg/l 1,700
Total organic carbon, mg/l 5,670 t 1,20o Biological oxygen demand, mg/l 5,250
/
Resin and fatty acids, mg/l 432 5 ~J~d~//~k
Lignin sol, mg/l 2,400 240
Lignin insol, mg/l 1,900 Volatile a acids, mg/l 920
Sugars, m/l 2,680 /-
aPrimarily acetic acid. 0 10 20 30 40
Retention Time (minutes) and refrigerated at 2°C until tested. The feed was
used as received except for prescreening with a Fig. 2. Molecular weight distribution of PSFP as 400 mesh sieve to remove large fibers. A determined by GPC. Molecular weight is shown for summary of the constituents is given in Table 1. selected peaks.
Fig. 2 shows the multi-modal molecular weight
distribution of PSFP components ranging from aoo / -4.0x 10⁶ to <100 Da. The high molecular weight 90
/
material represents cellulosics and lignins. The 80lower molecular weight material -200-400 is ~ 70 most likely sugars and possibly any non-colloidal ~ 60 resin and fatty acids (RFAs) while simple organic cr
acids are represented by the lower molecular ~ 4o5° M ~ ~ - ~ weight peaks. GPC analysis was performed using e ao
a Perkin Elmer Series 3B pump, Waters Model 20 410 RI detector and Waters Ultrahydragel 500, ao! 250 and 125 columns. De-ionized water was used o
as the solvent at 1 ml/min and 40°C. Samples 0.1 1 10 60 were pre-filtered with single use Minisart NML, PARTICLE DIAMETER (ram)
0.45 lam, microfilters from Sartorius.
Particle size distributions were determined for Fig. 3. Typical particle size distribution of PSFP as determined by dynamic light scattering with a PSFP after screening with a 400-mesh sieve. Non- Granoulemeter HR 850. PSFP pre-screened with 400-mesh screened PSFP contains much larger particles sieve.
including wood fibers up to 1-10 mm in
diameter. The particle size distribution of PSFP is being the result of slight changes in the shape of shown in Fig. 3 and was determined with a the distribution or changing the analysis range. Granulometer HR 850 (Cilas-Alcatel). The Particle size analysis (not shown) was also particle sizes covered a broad range from 0.1 I . t m performed using a Malvern Zetasizer 3 for the to 20-60 p.m depending on the size analysis range range 5 nm to 5 p~m. No material was observed used. The upper limit was set by the pre-screening below 0.1-0.5 p,m on repeated measurements. which is equivalent to 37 p.m. The median particle The exact composition and particle size size varied between 1-1 l l.tm with the variation distribution of the PSFP changes constantly and
235 M.M. Dal-Cin et al. / Desalination 105 (1996) 229-244
depends on many variables. Some o f these are the water ad/absorbed in their structure. This mixture current operating characteristics o f the digester, could form a gel on the membrane surface during seasonal variations, source o f wood chips and ultrafiltration [17]. Woerner and McCarthy [18] storage time o f the chips before use. PSFP also described the ultrafiltration flux of Kraft black undergoes undetermined physical/chemical liquor as being dominated by a gel layer. While changes if not refrigerated. These changes occur K B L and PSFP are quite different, lignins in less than 24 h at 50°C and are visually represent a major component o f both liquids and characterized by a darkening o f the samples from were shown to form gels in experiments using a light brown to a darker shade. The odor also model solutions [19].
changes from that o f freshly cut wood to a The membranes used to study the effects o f pungent/acrid character. Feed samples of PSFP in operating variables were a subset o f those used in the UF test system were replaced before these another study with the same PSFP and are
changes occurred, summarized in Table 2. The membranes were
RFAs form colloidal suspensions in water and selected to represent extreme cases o f high/low m a y be associated with other materials in the adsorptive fouling, small and large pore sizes to PSFP. The molecular weight o f RFAs is typically highlight pore plugging, etc. They represent a - 3 0 0 g/mol. Analysis o f feed and permeate broad range of materials and pore sizes. Materials samples showed that ultrafiltration with >I00,000 included PVDF, polysulfone, polyamide-imide, M W C O membranes removed - 7 0 - 9 0 % of the regenerated cellulose and several thin-film RFAs. This suggests that the RFAs exist as composites (TFC). MWCOs ranged from nano- micelles and/or are bound to larger cellulosics, filtration (92% NaC1 retention) to the upper limit lignins or polysaccharides in the effluent. The of ultrafiltration (>500 K MWCO).
larger components may have a fixed amount of
Table 2
Flux loss ratios due to adsorption, pore plugging and concentration polarization/gel layer formation for various membranes with PSFP. D terms evaluated at 0.8 m/s and 345 kPa
Membrane Manufacturer Rated Material % D m % D, % Dpp % D,p MWCO
LSY PVD1 Hydranautics 92% NaCI TFC b 61 48 - 8 - 1
DESAL 5 Desalination 200 TFC 89 -45 66 - 10 PLAC Millipore 1,000 RC ~ 49 11 0 39 T66 NRCC 8,000 PAI d 34 27 17 22 C-10 Hoescht-Celanese 10,000 RC 43 4 -13 66 G50 Desalination Systems 15,000 TFC 45 -51 61 44 T64 NRCC 20,000 PAI 2 88 6 4 C-30 Hoescht-Celanese 30,000 RC 25 -13 6 82 HFM180 Koch 18,000 a PVDF ~ 8 - 9 81 20 GR40 DDS 100,000 PS e N/A GR10 DDS 500,000 PS N/A
aRecently re-rated to 100,000 MWCO by Koch. ~hin-film composite, c Regenerated cellulose. dPolyamide-imide. ° Polyvinylidenefluoride. rPolysulfone.
236
M.M. Dal-Cin et al. / Desalination 105 (1996) 229-244
4. Procedures total organic carbon (TOC, Shimadzu 5000) reduction using
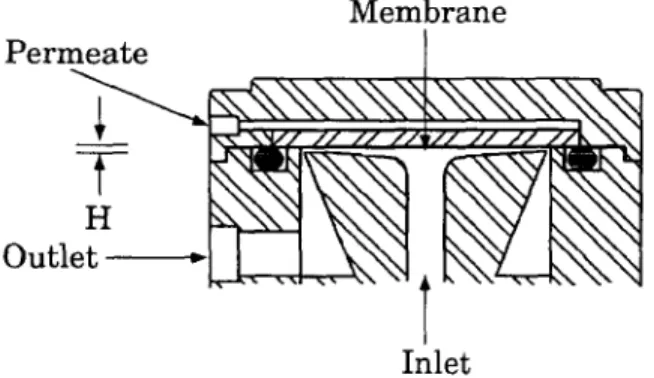
The thin-channel test cells used make use of an impinging feed to promote mixing at the
TOCfeed - TOCl~rmeatc
membrane surface (Fig. 4). The feed enters the F = (16) test cell perpendicular to the center of the circular
TOCf~
membrane coupon and then flows radially to the perimeter where it is collected and goes to the
Permeate samples were generally clear next cell. The effective surface area was 14.5x
solutions and analysed without further processing. 10 -4 m 2 with a channel thickness, H, of 5.08x 10⁴ Suspended solids were removed from the feed m at the periphery. The channel height is samples using a single use filter (Minisart NML, machined such that a uniform velocity profile is 0.2 ~m, Sartorius) and then diluted to the maintained across the radius of the cell. The cross appropriate concentration for TOC analysis. This flow velocities used were 0.4, 0.8 and 1.2 m/s sample treatment may result in TOC values for corresponding to Reynolds numbers of - 400, 800 the feed being underestimated. As this procedure and 1,200, respectively, with water at 25°C. The was used for all samples, performance impinging flow pattern and short flow path comparisons based on retention were valid. promote mixing beyond that expected for the Retentions can be given a global tolerance of ±5% estimated Reynolds numbers. Twelve test ceils even though the accuracy of the TOC is were used simultaneously in a configuration of considerably better at ±1%. The largest source of four parallel banks with three test cells in series, error was associated with the feed sample The pressure drop across a bank of cells was prefiltering and dilution. TOC was used to <14 kPa at 0.8 m/s. evaluate the retention because the method has Permeate from the test cells was recycled to proved reliable in the past, is very fast and the feed tank at all times except during flux economical. The large number of analyses measurements, which were determined performed in the overall study precluded analysis gravimetrically. Permeate collected for flux for individual components or classes of measurements was returned to the feed tank. components such as resin and fatty acids, Negligible volumes were required for retention biological oxygen demand (BOD) or chemical analysis. The observed retention, F, was based on oxygen demand (COD).
The operating temperature was fixed at 50°C to simulate the expected operating temperature of M e m b r a n e a full-scale membrane system. Higher P e r m e a t e / temperatures would increase fluxes, but ~ ~ x , ~ x , Nx,,xx, N ~ x ~ ~ ' ~ ' ~ supplemental heating would be required and may -~___x~/ / / / / / / ~ / / / / / / z / k \ \ ] not be economical. Higher temperatures would e--~--~ ~ , ' ~ ~ ] ~ - ~ . T ~ - - ~ ~ ~ . approaChmembranes.the operating limit of the cellulosic O u t l The experimental procedure adopted was a compromise between achieving true steady-state performance, avoiding complications due to aging Inlet feed and expected hysterisis due to pressure effects. Membranes were operated at 345 kPa and
Fig. 4. Cross-flow rest cell configuration. Effective 0.8 m/s for one day with 10 i of PSFP until
permeation area is 14.5x10 -~ m 2. The channel height, H, at f l u x e s h a d s t a b i l i z e d . A s t a b i l i z a t i o n s t a g e w a s
237 M.M. Dal-Cin et al. /Desalination 105 (1996) 229-244
" The feed was replaced with a new 10 1 sample
,,--4
of PSFP after the initial 24 h period and fluxes o ", allowed to stabilize again. The feed sample was c'2 _\~ • LSY PVD1 changed to avoid confusing the effects of \ --- • HFTx.~ 180 changing operating conditions with those of aging o \ ~ Y feed. A new 10 1 sample of PSFP was added o Z"~. before each pressure increase (690 and 1,035 kPa) l [ - ~ and fluxes were allowed to stabilize before .~ changing the operating conditions. All the PSFP ~-~ c~ ... ~_7 . . . _~ came from a single 200 1 batch. As will be seen T ~ in the Results and Discussion, the stabilization ~ times were not sufficient and complicated
interpretation of the results.
The effects of pressure and cross-flow velocity o were studied using a three-level factorial design at
- : f
all combinations of pressure and cross-flow
I
~ i j i ... ~ . . . . - _ ~ - - - - 4 i velocity. Pressures were 345, 690 and 1,035 kPa o and cross-flow velocities were 0.4, 0.8 andO,?
1.2 m/s. The relationship between flux and pressure may display some hysterisis due to pore o ~ L plugging effects. This hysterisis would be more 0 tO 20 30 pronounced with large pore membranes and T I M E
(h)
higher transmembrane pressures. As such, replicates at the center point or the standard Fig. 5. Initial flux decay for HFM 180 and LSY P V D 1 operating conditions (0.8 m/s and 345 kPa) would membranes showing longest and shortest stabilization not be useful for obtaining estimates of the times, variance associated with the flux or separation. This also required that fluxes always be evaluated varying the operating conditions with time on- at increasing pressures. The cross-flow velocity line. Fig. 5 shows the flux stabilization of the was varied in the sequence 0.8, 1.2 and 0.4 m/s at HFM 180 and LSY PVD1 membranes. Large a given pressure. Relatively large increments in changes in flux were observed during the initial the TMP and CFV were used because of problems permeation time for the HFM 180 membrane. Theassociated with aging feed, hence the use of only HFM 180 membrane required the longest three levels. The test sequence is given in stabilization time of all the membranes while
Table 3. stable fluxes were attained within 2 h with the
The same membranes were used throughout all LSY PVD1 membrane. The GR40, GR10, G50, the tests to allow easier comparison of membrane T64 and T66 membranes also required long
stabilization times. In general, fluxes stabilized performance under different testing conditions. within 2-10 h for the remaining membranes. The Changing membranes may have resulted in the error in gravimetric flux measurements was <2% effect of the different operating conditions being and may be considered negligible compared to the masked by differences in the membrane samples. Membranes were not cleaned between different error introduced by insufficient stabilization time
or replicates with different membranes. A global operating conditions as previous cleaning studies error term of+10% is used in the figures showing using Ultrasil 10 were only partially effective in fluxes, restoring membrane performance. Cleaning was
238
M.A£ Dal-Cin et al. / Desalination 105 (1996) 2 2 9 - 2 4 4
Table 3
Fluxes of various membranes with PSFP at different operating conditions. Data are sorted based on the TMP and increasing cross-flow velocity at a given TMP
Membrane Flux (LMH) Flux 10
Flux 1 (%) LSY PVD1 25 27 26 28 48 54 34 45 51 20 74 DESAL 5 24 25 23 36 58 56 44 56 82 24 94 PLAC 33 33 31 35 56 57 37 50 47 19 58 T66 44 45 41 43 57 77 44 60 83 36 81 C-10 85 82 83 58 117 |42 53 111 76 35 43 G50 59 58 55 45 64 93 48 73 71 47 81 T64 24 28 27 34 43 44 35 45 43 18 65 C-30 90 119 115 73 143 160 65 133 87 43 36 HFMI80 83 91 94 47 81 101 43 69 67 30 33 GR40 84 101 98 50 87 99 43 70 63 29 29 GR10 17 21 21 20 23 22 21 23 23 8 38 Flow, m/s 0.4 0.8 1.2 0.4 0.8 1.2 0.4 0.8 1.2 0.8 Press, kPa 345 345 345 690 690 690 1,035 1,035 1,035 345 Order 3 1 2 6 4 5 9 7 8 10
least effective with high MWCO (>30,000) evaluated at a fixed set o f operating conditions, membranes which were fouled by pore plugging. 345 kPa and 0.8 m/s. The relationship between Cleaning would have also required longer membrane material and adsorptive fouling is stabilization periods for each set of operating illustrated by the D , terms. Low adsorptive conditions increasing the potential o f problems fouling was observed with regenerated cellulose associated with aging feed samples, membranes with D a ranging from - 1 3 to 1 I%.
The TMP range was limited to 345-1,035 kPa Regenerated cellulose membranes have often been (50--150 psig) due to the operating limits o f plate shown to exhibit low adsorptive fouling, and frame or tubular modules. Spiral-wound particularly with proteins [3,20]. Flux loss ratios modules would not be suitable for this feed due to for the GR40 and GR10 membranes were not the potential for channel plugging and need for determined. However, polysulfones exhibited extensive pretreatment to remove suspended severe adsorptive fouling with PSFP; JIJo ratios solids. The upper limit o f the cross-flow velocity averaged 41% and 22% for polysulfone and was determined by the pressure drop in the test polyethersulfone, respectively [21].
cells and pumping capacity. The lower limit o f The effect of the pore size or M W C O on the 0.4 m/s was chosen because concentration flux loss ratios is largely seen in the Dpp term. polarization becomes significant under these High MWCO membranes such as the HFM180 conditions even with very low (200 ppm) have significant pore plugging, Dw=81%. concentrations o f polyethylene glycol in the test Membranes such as the PLAC have significant D m
cells used. and Dcp terms. The PLAC membrane material
(regenerated cellulose) and M W C O (1,000 5. Results and Discussion Daltons) suggest that both D~ and Dpp would be
5.1. Flux loss ratios minimal.
The relative magnitudes o f each fouling The flux loss ratios for the different fouling resistance would change under different operating mechanisms are summarized in Table 2 and were conditions. The Dcp term would increase at lower
239
M.M. Dal-Cin et al. / Desalination 105 (1996) 229-244
CFVs or higher TMPs. Higher pressures would o C3 also increase the
Dpp
t e r m for open membranes c~CFV such as the HFM180 or GR40. ~ ~ A 12 m / s
A D. term was not given for the Desal 5 and ~ C 3 0 ] [] 0.8 rrl/,s G50 membranes because of the unusual behavior ~ [] 0.4 m / s
where
Ja
>J0. The experimental procedure where ocoupons are removed and re-installed may account "-" [] T for small changes in the flux. Cases with JffJo
ratios >1.4 were attributed changes in the ~ " ~ ~
membrane morphology. The membranes were ~ -~ ~ ~ T pressurized with RO water for 5 h but not cleaned ~ ~ -
X - T prior to adsorption tests. This is an unlikely cause ~ ~ ~
± ~ T ±
of
Ja>Jo
a s it is difficult to argue that PSFP had f~ ~ .~any cleansing ability. A detailed discussion on this • ~ r behavior was given in a previous article [21]. i Z - - - _ ~
5.2. C h a n g e s in f l u x .z ° ~ ~
The flux data for the various combinations of
operating conditions are summarized in Table 3. L S Y PVD1
O ~ I - - I 1
Patterns in flux behavior are more easily seen in 200 400 600 800 1000 1200 graphical form, and several cases will be
TMP (kPa)
highlighted. The changes in membrane perfor- mance were highly dependent on the membrane
and the flux loss ratios. Fig. 6. Flux behavior of LSY PVD1 and C-30 at various operating conditions.
The flux is shown as a function of the CFV and TMP for the LSY PVD1 membrane in Fig. 6.
At a cross-flow velocity of 1.2 and 0.8 m/s the limiting flux was reached. Under these conditions flux shows a limiting behavior above 690 kPa. increasing the CFV from 0.4 to 0.8 m/s did When the TMP was increased from 345 kPa to increase the flux.
690 kPa, the flux increased from ~27 LMH to 48 The C-30 membrane exhibited unusual and 54 LMH at 0.8 and 1.2 m/s, respectively. At behavior; at 0.4 m/s the flux decreased slightly at the lowest cross-flow velocity, the limiting flux higher pressures (Fig. 6). At 0.8 m/s the flux had almost been attained at 345 kPa. A three-fold increased only slightly at higher TMPs. At increase in the TMP only increased the flux from 1.2 m/s the flux exhibited a noticeable maximum 24 to 34 LMH rather than the 75 LMH expected at 690 kPa dropping to less than the 0.8 m/s flux in the absence of polarization effects, at 1,035 kPa. Similar behavior was observed with
The behavior of the LSY PVD1 membrane the C-10, G50 and PLAC membranes.
was consistent with its flux loss ratios. At the The flux behaviour of the GR10 membrane is standard conditions the flux was dominated by D~ shown in Fig. 7. The overall impression is that
and D a . At 345 kPa the cross-flow velocity had the flux is insensitive to the operating conditions.
no effect on the flux as would be expected as D~p While the flux loss ratios for the GR10 membrane -- -1%. As the TMP was increased at 0.4 m/s, D~p were not determined, one can predict that D, and began to dominate as more material was then Dpp would dominate given that the membrane transported to the membrane surface and the material is polysulfone and the high 500,000
240
M.M. Dal-Cin et al. /Desalination 105 (1996) 229-244
o pores [11,22-25]. Pore plugging would reduce the CFV effective pore size, predominantly blocking the o ~ 1.2 rn/s largest pores. The larger pores, while representing H F M 1 8 0 [] 0.8 m / s a small fraction of the total number of pores, • 0.4 m / s account for a much larger fraction of the total o ; flow. Blocking the larger pores can greatly reduce ~ ~ l z ~ , the flux as was seen with the HFM180. This
i
± \
N behavior was also observed for several other ~ ~ / " ~ membranes, GR40, C-10,~ " ~ ~ membranes at higher TMPs. This behavior was C-30 and PLAC
~ - ~ " ' " ~ i expected for the GR40 because of its high × MWCO rating of 100,000 but not for the PLAC and C-10 (1,000 and 10,000 MWCO, respect- ively). The pore plugging observed with lower o ~ - - - ~ - - ° MWCO membranes was most likely the result of
,~f _a_
the wide range of solute sizes in PSFP and did not become a problem until the highest TMP was " " ; used.
O 4 [] _ _ _ - - - • Cx/
• ~ Pore plugging appears to have been a function G R 10 of time as well as pressure. Pore plugging ~ ~ ~ - - T occurred rapidly at a given pressure with the 200 400 600 800 1000 ~ 2 0 0 HFM180 because of its high MWCO, but
TMP (kPa)
occurred at a slower rate with lower MWCOmembranes and only at higher pressures. The Fig. 7. Flux behavior of HFM 180 and GR10 at various unusual behavior of the C-30, C-10, G50 and operating conditions. PLAC membranes described earlier is most likely due to insufficient stabilization times, particularly MWCO. The flux would not be expected to at 1,035 kPa. The flux with these membranes at change significantly in this situation. Unlike the 1,035 kPa was not correlated with the CFV as LSY PVD1 membrane, increasing the TMP with would be expected. Instead the flux decreased as the GR10 membrane would only increase /)pp. a function of the run order.
Therefore, increasing the cross-flow velocity would not be expected to increase the flux.
The flux of the HFM180 membrane was
5.3. Changes in retention
dominated by pore plugging with Dpp = 81%
(Fig. 7). The flux changed little at 345 kPa when Retentions based on TOC are reported in the cross flow velocity was increased as D~p was Table 4. The retention data are categorized by the relatively small at 20%. At a given CFV, the flux TMP and further sorted according to the CFV at decreased as the TMP was increased. This was a given TMP. Given the +5% accuracy of the not unexpected given that pore plugging was the retentions, a overall change of 10% is required dominant flux decline mechanism, even at the before a significant change can be assumed at a lowest TMP. The high MWCO also suggested that given TMP. Cases where the CFV had a pore plugging would become more dominant at significant effect on retention are shaded. For the higher pressures, example, the cross-flow velocity had an effect on High MWCO membranes typically have wide the retention with the HFM180 membrane at pore size distributions, skewed toward the larger 345 kPa but not at 690 or 1,035 kPa.
241
M.M. Dal-Cin et al. / Desalination 105 (1996) 229-244
Table 4
TOC retentions of various membranes with PSFP at different operating conditions. Data are sorted based on the TMP and increasing cross-flow velocity at a given TMP and then by time on-line which corresponds to the run number.
Membrane Retention (%) LSY PVD1 88 88 89 92 91 91 95 91 94 90 DESAL 5 92 91 92 94 94 93 97 93 96 96 PLAC 50 56 67 74 66 68 85 67 73 71 T66 77 75 80 85 81 83 88 85 88 85 C-10 34 35 43 57 45 44 61 52 55 54 G50 71 64 73 81 77 77 82 81 82 80 T64 80 77 79 86 82 82 90 86 88 88 C-30 30 2 5 39 52 36 40 66 52 50 51 HFM180 49 38 54 66 58 60 66 60 63 56 GR40 43 2 5 5 3 63 58 55 70 62 68 60 i GR10 66 42 65 69 59 62 7 9 67 68 76 Flow, m/s 0.4 0.8 1.2 0.4 0.8 1.2 0.4 0.8 1.2 0.8 Press, kPa 345 345 345 690 690 690 1,035 1.035 1,035 345 Order 3 1 2 6 4 5 9 7 8 10
The effect o f the cross-flow velocity on layer but not remove it. This would cause little or retention was often insignificant when considering no change in the retention but would change the the error. Indeed when looking at specific cases flux as was discussed earlier. The formation o f a for one membrane at a given pressure, gel or cake layer is likely considering the nature inconsistent results were obtained when changes o f the PSFP and the earlier discussion regarding in retention were significant. According to particle deposition. The preferential plugging o f Eq. (15), increasing the CFV should result in larger pores which was responsible for flux increased retentions by reducing the concentration decline would also result in higher retentions. at the membrane surface. This was only observed Comparing the retentions of run 10 and 1 under for the PLAC membrane at 345 kPa where the same test conditions shows significant retentions monotonically increased with the cross- retention increases (10-35%) for all the flow velocity. The retention data are presented in membranes with the exception o f LSY PVD1 and Fig. 8 in the run order sequence, showing that Desal 5.
retentions increase at higher TMPs and time on-
line. 6. Conclusions
Lower retentions would be expected at higher Severe fouling was observed during ultra- pressures as Jv in Eq. (15) is increased, causing filtration o f plug screw feeder pressate from a more polarization. The increasing retention in pulp mill with a large range of membrane runs 1 through 9 could be explained by pore MWCOs and materials. Flux reduction occurred plugging and/or gel formation at the membrane due to adsorption, pore plugging and surface. The insensitivity o f the retention to concentration polarization effects and was increasing CFVs was consistent with a gel or cake quantified by a modified series resistance model which controlled the retention. If the gel or cake using flux loss ratios.
is o f sufficient thickness, then varying the cross- The nature o f PSFP was such that all these flow velocity could change the thickness of the fouling mechanisms could occur simultaneously.
2 4 2
M.M. Dal-Cin et al. / Desalination 105 (1996) 229-244
o
o required to attain higher fluxes. Fluxes showed , / [ ] ~ f o _ ~z~ I D little change or decreased in response to changing ~z t° - D - o - - u ~ u - ~ j operating conditions with membranes for which 0 _ ~ 0 ~ 0 ~
D a and
Dpp
dominated.o Retentions based on TOC reduction generally
c O - £
increased at higher TMPs. Retentions increased by ,~ - 20% to - 45% for open membranes with o ? ~ % ~ , , ~ I i . ~ / smaUer increases (e.g., 6%) with tight membranes
~ - : x ~ J (<1,000 Da MWCO). This was the result of pore / + / ' / ~ Z plugging changing the pore size distribution, © ~//~/~'~/~//\+ / / / particularly with high MWCO membranes. Retentions did not decrease with higher cross-flow O ~ velocities at a given pressure as would be expected in the case of concentration polarization , / \ x ~ [] Desal 5 or osmotic pressure limited flux. This suggests /
o LSY PVD1 that that pore plugging may have been continuing
o ~x G R i 0
o + HFM 180 and that a gel or cake layer was determining the x C 10 retention. The presence of large particles, gel
o C 30 ~ forming lignins and the RFA action as a binder
further support the formation of a gel or cake. Selection of an appropriate membrane for O I I - I - T - - -
0 2 4 6 8 10 ultrafiltering PSFP requires attention to all aspects R u n N u m b e r of the membrane and the operating conditions. RFAs and other organic compounds resulted in F i g . 8. T O C r e t e n t i o n a s a f u n c t i o n o f t h e r u n n u m b e r , severe adsorptive fouling with several membrane materials. The solute size distribution also The effect of cross-flow velocity and trans- required that the membrane pore size or MWCO membrane pressure on membrane flux have been and TMP be considered simultaneously to avoid shown to depend on the flux loss ratios for a pore plugging. Module hydrodynamics (con- given membrane, figuration and CFV) must also be optimized to
Pore plugging was a significant fouling minimize gel or cake formation.
mechanism with a wide range of MWCOs and High TOC retentions (96%) were obtained was attributed to the wide particle and solute size with the Desal 5 membrane with a flux of distribution of PSFP. High MWCO (>50,000 Da) 82 LMH at 1,035 kPa, 1.2 m/s CFV and 50°C. membranes with significant
Dpp
terms were Negligible flux decline was observed with this susceptible to pore plugging at 345 kPa. membrane, the material and MWCO (200 Da) Membranes with MWCOs as low as 1,000 Da minimized adsorption and pore plugging. were affected by pore plugging but required However, this membrane could not be used in its higher TMPs. Insufficient time was allowed for typical spiral wound configuration without pore plugging to stabilize at high TMPs for these significant pretreatment. The highest flux was membranes, obtained with a C-30 membrane, 160 LMH at The resistance due to polarization began to 690 kPa, 1.2 m/s CFV and 50°C, but the retention control the flux at higher TMPs in the absence of was much lower at 52%. Long-term testing must pore plugging. When the "limiting flux" was be undertaken to verify that pore plugging would reached, higher cross-flow velocities were not progress further with this membrane.243
M.M. Dal-Cin et al. / Desalination 105 (1996) 229-244
7. S y m b o l s Greek
Cb - - solute concentration in the bulk 6 - - thickness o f the polarized layer, m solution, kg/m 3 ktb - - v i s c o s i t y o f bulk feed solution, C,n - - s o l u t e concentration at the m e m - kg/m/s
brane surface, kg/m 3 ktm - - v i s c o s i t y o f feed solution at the Cp - - solute concentration in the permeate, membrane surface, kg/m/s
kg/m3 9 - - density, kg/m 3
D - - solute diffusivity, kg/m 3 u B - - Brownian diffusion, solute/particle d h - - hydraulic diameter, m back transport velocity, m/s
dp - - particle diameter, m u L - - Lateral transport velocity o f solute/
f - - intrinsic retention particle, m/s
F - - observed retention u s - - shear induced solute/particle back H - - f l o w channel height at perimeter o f transport velocity, m/s
test cell, m
J~ - - PWP after adsorptive fouling, l/m:/h
JI - - P W P o f m e m b r a n e after permeation A c k n o w l e d g e m e n t s
with feed solution, l/mZ/h The authors would like to acknowledge Herv6 Jv - - Product rate, 1/mZ/h; flux through a
Buisson o f the Wastewater Treatment Centre for m e m b r a n e with any type o f feed membrane samples and helpful discussions. Also, solution f r o m I.C.P.E.T., we would like to thank: Chung
Jo - - Pure water permeation rate, 1/m2/h; M i n g T a m and Ashwani K u m a r for discussions, flux through a m e m b r a n e with pure Joanne Richard and Karen L a m b for performing
water only permeation experiments and John Woods for GPC
k - - mass transfer coefficient, m/s
k B - - Boltzman constant, J/K analysis. L M H - - flux, 1/m2/h
References M W C O - - m o l e c u l a r weight cut off, Daltons;
by convention, the molecular weight [11 J.H. Hanemaaijer, T. Robbertsen, Th. van den at which a membrane retains 90% o f Boomgaard and J.W. Gunnink, Desalination, 68
that solute (1989) 199.
A p - - t r a n s m e m b r a n e pressure drop, driv- [2] C.M. Tam and A.Y. Tremblay, J. Membr. Sci., 57 (1991) 271.
ing force for permeation [3] S. Nakatsuka and A. S. Michaels, J. Membr. Sci,, 69 r - - internal radius o f a hollow fiber, m (1992) 189.
Re - - R e y n o l d s number [4] G. Belfort, J.M. Pimbley, A. Greiner and K.Y. R~ - - serial resistance due to adsorptive Chung, J. Membr. Sci., 77 (1993) 1.
fouling, s -~ [5] W.F. Blatt, A. Dravid, A.S. Michaels and L. Nelsen, in: J.E. Flinn (ed.), Membrane Science and
R h - - serial resistance due to osmotic Technology, Plenum Press, New York, 1970, p. 47. pressure or gel/cake layer, s -~ [6] C.W. van Oers, M.A.G. Vorstman, W.G.H.M, R m - - hydraulic resistance o f a new Muijselaar and P.J.A.M. Kerkhof, J. Membr. Sci., 73
m e m b r a n e , s -~ (1992) 231.
Rpp - - s e r i a l resistance due to pore [7] A.R. Da Costa, A.G. Fane and D.E. Wiley, J.
plugging, s -t Membr. Sci., 76 (1993) 245.
Sc - - Schmidt number [8] V.G.J. Rodgers and R.E. Sparks, AIChEJ., 37(10) (1991) 1517.
Sh - - Sherwood number [91 E. Spiazzi, J. Lenoir and A. Grangeon, J. Membr. Uo - - bulk feed flow velocity, m/s Sci., 80 (1993) 49.
244
M.M. Dal-Cin et al. /Desalination 105 (1996) 229-244
[I0] H.B. Winzeler and G. Belfort, J. Membr. Sci., 80 [19] D. Woemer and J.L. McCarthy, Tappi J. 70(3)
(1993) 35. (1987) 126.
[11] A.G. Fane, C.J.D. Fell and A.G. Waters, J. Membr. [20] M.K. Ko and J.J. Pellegrino, J. Membr. Sci., 74
Sci. 9 (198l) 245. (1992) 141.
[12] A.-S. JOnsson, J. Membr. Sci. 79 (1993) 93. [21] M.M. Dal-Cin, C.N. Striez, T.A. Tweddle, C.E. [13] A.S. Michaels, Chem. Engng. Prog. 64(12) (1968) Capes, F. McLellan, and H. Buisson, Desalination,
31. 101 (1995) 155.
[14] V. Gekas and B. HallstrOm, J. Membr. Sci. 30 (1987) [22] M. Meireles, P. Aimar and V. Sanchez, J. Membr.
153. Sci., 56 (1991) 13.
[15] P. Aimar and R. Field, Chem. Eng. Sci., 47(3) [23] M. Meireles, P. Aimar and V. Sanchez, J. Membr.
(1992) 579. Sci., 91 (1994) 293.
[16] V. Lahoussine-Turcaud, M.R. Wiesner and J-Y. [24] K.M. Persson, G. Capanelli, A. Bottino and G. Bottero, J. Membr. Sci., 52 (1990) 173. Trfig~dh, J. Membr. Sci., 76 (1993) 61.
[17] P. Ramamurthy, R. Poole and J.G. Dorica, J. Pulp [25] L.E.S. Brink, S.J.G. Elbers, T. Robbertsen and P. Pap. Sci., 21(2) (1995) 50. Both, J. Membr. Sci., 76 (1993) 281.
[18] D. Woerner and J.L. McCarthy, AIChE Symp. Ser. 232(80) (1984) 25.