Publisher’s version / Version de l'éditeur:
Journal of Thermal Insulation and Building Envelopes, 20, April, pp. 301-319,
1997-04-01
READ THESE TERMS AND CONDITIONS CAREFULLY BEFORE USING THIS WEBSITE. https://nrc-publications.canada.ca/eng/copyright
Vous avez des questions? Nous pouvons vous aider. Pour communiquer directement avec un auteur, consultez la première page de la revue dans laquelle son article a été publié afin de trouver ses coordonnées. Si vous n’arrivez pas à les repérer, communiquez avec nous à PublicationsArchive-ArchivesPublications@nrc-cnrc.gc.ca.
Questions? Contact the NRC Publications Archive team at
PublicationsArchive-ArchivesPublications@nrc-cnrc.gc.ca. If you wish to email the authors directly, please see the first page of the publication for their contact information.
NRC Publications Archive
Archives des publications du CNRC
This publication could be one of several versions: author’s original, accepted manuscript or the publisher’s version. / La version de cette publication peut être l’une des suivantes : la version prépublication de l’auteur, la version acceptée du manuscrit ou la version de l’éditeur.
Access and use of this website and the material on it are subject to the Terms and Conditions set forth at
Measurements and two-dimensional computer simulations of the
hygrothermal performance of a wood frame wall
Geving, S.; Karagiozis, A. N.; Salonvaara, M. H.
https://publications-cnrc.canada.ca/fra/droits
L’accès à ce site Web et l’utilisation de son contenu sont assujettis aux conditions présentées dans le site
LISEZ CES CONDITIONS ATTENTIVEMENT AVANT D’UTILISER CE SITE WEB.
NRC Publications Record / Notice d'Archives des publications de CNRC:
https://nrc-publications.canada.ca/eng/view/object/?id=cbb77a19-07e8-41be-893f-1026cb453c1c https://publications-cnrc.canada.ca/fra/voir/objet/?id=cbb77a19-07e8-41be-893f-1026cb453c1chttp://www.nrc-cnrc.gc.ca/irc
M e a sure m e nt s a nd t w o-dim e nsiona l c om put e r sim ula t ions of t he
hygrot he rm a l pe rform a nc e of a w ood fra m e w a ll
N R C C - 4 1 0 7 9
G e v i n g , S . ; K a r a g i o z i s , A . N . ; S a l o n v a a r a , M .
A p r i l 1 9 9 7
A version of this document is published in / Une version de ce document se trouve dans:
Journal of Thermal Insulation and Building Envelopes, 20, April, pp. 301-319,
April 01, 1997
The material in this document is covered by the provisions of the Copyright Act, by Canadian laws, policies, regulations and international agreements. Such provisions serve to identify the information source and, in specific instances, to prohibit reproduction of materials without written permission. For more information visit http://laws.justice.gc.ca/en/showtdm/cs/C-42
Les renseignements dans ce document sont protégés par la Loi sur le droit d'auteur, par les lois, les politiques et les règlements du Canada et des accords internationaux. Ces dispositions permettent d'identifier la source de l'information et, dans certains cas, d'interdire la copie de documents sans permission écrite. Pour obtenir de plus amples renseignements : http://lois.justice.gc.ca/fr/showtdm/cs/C-42
Measurements and Two-Dimensional
Computer Simulations of the
H ygrothermal Performance
of a Wood Frame Wall
STIG GEVING*
Department of Building and Construction Engineering The Norwegian University of Science and Technology (NTNU)
Alfred Getz v 3, N-7034 Trondheim, Norway
ACHILLES KARAGIOZIS
National Research Council Canada Institute Jar Research in Construction
Building Performance Laboratory Montreal Road, Bldg. M-24 Ottawa, ant. K1A OR6, Canada
MlKAELSALONVAARA
VTT Building Technology Building Physics
Po. Box 1804 FIN-02044 VTT, Pinland
ABSTRAcr: Knowledge of the expected long-term performance of building envelopes subjectedtosimultaneous heat and moisture transport is critical during the design stage. In the past thirty years researchers have concentrated their efforts in extensive laboratory experiments. These experiments have been expensive as well as time consuming to conduct due to the slow moisture transport phenomena. This paper critically investigates a set of experimental results generated from laboratory
*Author to whom correspondence should be addressed.
J. THERMAL INSUL. AND BLDG. ENVS. Volume20-April 1997 301
1065-2744/97/04 0301-19 $10.00/0 ©1997 Technomic Publishing Co., Inc.
300 Canada Mortgage
haust air side, or both. This is necessary to ensure that the ventilation air
supplied, or induced, into a house will be adequately distributed through all
rooms. Accordingly, builders, designers, and mechanical contractors must make adequate provision for ventilation air distribution ductwork in new house construction and large renovation activities where mechanical ventila-tion is necessary.
Although distribution is a significant consideration in the design and in-stallation of ventilation systems, other important factors such as energy effi-ciency, occupant comfort, and ease of operation must also be considered.
A full report on this research project is available from the Canadian Housing Infor-mation Centre.
The Canadian Housing Information Centre
Canada Mortgage and Housing Corporation 700 Montreal Road
Ottawa, Ontario
KIA OP7
Telephone: (613) 748-2367 FAX: (613) 748-2098
NarE FROM THE EDITOR
The following technical note describes the same project from a research perspective. By placing these two notes next to each other we have provided the reader with a much broader perspective on this new and challenging area of building systems performance.
302 STIG GevING, ACHILLES KARAGIQZIS AND MIKAEL SALONVAARA
controlled measurements on a wood frame wall construction,by employing a state of the art hygrothermal model. The analysis was carried out using the LATENITE model, a three-dimensional heat and moisture transport program tailored specifically for building envelope investigations. For the present simulations this model was adapted for two-dimensional conditions and hourly hygrothermal performances were predicted for a laboratory instrumented wood frame wall section. The investigation showed three main advantages of combining measurements and simulations. By carrying out simulations early in the design stage of laboratory experiments the experimental design will probably yield better quantification of data, placement and types of sensors, and assessment of workmanship influences, etc. Measurements can calibrate, adapt, or check calculated results. Finally, simulations can be performed to explain and interpret experimental results. Marrying experi-ments and modeling allows researchers to generate effective hygrothermal perfor-mance guidelines.
KEY WORDS: wood frame waU, moisture transport, laboratory experiments, hygrothermal model.
INTRODUCTION
H
YGRaTHERMAL (COMBINED HEAT, air, and moisture) performance of building envelopes dictates to a large extent the durability and service life of the building envelope. Deterioration can occur in various forms, i.e., surface damage discolourization by efflorescence, ageing processes, chemical damages, moisture induced salt migration, structural cracking due to ther-mal and moisture gradients, corrosion of steel, and mould or bacteria growth.An extensive amount of literature exits on laboratory testing of various building envelope systems such as Thue et a!. [1]. Unfortunately, a limited amount of consistent information can be extracted for moisture control design guidelines. One reason is that to date a reliable measurement probe for moisture content is not widely available. Indeed in most experimenta-tion, oni y few spot moisture content measurements are made and these are usually associated with rather high levels of uncertainty. Furthermore, in almost all experimental building envelope studies, modeling has not been used in the design of the experiments. This has resulted in improper posi-tioning of moisture and temperature sensors and documentation of the workmanship defects or non-idealities.
Recently, hygrothermal models have been used in many interesting build-ing envelope applications [2]. The hygrothermal performance of wood frame walls has been investigated by the use of simulations in several pub-lications, but most of these have employed a one-dimensional approach. Tsongas et a!. [3] analysed the moisture performance of different wood frame wall designs in different climate situations using a one-dimensional
Compufer Simuu,tions qfthe Hygrothermal Performatueqfa Wood Frame Wall 303
heat and moisture model. Hagentoft and Harderup [4] investigated the
importance of a vapor retarder and air leakage of a wood frame wall with cellulose loose flll insulation, also employing a one-dimensional model. Only a few two-dimensional simulations of the heat-air and moisture
behavior of wood frame structure exist such as [5] where the effect of
exflltration on the hygrothermal behavior was investigated.
In this project, a critical analysis is performed on a particular laboratory
experiment of a wood frame construction wall, employing a state of the art
hygrothermal model. The LATENITE three-dimensional model was employed to critically review the measured hygrothermal performance of the wood frame construction wall. The LATENITE research model allows treatment of the building envelope system with coupled heat and moisture
transport via diffusion and natural and forced convective air transport,
capil-lary, and gravity flow mechanisms. This model permits the "capturing" of
the various systems and subsystems anomalies of the building envelope and
can be employed in analysis of laboratory experimental hygrothermal
results. In this paper, the moisture content, and temperature distributions at various locations in the wall were critically compared between laboratory measurement and two-dimensional computer simulations.
DESCRIPTION OF WALL EXPERIMENTS
This section gives a brief description of experiments conducted by
Bigseth [6] to determine the hygrothermal performance of highly insulated
wood frame walls. Tests were performed on six different wood frame walls in climatic chambers that were exposed to a sequence of winter conditions with cold external climate interrupted with short warm periods for a dura-tion of sixty-eight days. In this investigadura-tion only one of the construcdura-tions
was modeled. The wall system modeled was air- and vapor-tight on all
boundades, so any moisture movement within the wall assembly was due to internal redistribution only. This wall is not a typical construction, but is designed for laboratory experiments.
The wall section employed the following layers starting from the cold side: a 10 mm wood fiber board, a 0.15 mm PE-foil, 300 mm glass fiber batt insulation (density 18 kg/m'), a 0.15 mm PE-foil, and a 9.5 mm gypsum
board. Detailsof the construction are shown in Figure 1. The overall dimen-sions of the wall section were 1190 mm X 2390 mm, with stud and bottom/ top plates dimensions 006 mm X 300 mm (i.e., 98 mm
+
198 mm). APE-foil isolated the test wall perimeter from the surrounding constructions in terms of mass transfer (air and vapor), and adiabatic conditions at the wall perimeter with respect to heat transfer was present.
tempera-304 5TlG GEVING, ACHillESKARAGIOZIS ANDMlKAElSALONVAARA
36x98 nun
+
36xl98 mm spruce lumber (top plate) 10 nun wood fiber board0.15 mm PE·foil
300 nun glass fiber batt insulation 9.5mm gypsum board
Figure1. Top part of the wall section (wood fiber board on cold side).
ture are displayed in Figure 2. The moisture content of wood members was measured by the electric resistance method using a commercial moisture meter. The moisture meter used a calibration curve developed for Scandina-vian spruce that considered different temperatures. The diameter of the metal electrodes used was2mm and they were covered with 0.5mm plastic exceptfor1 em at the tip. For the best possible adjustment between the
e1ec-15nun
H
2390nIn
x
x
1190 nun r - -Top plalet
loomm セsエオ、 15mmH
•
t
loommx
t
100mm L - Bottom plate 300 nunt
loomm 300mm• Location of MCsensors and thermocouples in wooden parts X Location of thermocouples in insulation (five measuring points) Figure 2. The framework of the wall test section, with measuring points.
Compuf<r Simulations
if
the HygrothemuJl Performameif
aWoodFrameWall' 305•
i 4mmf IOmm COLD SIDE..
SPRUCE Measurement area MOIS11JRI! ELECTRODE,
•
I,
3nun 13.5 nun WARM 36mm SIDEFigure 3. Detail of top plate showing location of moisture electrodes.
30 20 ·20 L
t'\
•
-v
Ir
\--warrn
side --CoIdaldo f---.-+ I I I I MKMセ 200 «Xl 600 600 1000 1200 1«Xl 16 10 '-Hours 100r---,
--WllI1l1a1do _ _ CoIdald8o
エMMKMMKMMMMKMM^MMセZZZ[]ZZZZ[ZZZZ]ZZZNj
o
200 セ 600 600 QセQRPPQセQVPP Houl1l306
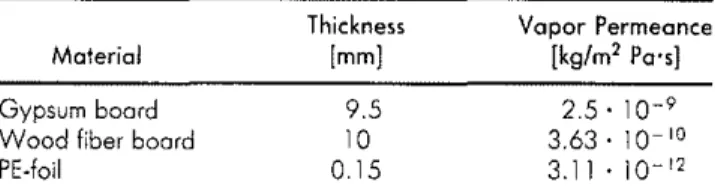
STIG GEVING, ACHILLES KARAGIOZIS AND MIKAEl SAlONVAARA Table 1. Vapor permeance of foil and board materials.Material Gypsum board Wood fiber board PE-foil Thickne!>s [mml 9.5 10 0.15 Vapor Permeance [kg/m' PO'sl 2.5' 10-9 3.63. 10-10 3.11 . 10-12
trades and the material, the holes were drilled slightly smaller than the thickness of the electrodes. The top plate, the bottom plate, and the studs were instrumented for moisture and temperature measurements on the cold as well as the warm sides of the construction. The locations of the moisture electrodes in the top plate are shown in Figure 3. The temperature profl1e in the insulation was measured with rake of five thermocouples at the top, middle, and bottom section of the insulation layer. Measurements in the wood members were logged manually about every second day, while the temperatures in the insulation were logged automatically every hour.
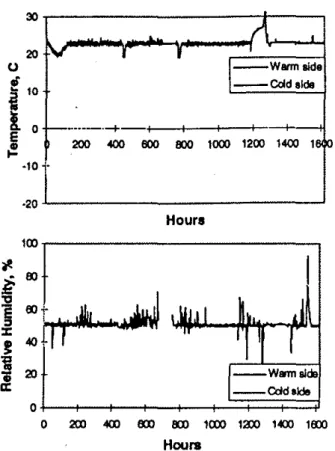
The climate condition on the warm side was maintained at approximately 23°C and 50% relative humidity during the whole period. The cold side was kept constant for most of the time at about -15°C and between 70 and 90% RH. This cold climate was interrupted by two warmer periods of one week each in duration when the temperature was raised to approximately 3°C. In addition, there were short periods with temperature increases last-ing only for a few hours due to defrostlast-ing requirements of the coollast-ing equipment. The air temperature and relative humidity were logged hourly on both sides of the construction. The time dependent boundary conditions on warm and cold side are shown in Figure 4.
The vapor permeance of the foil and board materials was measured with the cup method (50%-94.1 % RH), see Table 1.
DESCRIPTION OF MODEL
A detailed description of the LATENITE version 1.0 hygrothermal model is given by Karagiozis [7], Salonvaara and Karagiozis [8], and Hens [2], and only a brief overview is presented here with regard to the additional features imbedded in version 1.2. The moisture transport potentials used in the model are moisture content and vapor pressure; for energy transport, temperature is used.
The LATENITE 1.2 model has been recently upgraded to include porous air flow through insulation and cracks by solving a subset of the Navier Stokes equations: Darcy's equations. In addition, the solution domain has
Omtpurer Simulations of the Hygrothermal Peiformaru:e of a Wood Frame Wall 307
been extended to three-dimensions, allowing real practical problems to be
solved. The model recently included the capability for handling internal heat
and moisture sources, gravity driven liquid moisture, and surface drainage capabilities. The moisture transfer equation including liquid and vapor
transfer is
where
m =
mass flux, kg/m"sQo
=
dry density of porous material, kg/m'Dw ::::: liquid moisture diffusivitYI m2/S
U ::::: moisture content, kgw/kgd
T ::::: temperature, °C
op
= vapor permeability, kg/s·m·PaPv
=
vapor pressure, Pav" ::::: velocity of air, mls
Q. = density of vapor in the air, kg/m' K = moisture permeability, 's
Qw
=
density of liquid water, kg/m'g = acceleration due to gravity, m/s2
DESCRIPTION OF TWO-DIMENSIONAL CALCULATIONS
Several calculations were carried out to simulate the wall experimental
system. The studs in the wood frame wall cannot be fully represented in
two-dimensional modeling, buttheydo represent the most significant mois-ture capacity in the real strucmois-ture. A case with high initial moismois-ture content in the insulation was made to take into account the moisture capacity of the studs. The possible intrusion effect due to the presence of the electrode pins was also investigated. Mounted from inside of the cavity, these electrodes intrude through a rather wet area in the spruce and into a dryer region where the resistance is measured. Under these conditions, capillary transport of moisture along the electrodes into the dryer region could be present, thereby yielding corrupted moisture content readings. In a wood frame wall with low density batt insulation, nonperfect contacts could be present at material interfaces which willallow air leakage routes. These non-idealities can sig-nificantly alter the local effects of the internal air convection. To investigate these effects, some cases were modeled with air pockets (defects) at these material interfaces.
308 STIG GEVING, ACHILLESKARAGIOZISAND MlKAEl SALONVAARA
Boundary Conditions
A vertical cross section of the wall was modeled (300 mm X 2390 mm), including the top plate, bottom plate, and the insulation cavity. The PE-foil
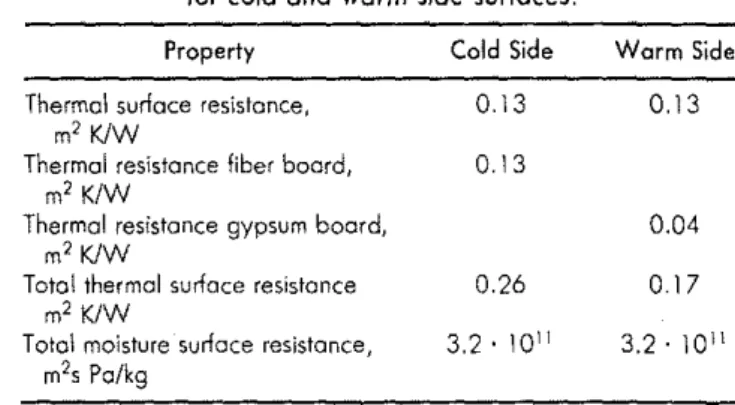
and the board materials were regarded only as resistance layers and included in the total surface resistances. The heat and moisture transfer surface
resist-ances for the cold and warm side are shown in Table 2. The top and bottom
boundaries wereconsidered adiabatic assuming no heat and moisture
trans-fer. The temperature and relative humidity at the warm and cold side were
measured as shown in Figure 4.
Initial Conditions
The initial moisture contents were 0.14 kg/kg for the top plate, and about 0.135 kg/kg for the bottom plate. The average moisture content of the studs were about 0.14 kg/kg. This was measured by the electric resistance method
right after the elements were built. The initial moisture content of the glass
fiber was not measured, but judging from laboratory conditions, a relative
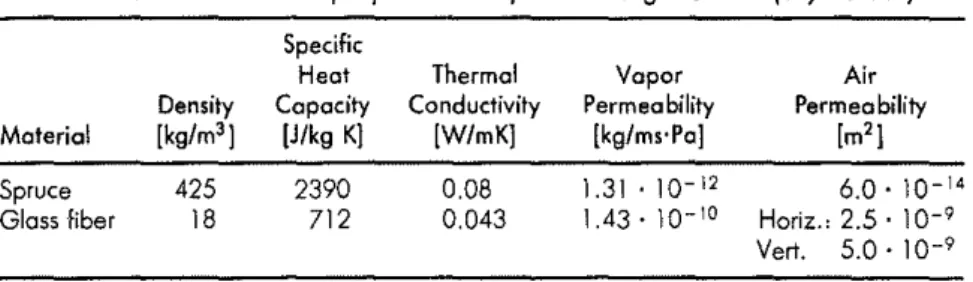
humidity of about 65 %, or apptoximately 0.0046 kg/kg was used. Material Properties
The basic material properties that were used for spruce and glass fIber arc
given in Table 3. The sorption curve in the hygroscopic area for spruce was
taken from measurements documented by Ahlgren [9] and adjusted to a
temperature of approximately SoC, not taking hysteresis into account. For the sorption curve above 98% RH, the moisture content-water potential
relationship of aspen sapwood, was employed [11]. The vapor
permeability-RH relationshipof thespruce was taken from measurements documented in
References [12] and [13]. The liquid diffusivity for spruce in the transversal
Table 2. Heatand moisture transfer resistances for coldand warmside surfaces.
Property Cold Side Warm Side
Thermal surface resistance, 0.13 0.13
m'
KlWThermal resistance fiber board, 0.13
m'
K/WThermal resistance gypsum board, 0.04
m'
KlWTotal thermal surface resistance 0.26
o
17m'
KlWT010\moisture surface resistance, 3.2' 10" 3.2,10"
Compuli!T Simulations of the Hygrothermal PeiformtlYlle
of
a Wood Frame Wall 309 Table 3. Basic materialpropertiesfor spruce and glass fiber (dry values).Material Spruce Glass fiber Density [kg/m'] 425 18 Specific Heat Capacity (J/kg K] 2390 712 Thermal Conductivity [W/mK] 0.08 0.043 Vapor Permeability [kg/ms·Pe] 1.31.10-12 1.43' 10-10 Air Permeability [m'] 6.0' 10-14 Horiz.• 2.5 . 10-9 Vert. 5.0' 10-9
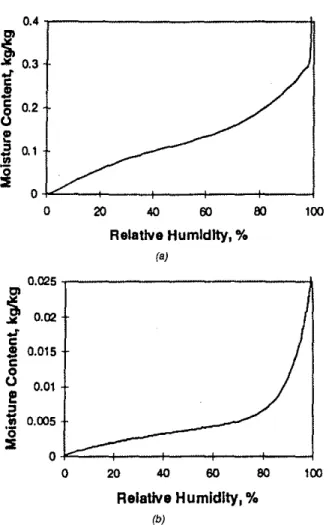
direction was estimated from measurements of the longitudinal liquid diffusivity-moisturc content relationship and water absorption coefficients for longitudinal and transversal directions [10]. The sorption curves for the spruce and the glass fiber and vapor permeability and liquid diffusivity for the spruce are shown in Figure 5.
Investigated Cases
Five different cases were simulated, all cases being variations of the basic Clse asdescribed previously. These cases arc described in Table 4.
For Case 2, the initial moisture content in the glass fiber was augmented to 0.207 kg/kg. This represents all the initial moisture content in the studs uniformly distributed in the insulation. The possible effect of capillary transport along the moisture electrode was investigated in Case 3by insert-ing a material layer with a very high liquid diffusivity and vapor permeabi-lity where the electrodes were located on the cold side. In Case 4, the effec-tive air permeability of the glass fiber was increased to 1.0· 10-' m' for both thex-and y-directions. In Case 5, the presence of air layers of thickness 10 mm at the interfaces top-plate/glass fiber, gypsum board/glass fiber, bot-tom plate/glass fiber. and fiber board/glass flber was investigated.
Table 4. Descriptionof the investigated cases.
Case Description
1 Base case
2 Effect of high initial moisture content (MC) in insulation 3 Intrusion effect of
Me
electrodes4 Effect of high air permeabilityaT insulation
310 5TI0 GEVING, ACHILLESKARAGIOZIS AND MIKAElSAlONVAARA 0.4
J
0.3l
0.2<3
l'!
"
0.1 セ .!!:i
0 0 20 <40 60eo
100 Relative Humidity,0/0
(aJ 0.025セ
0.02...
oJ' CS
0.015 c 0 0 0.01I!!
"
セ 0.005 II '0 ::i 0 0 20 <40eo
eo
100 Relative Humidity,0/0
(b)Figure 5. Sorption isotherm for spruce and glass fiber, and vapor permeability and liquid
dif-fusivity for spruce. (a) Sorption isotherm for spruce,Meat capillary saturation is 1.8 kgJkg. (b)
Sorption isotherm for glass fIber. Maximum Me at 100% RH is 50 kg/kg. (c) Vapor
Ccmputer SimuWtionsojthe HygrothermalPerformameoja Wood Frame WaIl 311 100 20 40 60 60 Relative Humidity, "-(e! O,OE+oo
l:=::;=::::::--+---+--J
o
2,oE·ll セMMMMMMMMMMNNNNNLセ
1.6E·ll .QI:.
1,2E·l1 ': !6.0E"2"
セ
4,OE·12>
2.0E·1.1セ
l.eE·l1Zセ
..
1,2E·llセ
Q 8.0E·12:2
"
4,OE·12セ
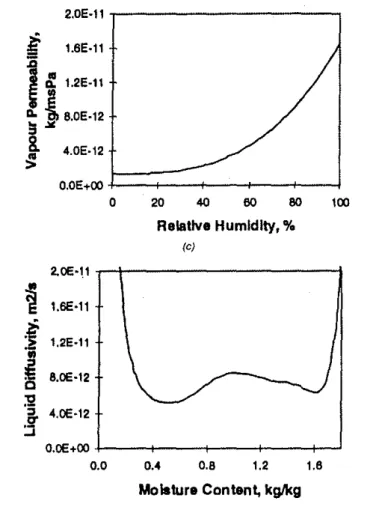
O.OE+OO 0.0 0.4 0,6 1,2 1.6 Moisture Content, kglkg (d)Figure 5 (continued). Sorption isotherm for spruce and glass fiber, and vapor permeability and liquid diffusivity for spruce. (a) Sorption isotherm for spruce, Me at capillary saturation is 1.8 kg/kg. (b) Sorption isotherm for glass ftber. Maximum Me at 100% RH is 50 kg/kg. (c) Vapor permeability for spruce. (d) Liquid diffusivity in transversal direction for spruce.
312 STIG GEVING, ACHilLESKARAGIOZIS AND MIKAEL SALONVAARA
RESULTS AND DISCUSSION
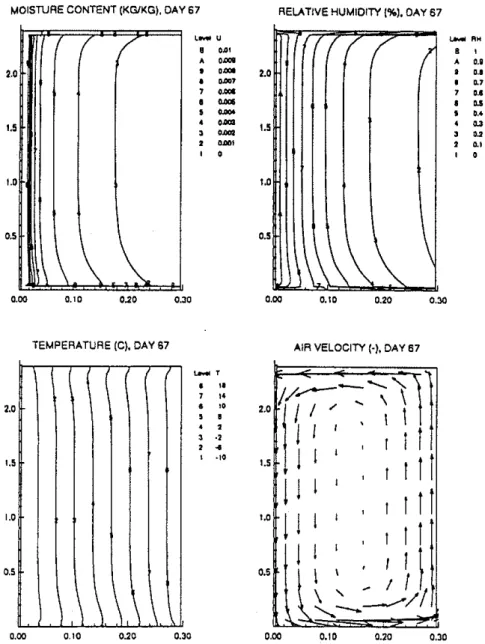
The calc lated moisture distribution within the insulation cavity for Case
1 is shown in Figure 6. With a low initial moisture content (MC) in the
insulation'lIDost of the moisture redistributes and condenses in the
outer-most part 9f the insulation within a few days. With a higher initial moisture
content as 1)nCase 2, this redistribution requires more time, but eventually most ofエィセ moisture has accumulated in the outermost nodal layer of the insulation. IAt this most exterior location, most of the moisture has accu-
,
mulated inithe top and bottom parts of the construction and less in themiddle, wi,lh the highest MC at the top. The MC distribution in the top plate showf signs of drying on the warm side and wetting on the cold side (Figure 7).1
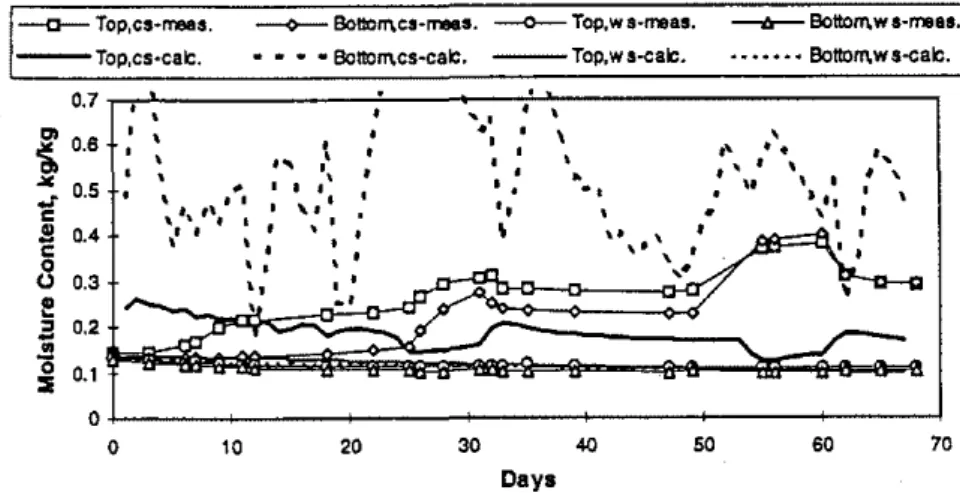
The calct!l}ated moisture contents at the warm side of top and bottomplate
show goodl agreement with the measured values for all the calculated cases, drying frolln MC of about 0.135 kg/kg to about 0.11 kg/kg (see Figure 8). This is no* unexpected, since the warm part of the wood will be in the hygroscopijc region during the calculation period. That means that the
moisture tl[ansfer is mainly due to vapor diffusion, avoiding the possible
problems rlhat may be related to measuring and calculating wet wooden
parts. j ,
The agrelement between measured and calculated MC on the cold side of
the top 。ョセ、 bottom plate is dependent on the selection of the measuring
location. Tihe tip of the moisture pins are located approximately 20 mm from
the
ュ。エ・イゥ。セャ
interface between the wood and the insulation, and if this point is consideded as the measuring point, the disagreement between measured and calcula1ted values becomes large. For instance, the calculated increase inMC for thils point during the whole period was about 2% by weight, while the measured values showed an increase of about 15% by weight. The
measuremJcnts furthermore show a high and rapid increase in moisture con-tent on th ' cold side when a warm period starts. In an ideal wood specimen
,
this is noti likely to happen, since moisture must be transported throughseveral cettimeters of wood to arrive at the measurement area of rhe
moisture sinsor. The moisture transfer occurs in the transversal/radial
direc-tion of thelwood fibers, where the liquid diffusivity is very small. The main
moisture t ansfer process into the wood specimen is due to vapor diffusion,
which can hardly explain a MC increase of nearly 10% by weight over a period of few days. An alternative explanation of the differences between
measurem nts and calculations is possible due to disturbances caused by the pin electro des at high local moisture concentration. An ice layer may form
on the col parts of the surface of the top and bottom plate during the cold
Computer Simulations
of
the Hy,grothermal Peiformaru:eof
a Wood Frame Wall 313MOISTURE CONTENT (KG/KG), DAY 67 RELATIVE HUMIDITY (%1. DAV 87
,
..
I..
//
CO.,,,
II 0.01 A ,.001I·
o, ,
",.
0.00'...
o ...·
o, ,...
-
,..-•I 0.001,,
..
1.5 1•• f1 / /
I
"""
o,.
I A 0.8 • a.'·
,.,
u • u , 0.4 • D.3,
..
·
I.,
, •.5 ..5 •.00 0.10 NセN 0.30 •.00 0.10 •.20 0.30 ••5,
.•
1.5 I.• •.5TEMPERATUREIe).DAV 87
\ \ \ \ \ \
""'"
o ",
"
o ",
.
•
•
,
.,
•
I•
-10AIR VELOCITY ('), DAY 67
,.. /IT
I
セャ セセZャQ
1.5 I ,r
I
I!
I
J
I
I , rI
I!
I..I
J
I
I I ' rI
I
J
I \
. ,
1
1
セLセOャイャ
---.
---/
0.00 0,10 0.20 0.30 •.00 0.10 0.20 0.30Figure 6. Case 1- Basecas.e.Calculated hygrothermal conditions within the wood frame wall at day sixty-seven.
0.30 0.25 0.20 0.\5 0.10 MOisture Content (kg/kg)
5T1G GEVING, ACHILLESKARAGIOZ1$ ANDMIKAELSALONVAARA
314
Figure 7. Case 1- Base case. Calculated moisture content in the top plate, day sixty-seven.
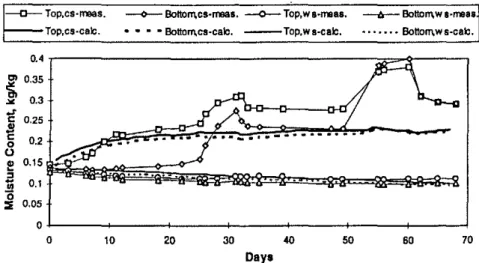
----0-Top,cs·rreas. Top,cs·calc. --<l'--Bottol1\cs-meas. --0--Top,W8·me8S. • • • • Botlorncs-calo. ---Top,ws-calc. - - l r - Bottoll\ws-men ••••••• Bottom,ws-calc • 0,4
セ
0.35"
0.3 J c 0.25セ
0 0.2 0e
0.15セ
0.1 0 0.05 ::E 0 0 10...
" '....
20 30 40 50 60 70 OaysFigure 8. Case 1- Base case. Measured versus calculated values for moisture content in the top and bottom plate (cs = cold side, ws ::=warm side). The calculated values on the warm side are
taken from the node that is located at the top of the electrode, while for the cold side the node chat is located at the point where the electrode penetrate the spruce is used.
Computer Simuwtions
if
the Hy,grothermal Peifommru:eif
a Wood Frame Wall 315the wooden surfaces. Since the pin electrode intrudes through this wet area, it is possible that water is sucked into the pin opening at the interface
be-tween the electrode and wood causing high MC values.
The difference between calculated and measured moisture content at the bottom plate may also have other causes, one being dripping moisture
against the PE-foil. Under freezing conditions a thin ice layer is formed on
the PE-foil. As soon as the temperatures increase above O°C this ice layer will melt, and water may run <;lown the PE-foil and excessively moisten the
bottom plate. The form of the measured curves (Figure 8), in fact, shows that a sudden moisture load appears at the bottom plate when the outside
temperature passes through O°C. At the same time, the sudden moisture
load of the top plate cannot be explained through this hypothesis.
According to this conjecture, the measuring point
on
the cold side couldactually be located at the wooden surface where the electrode pins intrude
from the insulation cavity side. The agreement between measured and
calculated values of MC for the cold side is good aecording to this hypothe-sis, as seen in Figure 8. The agreement is best for the top plate, while the bottom plate shows a higher MC at the beginning of the simulation. The calculated peak MC during the warm periods are not so distinct as the
measured values.
The initial
Me
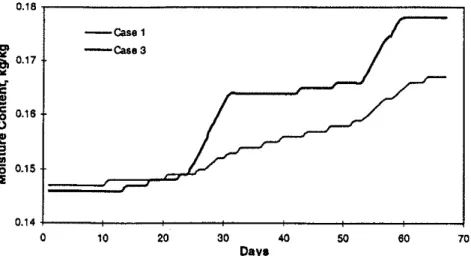
of the insulation has a significant effect on the calculatedMC on the cold side of the top and bottom plates, demonstrated in Case 2 with about 2-5% by weight higher MC on the cold side than Case 1. The effect of the presence of the pin electrode was simulated in Case 3 by insert-ing a material with a very high liquid diffusivity and vapor permeability where the electrode was placed (see Figure 9). This gave an increase in MC at the tip of the electrode of about 1% by weight compared to Case 1. It can
be seen that a major increase in moisture content appears during the warm
periods. The effective air permeability of the insulation does not have a big effect on the calculated MC of the top and bottom plate. Though it should be noted that a higher air permeability yields a larger difference between MC at top and bottom plate, with the highest MC at the top plate.
Figure 10 shows measured versus calculated temperatures in the middle of the insulation at three different heights in the construction for Case 1. Agreement between measured and calculated temperatures is observed with respect to overall trend, however, point by point values deviate. The meas-urements indicate a higher degree of internal convection within the element than what is calculated for the ideal construction. It therefore seems reasonable to assume that non-idealities, such as air leakage paths at the in-terfaces of the material layers, occur in the construction. Figure 11 shows measured versus calculated temperatures for the case of air leakages at the
316 5T1G GEVING, ACHILLES KARAGIOZIS AND MlKAEL SALONVAARA 0.18
セ
0.17...
oJ' c .!lc 0.16 0 (.)e
:J セ..
0 0.15 セ 0.14 0 --Case1 --CaseS 10 20so
Daya 40 50 60 70Figure 9. Case 3 - Modeling ofintrusion effect of probe. Measured versus calculated values for moisture content in the cold side of top plate. The calculated values are taken from the node that
is located at the top of the electrode.
- 0 - Top-rreas. -Top-calc. セ Mddle-rreas.- - b - -Bottom-f'l"l8lls - - - Mddle-calc. • •••••• Bottom-cae
||^セ
....
_ I
-セ_
.
16 '2 (.) .,; セ 6セ
..
Co 4e
セ 0 ·4 30 35 Daya--...
..
'.
Figure 10. Case 1- Basic Case. Measured versus calculated daily average temperatures in the middle of the insulation at three different heights in the construction. Day twenty-five to fony-five.
CompUf£r Simulotions
of
the Hr.grothermo{ Per[ormaJ1(eof
a Wood Frame Wall 317 ---TOp-calc.--a-
Toponas. - - - Mddle-ealc. . •••••• Bottom-calc - 0 - -Mddl&-rreas. --tr-bッエャoセュ・・ウ 20 15 (),;
- 10J
5o
·5 セ ,'\-,セOGNBBBGNG|
セ 30 "'35..
-"...--....
-
...
Day.
Figure 11. Case 5-Air layers at material interfaces. Measured versus calculated daily average
temperatures in the middle of the insulation at three different heightsinthe construction. Day twenty-five to forty-five. 1 - 0 - -Top,cs-mees. - - - TOP,cs-cac. - - 0 - -BotlOrT\cs-rn'MIs. - - 0 - -Top,we-meas. • BoltOrT\cs-calC. ---Top,ws-calc. セbッエエッャt|キ ••
mea'·1
• •••••• Bottotl\ws-ealc.I
0.•,
,
0.5,
,
.
•
,
, '. ,l. I•
0.'.
'
.
•
.
,
0.31--
'
"
.
0.2 セ.
DaysFigure 12. Case 5 - Air layers at material interfaces. Measured versus calculated values for moisture content in the top and bottom place (cs = cold side, ws = warm side). The calculated values on the warm side are taken from the node that is located at the tip ofthc electrode. while for the cold side the node that is located at the point where the electrode penetrate the spruce
318 STIG GEVING,ACHILLESKARAGIOZIS AND MIKAEL SALONVAARA
'.
material interfaces, the calculated temperatures in the top and bottom parts show somewhat better agreement with the measured ones. Measurements show a higher temperature in the middle part of the construction than any of the calculated cases. This could be due to air leakage in the interface be-tween the two insulation hatts that are used in the cavity.
The calculated MC in the top and bottom plate for the cases with internal air leakage routes (Case 5) show good agreement with measured values for the warm side, sec Figure 12. For the cold side there is no agreement when a vertical air leakage layer is included in the calculations. Though, it should be noted that when the construction was opened after the experiment was finished, it was observed that the bottom plate was very wet.
CONCLUSIONS
The measurements and model predictions of moisture content in the wooden parts show good agreement for the hygroscopic region. As soon as liquid water is present, the uncertainties associated with the measurement method make it difficult to compare measured and calculated values. When certain assumptions regarding the measurement method are made, the measured and calculated values show「・セエ・イ agreement. Comparison of the measured and calculated temperature conditions indicate that the construc-tion is highly affected by non-idealities in the cavity, indicating possibly a much higher degree of internal convection than for an ideal construction.
This study is an example that clearly shows that calculations should be made before designing laboratory experiments of this type. The most critical part of this experimentation is the location of the moisture electrodes. Preparatory calculations would have shown the importance of air gaps and where the highest moisture contents occurred. The electrodes placement could have been optimized using model predictions. It was quantitatively demonstrated that one should avoid positioning moisture electrodes through a wet part of the wood to measure at a dryer region.
Hygrothermal experimental investigations can be substantially enhanced at both the design phase and the analysis of the results by employing state-of-the-art models. As accurate moisture probes are not readily available, hygrothermal models that handle all the important moisture transport pro-cesses can be effective tools that can extract important moisture behaviours from critically reviewed experimental data.
The investigation showed the three main advantages of combining meas-urements and simulations, i.e.: (a) the use of preliminary simulation in the design, (b) the use of measurements to "calibrate;' adapt, or check the calculated results, and (c) the use of modeling as a mean to explain and inter-pret the experimental results.
Computer Simuwtions
<if
the Hygrothermal J'eiformatue<if
a Wood Frame WallREFERENCES
319
1. Thue,
J.
V. et aL 1996. "Wood Frame Walls in Cold Climate-Vapour Barrier Requirements:'J.
Thermal Insul. and Bldg. Envs" ApriL2. Hens, H. 1996. "Final Report Task1. Modelling Common Exercises. Summary Reports:' International Energy Conservation in Buildings and Community Systems,Annex 24 Heat, Air and Moisture Transport in New and Retrofitted Building Envelope Parts (HAMTIE).
3. Tsongas, G., D. Burch, C. Roos and M. Cunningham. "A Parametric Study of Wall Moisture Contents Using a Variable Indoor Relative Humidity Version of "MOIST" Transient Heat and Moisture Model," Proceedings of the Sixth Thermal
Peiformance of the Exterior Envelopes of Building Conference, Dec. 4-8, Clearwater,
Florida, pp. 307-319.
4. Hagentoft,C.E. and E. Harderup. 1996. "Moisture Conditions in a North Fac-ing Wall with Cellulose Loose Fill Insulation: Construction With and Without Vapor Retarder and Air Leakage:']. Thermal Ins"l. and Bldg. Evns., 19:228-243. 5. Ojanen, 'T. and K. Kumaran. 1996. "Effect of Exftltration on the Hygrothermal Behaviour of a Residential Wall Assembly;'). Thermal lnsul. and Bldg. Envs" 19:215-227.
6. Bigseth,L. 1994. "Moisture and Temperature Conditions in Highly Insulated Building Constructions (in Norwegian)." M. Sc. thesis, Norwegian Institute of Technology, Dept. of Building and Construction Engineering, Trondheim, Norway.
7. Karagiozis, A. 1993. "Overview of the' 2-D Hygrothermal Heat-Moisture Transport Model LATENITE;' Internal Report, National Research Council Canada, Institute for Research in Construction, Ottawa, Canada.
8. Salonvaara, M. and A. Karagiozis. 1994. "Moisture Transport in Building Enve-lopes Using an Approximate Factorization Solution Method?' CFD Society of Canada, Toronto, Canada.
9. Ahlgren,L. 1972. "Moisture Fixation in Porous Building Materials," Report 36, Div. of Building Technology. Lund Institute of Technology, Sweden.
10. Kumaran, M. K. 1996. "Material Properties, Final Report Task 3," International Energy Agency, Energy Conservation in Buildings and Community Systems, Annex 24 Heat, Air and Moisture Transport in New and Retrofitted Building Envelope Pans (HAMTIE). Laboratorium Bouwfysica, K.U.-Leuven. Belgium. 11. Cloutier, A. and Y. Fortin. 1991. "Moisture Content-Water Potentialr・ャ。エゥッョセ
ship of Wood from Saturated toDry Conditions." Wood Science and uchnology,
25:263-280.
12. Tveit. A. 1966. "Measurements of Moisture Sorption and Moisture Permeability of Porous Materials;' Norwegian Building Research Institute, Oslo, Norway. 13. Time, B. 1995. "Water Vapour Permeability Measurements of Spruce, Cup
Measurements:' Work Report No.4, Norwegian Institute of Technology, Dept. of Building and Construction Engineering, Trondheim, Norway.