HAL Id: insu-02942973
https://hal-insu.archives-ouvertes.fr/insu-02942973
Submitted on 18 Sep 2020
HAL is a multi-disciplinary open access
archive for the deposit and dissemination of
sci-entific research documents, whether they are
pub-lished or not. The documents may come from
teaching and research institutions in France or
abroad, or from public or private research centers.
L’archive ouverte pluridisciplinaire HAL, est
destinée au dépôt et à la diffusion de documents
scientifiques de niveau recherche, publiés ou non,
émanant des établissements d’enseignement et de
recherche français ou étrangers, des laboratoires
publics ou privés.
Distributed under a Creative Commons Attribution - NoDerivatives| 4.0 International
License
Cavity-melt partitioning of refractory radionuclides and
implications for detecting underground nuclear
explosions
Charles R. Carrigan, Yunwei Sun, Eric Pili, Daniel R Neuville, Tarabay
Antoun
To cite this version:
Charles R. Carrigan, Yunwei Sun, Eric Pili, Daniel R Neuville, Tarabay Antoun.
Cavity-melt partitioning of refractory radionuclides and implications for detecting underground
nu-clear explosions.
Journal of Environmental Radioactivity, Elsevier, 2020, 219, pp.106269.
Journal of Environmental Radioactivity 219 (2020) 106269
Available online 22 April 2020
0265-931X/© 2020 The Authors. Published by Elsevier Ltd. This is an open access article under the CC BY-NC-ND license
(http://creativecommons.org/licenses/by-nc-nd/4.0/).
Contents lists available atScienceDirect
Journal of Environmental Radioactivity
journal homepage:www.elsevier.com/locate/jenvrad
Cavity-melt partitioning of refractory radionuclides and implications for
detecting underground nuclear explosions
✩
Charles R. Carrigan
a,∗, Yunwei Sun
a, Eric Pili
b, Daniel R. Neuville
c, Tarabay Antoun
aaLawrence Livermore National Laboratory, Livermore, CA 94550, USA
bCEA, DAM, DIF, F-91297 Arpajon, France
cGéomatériaux, CNRS-IPGP, Université de Paris, Paris, France
A R T I C L E
I N F O
Keywords:
Radioxenon
Underground nuclear explosion Noble gas transport
CTBT International Monitoring System Atmospheric background
Xenon isotopic evolution
A B S T R A C T
Isotopic ratios of radioxenon captured in the atmosphere can be indicators of the occurrence of an underground nuclear explosion. However, civilian sources of xenon isotopes, such as medical isotope production facilities and nuclear reactors, can interfere with detection of signals associated with nuclear testing, according to a standard model of the evolution of radioxenon isotopic abundances in a nuclear explosion cavity. We find that this standard model is idealized by not including the effects of physical processes resulting in the partitioning of the radionuclide inventory between a gas phase and rock melt created by the detonation and by ignoring seepage or continuous leakage of gases from the cavity or zone of collapse. Application of more realistic assumptions about the state of the detonation cavity results in isotopic activity ratios that differ from the civilian background more than the idealized standard model suggests, while also reducing the quantity of radioxenon available for atmospheric release and subsequent detection. Our simulations indicate that the physical evolution of the detonation cavity during the post-detonation partitioning process strongly influences isotopic evolution in the gas phase. Collapse of the cavity potentially has the greatest effect on partitioning of the refractory fission products that are precursors to radioxenon. The model allows for the possibility that post-detonation seismicity can be used to predict isotopic evolution.
1. Introduction
One component of worldwide monitoring for underground nuclear explosions (UNEs) uses atmospheric detection of radionuclide gases released by prompt venting or seepage at the ground surface of the test site following an underground nuclear explosion (Saey and De Geer,
2005). The development of extremely sensitive analysis techniques for radioactive xenon isotopes (Auer et al., 2010; Le Petit et al., 2015;
Ringbom et al.,2014) in the past two decades and the potential of these gases to seep to the surface forming detectable atmospheric plumes at distance of 1000 km or more, even in the absence of prompt venting (Carrigan et al.,2019), makes monitoring for isotopic radioxenon par-ticularly attractive for confirming the occurrence of a UNE. However, concurrent with the development of more sensitive radioxenon analysis techniques has come recognition of the existence of a global back-ground of radioxenon produced by civilian facilities including nuclear reactors and medical isotope production plants (Saey et al., 2010;
Achim et al., 2016; Gueibe et al., 2017; Hoffman and Berg, 2018). A current estimate indicates that the background activity for xenon-133 is 0.4 mBq m−3on average in the northern hemisphere, with high
✩ IM release number: LLNL-JRNL-796900. ∗ Corresponding author.
E-mail address: carrigan1@llnl.gov(C.R. Carrigan).
spatial and temporal variability (Achim et al.,2016), and new advances in instrumentation resulting in enhanced levels of detection (e.g., 0.15 mBq m−3) can only benefit the monitoring regime, if UNE signals can
be unambiguously separated from the background originating from civilian sources.
Expressing the relative abundances of four xenon isotopes produced by UNEs as ratios on a two-dimensional plot or Multiple Isotope Ratio Chart (MIRC) has been used to develop a possible approach to discrim-inating between UNEs and other radioxenon sources as demonstrated byKalinowski et al.(2010). The plot (Fig. 1) allows graphically distin-guishing between UNE sources and civilian sources of gas releases hav-ing compositions includhav-ing the 4 principal radioactive isotopes of xenon (131m, 133m, 133 and 135) and UNEs to the extent that a ‘‘discrimina-tion line’’ or boundary has sometimes been arbitrarily defined. For the purpose of confirming that radioxenon observations are from a UNE, the 4-isotope MIRC is presently somewhat limited owing to the current inability to measure all four isotopes in the atmosphere at large stand-off distances using the currently deployed Comprehensive Nuclear-Test-Ban Treaty International Monitoring System detection capability.
https://doi.org/10.1016/j.jenvrad.2020.106269
Journal of Environmental Radioactivity 219 (2020) 106269
2
C.R. Carrigan et al.
Fig. 1. Two ratios of activity involving four xenon isotopes, Xe-135/Xe-133 and Xe-133m/Xe-131m, form the axes of this MIRC. The solid blue line, to the right of the red-dashed
‘‘discrimination line’’, represents the temporally evolving ratios of the four xenon isotopes based on a simplified post-detonation model of an underground nuclear explosion that incorporates the radioactive decay-chain network ofEngland and Rider(1994), but not the effects of either partitioning of the radionuclide inventory or gradual leakage (seepage) from the detonation cavity. The blue-dashed line is the evolutionary path of the isotope ratios for radioxenon produced immediately at the time of detonation. The points to the left of the discrimination line are measurements from civilian nuclear releases such as medical isotope production and nuclear reactor operations. Ideally, the discrimination line allows distinguishing the observations of UNE gas releases from civilian gas releases. The isotopic ratio as a function of time since detonation can be determined by the intersection of the constant time lines ofFig. 5with the isotopic ratio evolutionary paths. (For interpretation of the references to color in this figure legend, the reader is referred to the web version of this article.)
Source:Reactor data are re-plotted fromKalinowski et al.(2010), Fig. 8.
However, it may have potential value for confirming gas sampling on-site of a suspected event or for confirming atmospheric measure-ments as technical advances improve isotopic detection thresholds with time. Additionally, the MIRC is quite useful for representing UNE ra-dioxenon source terms and their relationship to other measured sources of isotopic xenon, which is primarily the context in which the MIRC is used in this paper. To simplify the discussion, we consider only the U235f fractionated and unfractionated isotopic evolution paths.
InFig. 1, the points representing isotopic ratios to the left of the ‘‘discrimination line’’ are based on direct measurements of radioxenon isotopic abundances of background sources. To the right of the dis-crimination line, there are two lines. One represents the evolution of radioxenon abundances (solid line) resulting from the unfractionated radionuclide inventory (also called ingrowth) while the other tracks the isotopic evolution of the separate radioxenon inventory that is instan-taneously produced (fully fractionated) at the time of the detonation. Unlike the left side of the diagram, the isotopic evolution lines have not been directly measured following a UNE. Rather, the ratios are based on isotopic abundances calculated using the classical Bateman equation (Bateman,1910), which is a mathematical model expressing isotopic abundances and activities in a radioactive decay network versus time (Sun et al.,2012,2015;Sloan et al.,2016). The decay-network model uses input on the rates of decay and initial abundances of the elements in the radioactive decay chain (England and Rider,1994). It should be recognized, however, that direct application of the Bateman equation to represent radioxenon evolution of the post-detonation source term implies making important assumptions about the state of the radionu-clide inventory within the detonation cavity or zone of collapse, often called the chimney, which may not generally apply. These assumptions are (1) the radionuclide inventory within the cavity or chimney remains well-mixed over the period of isotopic evolution and (2) all parent and daughter members of the decay chain network, whether refractory or volatile, remain together during the entire period of evolution. In effect, application of the Bateman equation for modeling isotopic evolution applies rigorously only to a well-mixed, closed, post-detonation cavity.
To date, we have only explored the effect of deviating from as-sumption (2). Using a ‘‘leaky-reactor’’ model, which considers the dual permeability, fractured porous matrix nature of the post-detonation containment zone, we evaluated the evolution of the radioxenon in-ventory of the detonation cavity subject to post-detonation leakage parameters appropriate to a test site on Pahute Mesa at the Nevada National Security Site (Carrigan et al.,2016). The leaky-reactor model evaluates fluctuating low-level leakage out of the cavity and across the containment zone resulting from both thermally driven, multi-phase convection and barometric pumping (Sun and Carrigan, 2016). One characteristic of the model is that nuclear yield can influence the course of isotopic evolution through post-detonation heating and the resulting multiphase, thermally driven flow which affects the time-dependent leakage rate. Considering most of the energy (Heckman, 1964) pro-duced by a UNE is converted into heat, it is important to include the effect of thermally driven convection on estimating the evolving radioxenon inventory as well as the arrival of radioxenon at the surface. In the case of the delayed large-scale gas release from the DPRK 2013 UNE, the leaky-reactor model estimated a Xe-131m/Xe-133 ratio at a point in time (∼2 months later) when atmospheric gases were finally detected that was five times greater than would be expected by simply solving the Bateman equation given assumption 2, that is, assuming no barometric and thermally driven, low-level leakage of gases from the detonation cavity other than the very late, large release of radioxenon responsible for the detection (Carrigan et al.,2016). It should be noted that this higher-value estimate of the Xe-131m/Xe-133 ratio, which is similar to the observed ratios, also corresponded to a range of nuclear yields in agreement with published seismic yields for that UNE. We will re-consider the simulations related to the DPRK observations in the context of violating the first assumption of a well-mixed radioactive inventory in a later section.
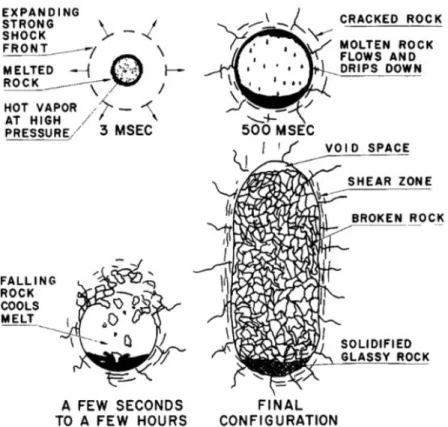
Fig. 2illustrates the sequence of events at the time of detonation as presented bySchwartz et al.(1984). During the rapid expansion of the detonation cavity by the nuclear explosion, extreme pressure and
Journal of Environmental Radioactivity 219 (2020) 106269 C.R. Carrigan et al.
Fig. 2. The sequence of events giving rise to the zone of melt at the bottom of a UNE cavity and ultimately a chimney is illustrated. Estimates of rock-melt production as a
function of nuclear yield vary, depending on such parameters as rock type and moisture content. Estimates range from 300 to more than 1000 tons of melt being produced per kiloton of nuclear yield with about 10%-20% of the melt consisting of vaporized rock and other material that ultimately condenses into the melt zone (Adushkin and Leith,2001;
Butkovich,1974).
Source:Illustration taken fromSchwartz et al.(1984).
Fig. 3. (a) For bounding the isotopic evolution of radioxenon, the model assumes that some fraction of xenon isotopes present immediately following detonation (independent
yield or fully fractionated) is partitioned into the gas-vapor phase. Similarly, the same fraction of refractory precursors of radioxenon will also occupy the vapor phase along with a significant mass of rock vaporized from the expanding cavity walls. The remaining portions of volatiles (e.g., iodine and xenon) and their refractory parents (ingrowth yield or unfractionated) are sequestered into the melt phase. During the rapid cooling of the gas-vapor phase over a period of seconds to minutes (Olsen,1967), the vaporized refractory components of the decay chain along with vaporized wall rock condense out of the turbulently convecting cavity gases, gradually dropping into and mixing with the melt phase. Volatiles, such as initially existing iodine and radioxenon isotopes along with any new iodine and radioxenon that is produced at the end of the decay chain, remain in the gas-vapor phase. 𝑇𝑣0and 𝑇𝑣𝑓are rainout starting and ending temperatures. (b) The gas-vapor phase rapidly cools from plasma temperatures to a few-thousand degrees with
the order of refractory-element condensation from the gas-vapor phase (Lide,1997) being shown on a plot of the cooling curve. During this condensation process the refractory decay-chain network produces iodine and xenon isotopes that remain in the gas-vapor. In the model, dropout or separation from the vapor phase of a decay chain element that has started to condense is not immediate but is assumed to have a ‘‘half-life’’ in the highly turbulent and well-mixed vapor phase.
temperature conditions cause both vaporization and melting of rock on the walls of the expanding cavity. Within seconds melted rock is shed from cavity walls under the force of gravity to the bottom of the cavity forming a two-phase system consisting of a volatile gas and vapor over-lying a zone of melted rock. Estimates of melt production range from
300 to more than 1000 tons of melted rock produced per kiloton of released energy with 10%-20% of the melted mass being contributed by the eventual condensation of vaporized material (Adushkin and Leith,
2001;Butkovich,1974). A one-kiloton UNE might typically have a zone of molten rock about 2 m thick at the bottom of the detonation cavity
Journal of Environmental Radioactivity 219 (2020) 106269
4
C.R. Carrigan et al.
Fig. 4. Radioactive decay network plotted according toEngland and Rider(1994). The numbers together with arrows indicate the branching factors. The decay-chain model used to simulate cavity-gas production includes all parent radionuclides producing radioxenon daughters.
(Egorov et al.,1979). How much melt is produced by a detonation will depend, among other things, on the rock type and level of groundwater saturation in the containment zone. Radiological studies of melt zone samples from the 1957 Rainier UNE in Nevada were interpreted at the time to mean that ‘‘all radioactivity’’, with negligible exceptions, was trapped in the melt zone (Johnson and Violet, 1958). For the NNSS Piledriver nuclear test, the data suggest that more than 60% of the long-lived radionuclides reside in the glasses studied (Rabb,1970;
Borg,1975). Furthermore, Borg argues that the cores recovered within the lower part of the chimney are representative of the overall melt resulting from the detonation. A more general study found radioactivity to be heterogeneous in the melt zone with the highest concentrations occurring in the melted rock containing bubbles (Picq,1970). Similarly,
Fauré(1970) describes the melt or lava zone as the region of highly concentrated post-detonation radioactivity following UNEs carried out at a different granitic test site. The discussion in subsequent sections of this paper will focus on making an initial bounding evaluation of the nature of this two-component regime and its effect on the evolution of isotopic ratios when assumption (1), the requirement for a well-mixed system, is no longer rigorously met.
2. A UNE radionuclide partitioning model
To better understand the effects on xenon isotopic evolution caused by a deviation from a well-mixed radioxenon daughter and refractory parent inventory, we have developed a basic partitioning model for the post-detonation cavity that in a later section will be incorporated into the leaky reactor model developed earlier.Fig. 3illustrates this basic model intended initially to bound the range of evolutionary paths on the MIRC.
The physical partitioning model is described in Fig. 3a and de-tails of the early-time condensation of the refractory elements in the radioxenon decay chains are shown in 3b. Rapid cooling and con-densation of refractory parents occur followed by migration of the condensing elements into the melt phase from the gas-vapor phase. However, the model also assumes that any volatile iodine and xenon, produced in the gas-vapor phase during condensation, remains in that phase. Finally, the model assumes that once a decay-chain parent has condensed and dropped- or rained-out of the gas-vapor phase, it remains permanently in the melt phase where it contributes along with other, already present, decay-chain parents to the production of xenon, which then remains in the melt zone. Given the estimated timescale for back diffusion or transport of significant amounts of radioxenon from
Journal of Environmental Radioactivity 219 (2020) 106269 C.R. Carrigan et al.
Fig. 5. Possible evolutionary paths of UNE isotopic ratios for a two-parameter
variational study where simulations assuming 50%-90% of the radionuclide inventory is initially partitioned into the melt zone followed by rainout of condensed material in the gas-vapor phase at rates varying between 1 × 10⁻³ and 1 of the condensed
material per second corresponding to 693.15 and 0.693 s of half-life. The blue dashed lines are the idealized model results for the unfractionated (England and Rider,1994) and fully fractionated (I.Y.) radioxenon ratios. For these two rainout rates, cyan-colored and magenta-colored lines represent possible paths for isotopic evolution in the gas-vapor phase and the melt zone, respectively. Time-since-detonation (d = days) along an evolutionary path is provided at different locations on the plot (cyan dashed lines). For simplicity, only the U235f nuclear fission is considered in this plot. Note that the rainout of refractory parents of radioxenon and/or collapse of the cavity determine the evolutionary paths of isotopic ratios in the gas–vapor, while both the initial distribution of the total radionuclide inventory and subsequent rainout of refractory parents determine the range of possible paths in the melt zone. (For interpretation of the references to color in this figure legend, the reader is referred to the web version of this article.)
the liquid or quenched rock melt into the gas phase, this is a reasonable assumption, which we will consider in greater detail in a later section.
3. Bounding the effects of condensation, rainout and partitioning
We can estimate the range of impact of the general process of partitioning a fraction of the radionuclide inventory into the melt zone within a UNE cavity. Multiphase reactive transport was simulated using the Non-isothermal, Unsaturated Flow and Transport (NUFT) computer program (Nitao,1998; Hao et al.,2012) developed at Lawrence Liv-ermore National Laboratory. The program was modifed (Sun et al.,
2012,2015) to allow tracking the evolution of radioactive precursors and radioxenon daughters as illustrated inFig. 4. The main parame-ters for this enhanced isotopic evolutionary model are post-detonation cavity-temperature cooling rate, fraction of post-detonation radionu-clide inventory initially partitioned into the melt and the rainout or dropout rate of decay-chain elements from the vapor phase once condensing begins for a particular element.
Fig. 5includes the fully fractionated (instantaneously produced or independent yield) and unfractionated evolutionary paths of Fig. 1, representing the well-mixed and closed-cavity case (blue dashed lines). Additionally, the cyan lines representing radioxenon ratios in the gas phase, which are potentially observable following a release to the atmosphere, represent the range of possible evolutionary paths of the isotopic ratios as predicted by the new model with partitioning and leakage. Using this model, we performed a two-parameter variational study in which we simulated the effects of initially partitioning 50%– 90% of the radionuclide inventory into the melt zone followed by condensation and rainout from the overlying gas–vapor phase ranging between no rainout (condensed material remains well-mixed with gas– vapor) and rainout of 1 × 10⁻³, 1 × 10⁻² and 1 of the condensed
Fig. 6. Evolution of the isotopic ratio Xe-131m to Xe-133 in a detonation cavity is
plotted against time for nuclear yields of 1 and 10 kt subject to assumed conditions of rainout and continuing loss of radionuclide inventory from the gas/vapor phase with leakage into the zone of containment. The idealized England and Rider model (i.e., full inventory remains well mixed with no long-term leakage from cavity) has been plotted (red dashed line) for comparison with the other cases. The rate of rainout or loss of refractory precursor inventory from the well-mixed state generally varies from the case of no rainout (system remains well mixed) above the E & R line to rapid rainout below that line. The Russian measurements of the isotopic ratio resulting from the 2013 DPRK UNE, which are interpreted as a sample released from the cavity, are included for reference with the red box representing the estimated range of error for those measurements. While the curves presented are appropriate for a U235f detonation, it is unknown what kind of fission event actually occurred. Cavity-gas seepage rates are only estimated for the DPRK event. (For interpretation of the references to color in this figure legend, the reader is referred to the web version of this article.)
material every second. Such rainout rates correspond, respectively, to 693, 69, and 0.7 s half-lives of the refractory precursors remaining well-mixed with volatile daughters. The most striking feature of the cyan-colored zones is that isotopic evolutionary paths can now track farther from the discrimination line and away from background signals associated with civilian sources of radioxenon. For comparison, the isotopic composition of the melt zone (magenta lines) tracks much closer to the discrimination line. While the effect of partitioning the ra-dionuclide inventory on the gas–vapor phase may be readily observable following a prompt venting of a detonation cavity, radioxenon produc-tion in the melt zone will be unobservable without direct sampling of that zone according to our model.
From the two-parameter study, it was apparent that the initial frac-tion of radionuclide inventory partifrac-tioned between the vapor and melt phases and the rate of rainout of the refractories from the condensing vapor had significantly different effects on the resulting radioxenon gases. The initial partitioning of the full volatile (iodine, xenon) and refractory inventory into two essentially separate domains (e.g., rock melt and vapor) allows the evolution of radioxenon to occur in parallel. Partitioning of the full inventory by some fraction (e.g., 60% melt and 40% vapor) just seconds after detonation will only determine the relative concentrations of radioxenon isotopes in the melt and vapor and not affect the isotopic ratios themselves. Regarding partitioning by refractory rainout from the vapor phase to the melt, we see that increasingly rapid rainout of the refractories moves the evolutionary track farther to the right of the idealized England and Rider case, which assumes neither partitioning nor rainout occur (Fig. 5). Eventually, the limit is reached where more rapid rainout of refractory precursors can have no additional effect with the rates of 1 × 10⁻²and 1 converging
on the same evolutionary path. An alternative model assumes that the fully fractionated radioxenon component of the inventory or indepen-dent yield escapes being partitioned into melt and remains entirely in the vapor while only the refractory components of the inventory
Journal of Environmental Radioactivity 219 (2020) 106269
6
C.R. Carrigan et al.
are partitioned. However, the model considered here is actually more conservative in terms of estimating the impact of decreasing rainout times on shifting the bounding isotopic curve away from the MIRC discrimination line.
The MIRC 4-isotope plot is useful for tracking evolution of isotopic ratios for only a relatively short time (e.g., a few days following the det-onation) given the rapid decay of Xe-135. We can, however, evaluate possible effects of rainout and partitioning by considering a different ra-tio, Xe-131m/Xe-133, in the context of radionuclide observations from the 12 February 2013 DPRK underground nuclear test. Radionuclide observations of the nuclear test were unusual as radioxenon was not observed in the atmosphere until almost two months following the detonation with detections occurring first in Japan and a few days later in Russia (Ringbom et al.,2014). The Japanese and Russian measured ratios were somewhat different leading to a possible interpretation by Ringbom and colleagues that the radioxenon measured first in Japan, from what was evidently a well-contained UNE, was released in open-ing and ventilatopen-ing the tunnel complex at the DPRK test site while the Russian observation, which was characterized by large measurement errors (Ringbom et al.,2014), came from a location in the DPRK tunnel complex nearer to the point of detonation. Using their leaky reactor model in a variational study,Carrigan et al.(2016) reached a similar conclusion except that the Russian measurements were found to best agree with radioxenon evolution in the detonation cavity or chimney, itself, for a yield of 5–8 kilotons, which happens to be in approximate agreement with the seismic yield estimates for that event (Oswald,
2013;Ringbom et al.,2014). This led to the hypothesis that the Russian set of measurements resulted from a prompt release caused by drilling back into the detonation cavity, a common post-detonation procedure for nuclear test evaluation.
The intent ofFig. 6is to illustrate the effect of adding partitioning with rainout of refractories to the simulations of Xe-131m/Xe-133 considered earlier byCarrigan et al.(2016), which only included the effect of leakage into the containment zone. It is obvious that variability in the condensation-rainout-partitioning process in the post-detonation cavity can significantly modify the long-term evolutionary path of this particular isotopic ratio. The Russian observations of the ratio (grouping of squares) fall within the 1 and 10 kt predicted isotopic evolutionary paths for the 2013 DPRK UNE, assuming well mixed or no-rainout cases. The accuracy of early- and later-time models of isotopic evolution, as illustrated inFigs. 5 and6, would clearly benefit from a better knowledge of the parameters governing rainout, partitioning in the cavity and gas leakage rates. Models should also evaluate the potential for transport of radioxenon back into the gas–vapor phase, which will tend to reduce the effects of partitioning. We consider the possibility of radioxenon back flow from the rock melt into the vapor phase in the next section.
4. Transport modes between melt and gas–vapor phase
Transport of xenon from the melt zone and into the gas–vapor phase will tend to reduce the effect of partitioning as well as the benefit of separating the unfractionated evolutionary path on the MIRC from civilian radioxenon signals as discussed earlier. The closest well-studied natural analogs for transport in the melt zone are volcanic lava lakes. The 300–1000 tons of melt produced in a 1 kt nuclear test creates a layer approximately 2 m in thickness at the bottom of the cavity resulting from the explosion. Temperature differences between the melt and overlying gas phase can potentially produce vertical transport driven by thermal buoyancy. FollowingCarrigan(1987), the critical Rayleigh number for the rock melt to begin circulating is 𝑅𝑎c=2700
using a flux-based representation of the Rayleigh number. Values of rock melt viscosity (100 Poise) and rate of heat loss from the melt zone (15 000 W m−2appropriate for Erta Ale lava lake, Ethiopia according to Oppenheimer et al. (2004)), which are intended to enhance our estimate of the vigor of convective overturn, yield a melt zone Rayleigh
number 𝑅𝑎mz =370 𝑅𝑎c. Assuming the relationship between vertical
transport speed 𝑤 and 𝑅𝑎mzgiven by
𝑤≈ 𝜅 𝐷 (𝑅𝑎 mz 𝑅𝑎c )1∕4 (1) where 𝜅 is the thermal diffusion coefficient of the rock melt and 𝐷 is the layer depth (2 m). We obtain vertical transport rates of about
𝑤= 2 × 10⁻⁶m s−1and a thermal boundary layer thickness of
𝛿= 𝐷 ( 𝑅𝑎 c 𝑅𝑎mz )𝛽 = 0.7 m (2)
According to these results, a single overturn of the melt in the zone will require about 10 days. Even after this time, melt from the interior will only be in the somewhat thick thermal boundary layer and not necessarily reach the surface of the melt zone. Many 10-day overturns may be required before dissolved radioxenon at a certain location in the fluid can be expected to reach the interface where the very much slower diffusive transport process (𝑤dif f∼ 1.0 × 10⁻¹²m s−1)
can transport xenon across the interface into the gas–vapor phase. The lifetime of a melt zone as a mobile liquid is at most a week or two without collapse and much more likely only minutes to a few hours based on observations of detonation cavity collapse. Thus, we expect that thermally convective overturn and chemical diffusion will typically play a negligible role in transporting xenon into the gas–vapor phase.
Additionally, the effect of degassing of native water from wall-rock that is either vaporized or melted by both thermal and shock melting should be evaluated for its potential to provide a means of transporting into the gas phase any radioxenon already present in the melted rock. This mode of gas release would be expected to scavenge dissolved radioxenon produced at early times and transport it either directly by rising bubbles or through a permeable bubble or pumice-like network. While this general process has been discussed in other contexts (Zhang and Zindler, 1989), how efficient it will be for extracting dissolved xenon at early times after detonation from the melt zone and moving it into the overlying vapor remains uncertain and is only suggested here as a possibility. It should be noted that descriptions of the post-detonation melt zone do occasionally mention sparse distributions of bubbles (Picq,1970;Fauré,1970) and in some cases extensive vesicular lenses (Kersting and Smith, 2006) within the glass. However, it is unlikely that these bubbles are an artifact of large-scale degassing of volatiles in the melt zone causing the release of radioxenon into an overlying gas phase. More likely most if not all of any native water in the rock has already separated from the melt into the gas phase before the melt pool even forms. Shock-induced melting produces explosive separation of volatiles, such as water, from the melt during the period of rapid depressurization (Kieffer and Simonds,1980). Other authors had previously recognized this early time, extremely rapid separa-tion of melt and volatiles and created a successful non-interacting, two-component (rock and water) model for simulating the effects of underground nuclear explosions (Higgins and Butkovich,1967). This lack of a significant volatile content in the melt zone will severely limit a radioxenon scavenging mechanism.
Does the post-detonation collapse of the cavity roof significantly influence transport of the radionuclide inventory between the gas phase and melt zone? A large-scale collapse of the cavity roof should capture or plate out on rubble surfaces refractory elements of the radionuclide inventory present in the vapor phase or already condensed on the surface of the melt zone leaving only gaseous radionuclides behind. Thus, collapse of roof rock into the melt would appear to terminate the separation of refractories from gaseous components of the inventory. But, can the addition of rubble to the melt zone aid in transport of radioxenon back into the gas phase from the melt zone?Fig. 7shows the rubble-glass mixture resulting from the collapse of roof rock into the melt zone from the 1.7 kt Rainier event in Nevada (Department of Energy, 2015). Degassing of the rubble which may contain either pore water or hydrated minerals could potentially lead to creation of
Journal of Environmental Radioactivity 219 (2020) 106269 C.R. Carrigan et al.
Fig. 7. Rubble-filled melt zone created by falling cavity roof after detonation of Rainier
UNE. Black material is glass remnant of melt and tan material is rubble from collapse of cavity. White material between the glass and rubble was hypothesized to be reactive foam rind.
Source:FromWadman and Richards(1961).
pathways for gas transport to the surface at the interface. Based on the appearance of white zones or rims around rubble pieces (Fig. 7), it was previously hypothesized that following collapse of a cavity roof, vaporization of porewater released from the partially saturated rubble might create bubbles producing connected pore space in the vitric component of the zone. The distribution of radioactivity in a melt-rubble regime was found to be heterogeneous with higher levels associated with bubbles, especially the beta-gamma emitters (Picq,
1970). This suggests that the precursors of radioxenon residing on or near the interface of the very high total surface area of a network of interconnected bubbles can more effectively release their noble gas daughters into the gas phase now residing somewhere in the overlying fracture and void space of a high-permeability layer of collapsed roof rock (Carrigan et al.,2020).
We performed a preliminary, bench-scale investigation into the effect of bubble and gas-pathway production at the interface formed by dropping rock samples of different types into molten glass at tempera-tures comparable to that of a layer of melt as shown inFig. 8. Samples of granite, gneiss, limestone, halite and chert were used. Rock samples immersed were either pre-heated or at room temperature.
Regarding the white zones observed in Fig. 7, we found similar zones in the solidified glass component but under examination were not able to associate those zones with the presence of bubbles as was hypothesized. The major observed effects were fracturing of the rock along with typically significant decomposition of minerals (feldspars and micas) in the immersed samples (Fig. 8b). Occasionally, a few unconnected bubbles were observed at the interface which may be associated with dehydration of feldspar in the granitic case. Higher water contents in a porous tuff material that is characteristic of UNE sites at NNSS may prove to be better candidates for the formation of an interconnected network of bubbles. Certainly, the observed fracturing and decomposition of the immersed rocks will enhance the ability of gases to flow along the interfacial network, formed by the rubble pile immersed in the melt. However, none of the gas transport mecha-nisms or pathways discussed here will return refractory precursors of radioxenon back into contact with the overlying vapor and any overall migration of radioxenon back into the gas phase will likely be weak at best for containment zones consisting of the rocks that were evaluated.
5. Discussion and conclusions
Once the post-detonation radioactive inventory has partitioned be-tween the melt and vapor phases, it is unlikely that significant equili-bration will occur between the melt and gas phases on a time scale that will have a major impact on detectable atmospheric isotopic signatures, especially given the tendency for the cavity roof to collapse soon after an event. We therefore interpretFigs. 5and6as being indicative of po-tential partitioning effects on isotopic ratios of cavity-gas composition at early times and over a period of months, when leakage or seepage effects have become important. According to Fig. 5, isotopic ratios will deviate from the idealized model by evolving farther away from the discrimination line separating civilian radioxenon releases from a UNE. As shown in the figure appropriate for a U235f detonation, our calculations provide ratio-tracking information for about the first 3–4 days following a UNE or until the Xe-135/Xe-133 ratio reaches a value of 0.1 although even lower values may be measured with the advent of newer radioxenon-analysis systems and enhanced levels of detection (Auer et al.,2010;Le Petit et al.,2015).
The rainout and partitioning process continues to have a significant effect at much later times as shown in Fig. 6 where the ratio used is the much longer lived Xe-131m/Xe-133. The main effect appears to be overlapping of the possible evolutionary tracks between the 1-and 10-kt cases as a result of a lack of information about rate of condensation and rainout of the inventory that is in the melt. This increases uncertainty in attempts to estimate the nuclear yield of an event from cavity-gas releases occurring at much later times.
In conclusion, most previous discussions involving the radionuclide source term for an underground nuclear explosion have assumed an idealized model of isotopic evolution involving a well-mixed deto-nation cavity that retains all the parent and daughter constituents of the radioactive inventory. However, post detonation radiochemical observations support an isotopic evolutionary model that partitions the radioactive inventory responsible for radioxenon evolution into two zones involving rock melt and gas phases. From our model, we conclude that the timescale for partitioning of refractory precursors from the gas phase into the zone of rock melt before collapse of the cavity can significantly influence radioxenon isotopic ratios observed at the surface or in atmospheric signals that become detectable by subsequent venting of gases at the surface.
At early times after detonation, we found the main impact of rainout and partitioning is to enhance the ability to discriminate between civilian radioactive releases, such as those of nuclear reactors and medical isotope facilities. Collapse of the cavity into the rock melt very soon after detonation would appear to effectively shorten the rainout time of refractory precursors of radioxenon in the gas–vapor phase. Shortening this rainout period moves the evolutionary path plotted on the MIRC even further from the idealized isotopic evolutionary model based on the England and Rider decay-chain network and away from the civilian isotopic background noise. Collapse of the roof also terminates most if not all gas transport between the quenched melt and overlying gas phase which contains radioxenon produced to that point in time. Finally, the connection between the roof collapse and a ‘‘hard’’ termination of the rainout phase suggests that knowledge of the time period between detonation and roof-collapse allows bounding of the isotopic ratio evolutionary track on the multiple isotope ratio chart. Sometimes, seismic detection of cavity collapse allows this period to be determined as in the 3 September 2017 DPRK UNE when a collapse event was reported 8.5 min after the detonation (Dodge,2018).
Declaration of competing interest
The authors declare that they have no known competing finan-cial interests or personal relationships that could have appeared to influence the work reported in this paper.
Journal of Environmental Radioactivity 219 (2020) 106269
8
C.R. Carrigan et al.
Fig. 8. (a) Conditions at the interface between a rock melt and rubble (granite shown here) were simulated on the laboratory scale using rock samples of different types. Both
pre-heated and room-temperature samples were placed into molten glass (∼1400◦C) to evaluate changes in the interfacial region. (b) Partial decomposition and fracturing of a
granitic block occurred during cooling after immersion in the glass melt. However, this set of different rock samples, with varying water contents, did not produce a significant network of bubbles or release gases that could drive radioxenon from the melt zone.
Acknowledgments
Most of the analytical development and computer simulations per-formed for this research project were supported by the Office of Defense Nuclear Nonproliferation Research and Development, U.S. Department of Energy and performed under the auspices of the U.S. Department of Energy by Lawrence Livermore National Laboratory under Contract No. DE-AC52-07NA27344. The rock-melt experiments and subsequent analysis were performed at Institut de Physique du Globe, Géomatéri-aux, Université de Paris. C.R. Carrigan thanks the Lawrence Livermore Professional Research and Teaching Program, the French Alternative Energies and Atomic Energy Commission (CEA, DAM Île-de-France) and the University of Paris, for their most generous support during his 2019 visit to France, which made possible the research collaborations required to make this paper a reality. Finally, we thank Dr. Kurt Ungar of Health Canada and two anonymous reviewers for their detailed and helpful comments which significantly improved this manuscript.
References
Achim, P., Generoso, S., Morin, M., Gross, P., Le Petit, G., Moulin, C., 2016. Characterization of Xe-133 global atmospheric background: implications for the international monitoring system of the comprehensive nuclear-test-ban treaty. J. Geophys. Res-Atmos 121, 4951–4966.
Adushkin, V.V., Leith, W., 2001. The Containment of Soviet Underground Nuclear Explosions. U.S.G.S. Open File Report 01-312, p. 52.
Auer, M., Kumberg, T., Sartorius, H., Wernsperger, B., Schlosser, C., 2010. Ten years of development of equipment for measurement of atmospheric radioactive xenon for the verification of the CTBT. Pure Appl. Geophys. 167, 471–486.
Bateman, H., 1910. Solution of a system of differential equations occurring in the theory of radioactive transformations. Proc. Cambridge Philos. Soc. 15, 423–427.
Borg, I.Y., 1975. Radioactivity trapped in melt produced by a nuclear explosion. Nucl. Technol. 26 (1), 88–100.http://dx.doi.org/10.13182/NT75-A24406.
Butkovich, T.R., 1974. Rock Melt from an Underground Nuclear Explosion. University of California, Lawrence Livermore Laboratory Report UCRL-51554.
Carrigan, C.R., 1987. The magmatic Rayleigh number and time dependent convection in cooling lava lakes. Geophys. Res. Lett. 14, 915–918.
Carrigan, C.R., Sun, Y., Hunter, S.L., Ruddle, D.G., Simpson, M.D., Obi, C.M., Huckins-Gang, H.E., Prothro, L.B., Townsend, M.J., 2020. Gas transport across the low-permeability containment zone of an underground nuclear explosion. Sci. Rep. 10, 1437.http://dx.doi.org/10.1038/s41598-020-58445-1.
Carrigan, C., Sun, Y., Hunter, S., Ruddle, D., Wagoner, J., Myers, K., Emer, D., Drellack, S., Chipman, V., 2016. Delayed signatures of underground nuclear explosions. Sci. Rep. 6, 1–9.http://dx.doi.org/10.1038/srep23032.
Carrigan, C.R., Sun, Y., Simpson, M.C., 2019. The characteristic release of noble gases from an underground nuclear explosion. J. Environ. Radioact. 196, 91–97.
Department of Energy, 2015. United States Nuclear Tests: 1945 through 1992. US Department of Energy Report 47 DOE/NV-209-REV 16.
Dodge, D.A., 2018. Searching for induced seismicity at Punggye-ri nuclear test site using subspace detectors. Seismol. Res. Lett. 89 (6), 2094–2112.
Egorov, V.A., Kolobashkin, V.M., Kudryashov, N.A., 1979. Gas temperature and pressure in the cavity of an underground explosion. Combust. Explos. Shock Waves 15, 654–659.http://dx.doi.org/10.1007/BF00740597.
England, T.R., Rider, B.F., 1994. ENDF-349 Evaluation and Compilation of Fission Product Yields 1993. Los Alamos National Laboratory, LA-UR-94-3106. Fauré, J., 1970. Study of the mineralogical transformations of granite by underground
nuclear explosions. In: Proc. Engineering with Nuclear Explosives, Vol. 2. (Am. Nucl. Soc.), p. 1406.
Gueibe, C., Kalinowski, M.B., Baré, J., Gheddou, A., Krysta, M., Kusmierczyk-Michulec, J., 2017. Setting the baseline for estimated background observations at IMS systems of four radioxenon isotopes in 2014. J. Environ. Radioact. 178–179, 297–314.
Hao, Y., Sun, Y., Nitao, J.J., 2012. Overview of NUFT - a versatile numerical model for simulating flow and reactive transport in porous media. In: Zhang, et al. (Eds.), Ground Water Reactive Transport Models. Bentham Science Publishers. Heckman, R.A., 1964. Deposition of thermal energy by nuclear explosive. In:
Engineer-ing with Nuclear Explosives - Third Plowshare Symposium. University of California, Davis, pp. 289–303.
Higgins, G.H., Butkovich, T.R., 1967. Effects of Water Content, Yield, Medium and Depth of Burst on Crater Radii. Report UCRL-5023, Lawrence Radiation Laboratory, Livermore, CA.
Hoffman, I., Berg, R., 2018. Medical isotope production, research reactors and their contribution to the global xenon background. J. Radioanal. Nucl. Chem. 318 (1), 165–173.http://dx.doi.org/10.1007/s10967-018-6128-2.
Johnson, G.W., Violet, C.E., 1958. Phenomenology of Contained Nuclear Explosions. University of California, Lawrence Radiation Laboratory, http://dx.doi.org/10.
2172/4254880, UCRL-5124(Rev. 1).
Kalinowski, M.B., Axelsson, A., Bean, M., Blanchard, X., Bowyer, T.W., Brachet, G., Hebel, S., McIntyre, J.I., Peters, J., Pistner, C., Raith, M., Ringbom, A., Saey, P.R.J., Schlosser, C., Stocki, T.J., Taffary, T., Ungar, R.K., 2010. Discrimination of nuclear explosions against civilian sources based on atmospheric xenon isotopic activity ratios. Pure Appl. Geophys. 167 (4–5), 517–539.
Kersting, A.B., Smith, D.K., 2006. Observations of Nuclear Explosive Melt Glass Textures and Surface Areas. Lawrence Livermore National Laboratory Technical Report, UCRL-TR-218361.
Kieffer, S.W., Simonds, C.H., 1980. The roll of volatiles and lithology in the impact cratering process. Rev. Geophys. Space Phys. 18 (1), 143–181.
Le Petit, G., Cagniant, A., Gross, P., Douysset, G., Topin, S., Fontaine, J.P., Taffary, T.,
Moulin, C., 2015. SpalaxTMnew generation: A sensitive and selective noble gas
system for nuclear explosion monitoring. Appl. Radiat. Isotopes 103, 102–114. Lide, D.R., 1997. Handbook of Chemistry and Physics, seventy-eighth ed. CRC Press,
Boca Raton, FL.
Nitao, J.J., 1998. User’s Manual for the USNT Module of the NUFT Code, Version 3.0 (NP-Phase, NC-Component, Thermal). Lawrence Livermore Technical Report, UCRL-MA-130653-REV-2.
Olsen, C.W., 1967. Time history of the cavity pressure and temperature following a nuclear detonation in alluvium. J. Geophys. Res. 72 (20), 5037–5041. http:
Journal of Environmental Radioactivity 219 (2020) 106269 C.R. Carrigan et al.
Oppenheimer, C., McGonigle, A.J.S., Allard, P., Wooster, M.J., V. Tsanev, V., 2004. Sulfur, heat, and magma budget of Erta ‘Ale lava lake, Ethiopia. Geology 32, 509–512.
Oswald, R., 2013. North Korean nuclear test more than twice as powerful as last blast. In: Global Security Newswire. (Date of access:16/12/2015).
Picq, J.M., 1970. Study of chemical reactions in the nuclear underground explosion -Incidence on radioactivity. In: Proc. Engineering with Nuclear Explosives, Vol. 1. Am. Nucl. Soc., pp. 850–858.
Rabb, D.D., 1970. Particle-size distribution study: Piledriver event. In: Symposium on Engineering with Nuclear Explosives. American Nuclear Society, Las Vegas, Nevada, pp. 888–908.
Ringbom, A., Axelsson, A., Aldener, M., Bowyer, T.W., Fritioff, T., Hoffman, I., Khrustalev, K., Nikkinen, M., Popov, V., Popov, Y., Ungar, K., Wotawa, G., 2014. Radioxenon detections in the CTBT international monitoring system likely related to the announced nuclear test in North Korea on February 12, 2013. J. Environ. Radioact. 128, 47–63.
Saey, P.R.J., Bowyer, T.W., Ringbom, A., 2010. Isotopic noble gas signatures released from medical isotope production facilities - simulations and measurements. Appl. Radiat. Isotopes 68 (9), 1846–1854.
Saey, P.R.J., De Geer, L.-E., 2005. Notes on radioxenon measurements for CTBT verification purposes. Appl. Radiat. Isotopes 63, 765–773.
Schwartz, L., Piwinskii, A., Ryerson, F., Tewes, H., Beiriger, W., 1984. Glass produced by underground nuclear explosions. J. Non-Cryst. Solids 67 (1–3), 559–591. Sloan, J., Sun, Y., Carrigan, C., 2016. Uncertainty quantification for discrimination
of nuclear events as violations of the comprehensive nuclear-test-ban treaty. J. Environ. Radioact. 155, 130–139.
Sun, Y., Buscheck, T.A., Hao, Y., 2012. An analytical method for modeling first-order decay networks. Comput. Geosci. 39, 86–97.
Sun, Y., Carrigan, C.R., 2016. Thermally driven advection for radioxenon transport from an underground nuclear explosion. Geophys. Res. Lett 43, 4418–4425.http:
//dx.doi.org/10.1002/2016GL068290.
Sun, Y., Carrigan, C.R., Hao, Y., 2015. Radioxenon production and transport from an underground nuclear detonation to ground surface. Pure Appl. Geophys. 172, 243–265.
Wadman, R.E., Richards, W.D., 1961. Postshot Geologic Studies of Excavations below Rainier Ground Zero. Lawrence Radiation Laboratory, p. 27, UCRL 6586.
Zhang, Y., Zindler, A., 1989. Noble gas constraints on the evolution of the earth’s atmosphere. J. Geophys. Res. 94 (B10), 13719–13737.http://dx.doi.org/10.1029/