HAL Id: hal-02317269
https://hal.archives-ouvertes.fr/hal-02317269
Preprint submitted on 22 Oct 2019
HAL is a multi-disciplinary open access
archive for the deposit and dissemination of sci-entific research documents, whether they are pub-lished or not. The documents may come from teaching and research institutions in France or
L’archive ouverte pluridisciplinaire HAL, est destinée au dépôt et à la diffusion de documents scientifiques de niveau recherche, publiés ou non, émanant des établissements d’enseignement et de recherche français ou étrangers, des laboratoires
The Voyage of Metals in the Universe from
Cosmological to Planetary Scales: the need for a Very
High-Resolution, High Throughput Soft X-ray
Spectrometer
F. Nicastro, J. Kaastra, C. Argiroffi, E. Behar, S. Bianchi, F. Bocchino, S.
Borgani, G. Branduardi-Raymont, J. Bregman, E. Churazov, et al.
To cite this version:
F. Nicastro, J. Kaastra, C. Argiroffi, E. Behar, S. Bianchi, et al.. The Voyage of Metals in the Universe from Cosmological to Planetary Scales: the need for a Very High-Resolution, High Throughput Soft X-ray Spectrometer. 2019. �hal-02317269�
The Voyage of Metals in the Universe from
Cosmological to Planetary Scales
the need for a Very High-Resolution,
High Throughput Soft X-ray Spectrometer
5 Mpc
Gas metallicity (Eagle)
F. Nicastro1& J. Kaastra2
1Istituto Nazionale di Astrofisica - Osservatorio Astronomico di Roma (INAF - OAR), Via di Frascati 33, 00078 Monte
Porzio Catone (RM), Italy.
2Netherlands Institute for Space Reasearch (SRON), Sorbonnelaan 2, 3584 CA Utrecht, The Netherlands.
Abstract
Metals form an essential part of the Universe at all scales. Without metals we would not exist, and the Cosmos would look completely different. Metals are primarily born through nuclear pro-cesses in stars. They leave their cradles through winds or explosions, and then start their journey through space. This can lead them in and out of astronomical objects on all scales, ranging from comets, planets, stars, entire galaxies, groups and clusters of galaxies to the largest structures of the Universe. Their wanderings are fundamental in determining how these objects, and the entire universe, evolve. In addition, their bare presence can be used to trace what these structures look like.
The scope of this paper is to highlight the most important open astrophysicals problems that will be central in the next decades and for which a deep understanding ofthe Universe-wandering metals, their physical and kinematical states and their chemical compositionrepresents the only viable solution. The majority of these studies can only be efficiently performed through High Res-olution Spectroscopy in the soft X-ray band.
1
Introduction
Metals1form an essential part of the Universe at all scales. Without metals we would not exist, and the Cosmos would look completely different. Metals are primarily born through nuclear processes in stars. They leave their cradles through winds or explosions, and then start their journey through space. This can lead them in and out of astronomical objects on all scales, ranging from comets, planets, stars, entire galaxies, groups and clusters of galaxies to the largest structures of the Universe. Their wanderings are often fundamental in determining how these objects evolve. Additionally, their bare presence can be used to trace what these structures look like.
Because the majority of the ordinary matter in the Universe (i.e. baryons) is in the form of hot or warm plasma, it emits and absorbs X-ray line radiation that can only be studied using high-resolution X-ray spectroscopy. But even colder gas or dust (i.e. the major tracers for star formation) can be studied through absorption of background X-rays.
After the first pioneering observations with the grating spectrometers of the Einstein and EX-OSAT satellites, the field of high-resolution X-ray spectroscopy became mature through the grating spectrometers on board of Chandra and XMM-Newton (both launched in 1999). In 2016 the first microcalorimeter spectrum was obtained through the Hitomi satellite. This offered the opportu-nity to study spatially extended sources, in particular with high resolution at high energies. The technique holds great promise for the Hitomi successors XRISM and ESA’s big flagship mission Athena.
Still, in the soft X-ray band these new missions have lower energy resolution (R < 200 for oxygen) than the current gratings on Chandra and XMM-Newton, which have an effective area in this band of 80 cm2or less. Despite this, the soft X-ray band below 1.5 keV is actually the richest one in terms of diagnostic power because it contains spectral lines from all metals heavier than boron in all ionisation stages.
There is a large number of important astrophysical questions that need high resolving power in the soft X-ray band, in order to be properly addressed:
• Where and in what physical state are the Universe’s missing baryons, and how does their wandering in-and-out of structures affect the evolution of the Universe and of its different components?
• How do winds from Active Galactic Nuclei (AGNs), Supernovae (SNs) and X-ray binaries (XRBs) redistribute metals in their surroundings?
• Where are the metals and in which atomic – solid state are they locked?
• How do stellar winds affect the chemical composition of exoplanets and the general condi-tions for the existence of life as we know it?
While Athena will open up the road to the solution of these important problems, by detecting, both in emission and absorption, the densest 20% of the extremely tenuous and diffuse gas that permeates the space between and around galaxies, none of these can be completely addressed with-out the soft X-ray sensitivity (square root of effective area and resolving power) needed to detect the remaining 80% of this medium and the resolving power needed to disentangle all its different physical components and study their dynamics. This is key to understanding structure formation and their evolution.
In this paper we present these questions in some detail and conclude (Sect. 7) by defining the mission-concept needed to complete Athena’s baryon census and address all these questions: a medium-size (according to ESA standard) soft X-ray dispersive spectrometer (HiReX ) with a re-solving power of 5 000–10 000, and an effective area of 1 500–2 000 cm2over the 0.2–1.5 keV band. Such a mission in the 2035–2050 timeframe, would not only greatly benefit from its large prede-cessor Athena (which will also define a number of important signposts to be followed up in greater detail by HiReX ) but would synergetically operate with all the already foreseen ground-based as well as space missions over the entire multi-messenger spectrum.
2
Galaxy-IGM coevolution: physics, kinematics and chemistry of large
scale inflows and outflows
During the Universe’s childhood (from age ∼ 0.2 − 2 billion years), most of its baryonic matter, still in an almost primordial composition, permeated the Intergalactic medium (IGM), filling the space between gently forming galaxies, nurturing them and in turn receiving heating photons from newly born stars and the first quasars. These baryons imprint a forest of H i Lyman-α absorption lines in the optical spectra of high-z quasars, and this is how we know of their presence, amount, location and physical state (e.g., Rauch 1998; Weinberg et al. 1997). At the age of only ∼ 2 billion years, however, puberty impetuously bursted in and the Universe’s growth became frantic: structures began growing quickly in size, by devouring material from the surrounding space at higher and higher rates, phagocytising nearby companions and grouping with close friends.
According to hydro-dynamical simulations for the formation of structures in the Universe (e.g., Cen & Ostriker 2006; Schaye et al. 2015), this activity was accompanied by a metamorphosis of the tenuous photo-ionised material filling the space between galaxies and feeding their growth: baryons in the IGM were more and more violently pulled towards the growing gravitational potential wells of virialised structures and shrunk into a web of sheets and filaments getting shock-heated to temperatures of T ' 105 − 107 K and so becoming virtually invisible in H i absorption. At the same time, freshly metal-enriched baryons started roaming out of galaxy’s disks, pushed out by powerful supernovae and Active Galactic Nuclei (AGN) winds, wandering into and metal-polluting the circum-galactic medium (CGM) and the surrounding IGM. This cycle of baryons and metals in and out of galaxies proceeded essentially unchanged till our day, and most of the Universe’s ordinary matter today should therefore be in a highly ionised state, heavily metal-enriched and concentrated in the filaments and nodes of the cosmic web.
All this however, has not been observationally verified yet (from which, the so called ’missing-baryon’ problem), the main reason being the lack of proper instrumentation in the X-rays. Extreme-UV (to which we are blind because we are located in the disk of the Galaxy) and X-ray photons are those that most efficiently interact with highly ionised metals, i.e. with the majority of the baryons of the Universe, so that the physics, kinematics and chemistry of these baryons can only be studied through high-resolution X-ray spectrometers, especially in the 0.1–1.5 keV band, where most of the astrophysically abundant elements have their photo-electronic transitions and imprint remarkable emission and absorption lines.
2.1 The Intergalactic Medium at z< 2
The local IGM should be populated with hot baryons with temperatures of about 1 million degrees. At these temperatures, hybridly ionised gas (i.e. shock-heated gas undergoing additional photo-ionisation by the metagalactic radiation field) has only one neutral atom of hydrogen out of ten million and residual opacity due to astrophysically abundant metals. In particular the He-like ion of oxygen is expected to imprint a “savannah” of He-α absorption lines, each with rest-frame equiv-alent width EW.10 mÅ, in high resolution soft X-ray spectra of background quasars, analogous to the HI Lyman-α forest seen in the optical spectra of quasars at z > 2 (e.g., Cen & Fang 2006). The strongest of these lines (EW ∼ 10 − 20 mÅ) are imprinted by the innermost parts of the CGM of large and rare intervening halos, while the weakest and more common lines (EW ∼ 1 mÅ) are produced by tenuous intervening filaments of the intergalactic web (e.g., Fang et al. 2002; Wijers et al. 2019).
The search for the O vii-savannah from the missing hot baryons in the intergalactic medium (the so called Warm-Hot Intergalactic Medium: WHIM) started about 20 years ago, when the first rela-tively high resolution X-ray spectrometers became available with the NASA and ESA observatories Chandra and XMM-Newton. However, after a number of failed attempts and controversial tentative results (e.g., Nicastro et al. 2017; Bonamente et al. 2016, and references therein) it became clear that the resolving power and effective areas of these instruments were just not up to the task and that smart observational strategies (very long exposures of bright, relatively high-z targets, coupled with the identification of WHIM signposts) needed to be put in place.
To date, we can only rely on a couple of possible detections, at locations with dramatically dif-ferent surrounding galaxy environments (Nicastro et al. 2018). With current instrumentation, and over the next 10 years, carefully selected observing programs can be used to strengthen our confi-dence in these detections and perhaps add a few more WHIM candidates to the census, but clearly the first breakthrough in this field must await missions like Athena, for which one of the science goals is indeed the detection of the missing baryons in a WHIM. However, given its limited spectral resolution in the soft X-ray band (R' 200 at 0.5 keV), Athena will only be able to detect 100–200 of the strongest (EW&5 mÅ) O vii WHIM filaments, which should represent only about 20% of the WHIM baryon mass. Moreover, with its ∼ 1500 km s−1 resolution at 0.5 keV, Athena will not be able to resolve the several expected phases of the IGM web, the kinematics (and thus energet-ics) of the material inflowing onto galaxies and outflowing from them, temperature and metallicity gradients throughout the probed halos, etc.
To increase the number of IGM hot baryon filaments to thousands and detect ≥ 80% of the WHIM mass, to study the physics, kinematics and chemistry of these baryons in details and so understand the IGM-galaxy co-evolution with cosmic time, a much higher resolution soft X-ray spectrometer is needed, with a resolving power sufficient to resolve thermal (and therefore also turbulent) velocities of light metals in gas with temperatures of ∼ 106K.
35.8 36 36.2 36.4 10.4 10.6 10.8 11 11.2 -60 -40 -20 0 -1000 0 1000 2000 -20 -10 0 57.8 58 58.2 58.4 40.4 40.6 40.8 41 41.2 -5 0 5 1500 2000 2500 -5 0 5
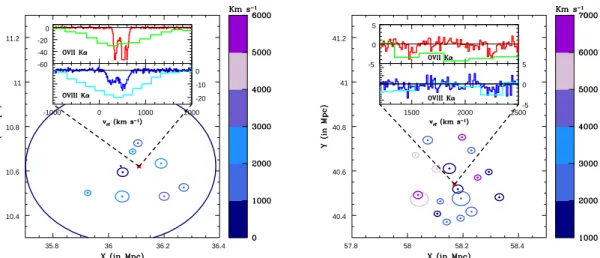
Figure 1: Two distinct regions extracted from the 100 Mpc3periodic box Eagle simulation. The boxes start at z= 0.10064
(rest-frame velocity vrf= 0) and extend to hubble-flow distances vrf= 6770 km s−1(the size of the periodic box). Circles
are all the halos with comoving M200 ≥ 109 M and within 200 comoving kpc from the the lines of sight present in the
simulations. Circles have radius equal to half the halo’s virial radius in comoving kpc and are color-coded in rest-frame velocity (i.e. redshift) according to the bar-legend to the right of the figures. The inserts in the two panels are small portions of mock HiReX (red and blue histograms) and Athena/X-IFU (green and cyan histograms) spectra of the two lines of sight (red crosses near the center of the boxes), centered on the O vii He-α (top panels) and O viii Lyman-α (bottom panels) transitions at the redshifts of the hot intervening absorbers present in these two boxes. Mock spectra have
been produced with the fitting package Sherpa (Freeman et al. 2001) adopting a model consisting of theΓ = 2
power-law continuum of a bright (F0.2−1.35 keV= 10−11erg s−1cm−2) background AGN times the opacity to the metal transition
produced by the gas in the simulation boxes, and integrating for 100 ks (left panel) and 1 Ms (right panel).
2015; Crain et al. 2015). These two Eagle regions are dramatically different in galaxy environment and IGM properties, and have been chosen to show the vast range of physical, kinematical and chemical conditions predicted for the local hot IGM depending on the amount of feedback that different regions of the Universe undergo. The insert of Fig. 1a (left panel) shows HiReX (red and blue histograms) and Athena/X-IFU (green and cyan histograms) mock spectra of two strong and multi-component O vii (top panel) and O viii (bottom panel) absorbers, spanning a range in rest-frame velocity vrf ' 50 − 800 km s−1. The total EWs are 49.5+2.6−0.6mÅ for O vii and 24.6 ± 0.9 mÅ
for O viii as measured with HiReX in only 100 ks. These complex absorbers are clearly associated with the hot gas permeating the largest halo present along this line of sight (M200c= 2.8×10¹³M ),
with a rest-frame (Hubble-flow plus peculiar) velocity vHalorf ' 470 km s−1and a line of sight impact parameter of only 61 kpc. The Athena/X-IFU will detect both the O vii and O viii absorbers, but only an instrument like HiReX would allow us tounambiguously resolve their multi-component nature and precisely measure temperature and density gradientsacross the ∼ 750 km s−1 broad O vii He-α and O viii Lyman-α opacity profiles, thus enabling a line-of-sight tomography of the hot halo medium.
It is worth mentioning that there is also great synergetic potential of HiReX and imaging X-ray observatories featuring high effective area and equipped with micro-calorimeters (e.g. Athena) thanks to their capability to detect WHIM in extended diffuse emission in oxygen lines (boosted by resonant scattering of the cosmic X-ray background). Combining high-resolution absorption-line studies by HiReX with such data will allow the determination of the physical state of the WHIM gas, e.g. differentiate truly a diffuse medium of small overdensity from denser clumps having a
low filling factor(see, e.g., Churazov et al. 2001; Khabibullin & Churazov 2019).
Fig. 1 (right panel) shows a dramatically different case. Two much weaker O vii and O viii absorbers are present along this line of sight, at rest-frame velocities v1rf ' 1450 − 1550 km s−1and
v2rf ' 2150 − 2350 km s−1. Their EWs, as measured with HiReX in 1 Ms (red and blue histograms),
are for component 1: 0.50+0.11−0.09mÅ (5.4σ, O vii), 0.37+0.11−0.10mÅ (3.7σ, O viii) and for component 2:
0.60+0.09−0.09mÅ (6.4σ, O vii), 0.46+0.09−0.11mÅ (4.2σ, O viii).
Absorber 1 is produced by the outskirts (impact parameter of 0.7 virial radii) of the CGM of a small halo with M200c = 4.6 × 10⁹M and rest-frame (Hubble-flow plus peculiar) velocity vhalorf = 1500
km s−1. Absorber 2, instead, is not clearly (i.e. with similar vrf) associated with the CGM (or CGM’s
outskirts) of any halo in the box, and is therefore imprinted by a truly diffuse intervening WHIM filament with its external parts hotter than the center (compare the symmetrically broader profile of the O viii Lyman-α absorber to the narrower profile of the O vii He-α absorber). The Athena/X-IFU (green and cyan histograms) does not resolve the two absorbers and detects only the sum of the two O vii (not O viii) lines, thus not allowing for a clear halo association.
This wealth of diagnostics can only be achieved with soft X-ray resolving powers R& 5000.
2.2 The Circum-Galactic Medium
2.2.1 The CGM of the Milky Way
Despite many obstacles, the Milky Way is still one of the best laboratories to test our understanding of galaxy formation and evolution. High resolution X-ray spectroscopy is essential in addressing several outstanding important questions in this field. The hot phase of the CGM can only be probed via spectroscopic features from highly ionised metal species such as O vii and O viii. The soft X-ray band between 0.2–2 keV also offers a unique opportunity to probe the cold, warm, and hot phases of the Milky Way CGM simultaneously, and therefore provides a complete census of the baryon content of the Milky Way. Athena (Barcons et al. 2017) will detect absorption lines with EWs greater than 5 mÅ near the strong lines of O vii and O viii but with poor velocity information. On the other hand, with its high sensitivity (Aeff ∼1 500–2 000 cm−2) and high spectral resolution (R ∼ 10 000), HiReX will be able to provide detailed information on the physical, kinematic, and chemical status of the Milky Way CGM at a level that cannot be addressed by Athena.
Baryonic content of the Milky Way
Recent studies suggested that a large amount of the baryons in the Milky Way is missing (e.g., Maller & Bullock 2004; McGaugh et al. 2010). These missing baryons are either located in the distant hot halo or dispersed in the local large scale structure via some feedback processes (e.g., Fang et al. 2013; Miller & Bregman 2015; Faerman et al. 2017; Bregman et al. 2018). However, the fate of these baryons is very difficult to determine with the current generation of X-ray telescopes because: (1) the coupling with the Doppler-b (line width) parameter leads to large uncertainties in the column density measurements of ion species such as O vii and O viii; (2) we lack the information on the ionisation state as well as the chemical abundance of the CGM. The decoupling of the Doppler-bparameter and the column density can be achieved by measuring high-order transitions such as the O vii Heβ line, which so far can only be done with two or three very high S/N sight lines toward background AGNs. However, HiReX is more than 1 000 times more sensitive than the current-generation X-ray spectrometers, and it will allow us to obtain an accurate measurement of ion column densities for more than 100 AGN sight lines. Furthermore, with the high spectral resolution, HiReX can clearly detect and resolve nearly all the ionisation stages of oxygen from O i to O viii, as well as several other ion species. This allows for a precise determination of the ionisation mechanism, and the relative abundance of the metals. With this information, we expect a complete understanding of the fate of the missing baryons in our Milky Way galaxy.
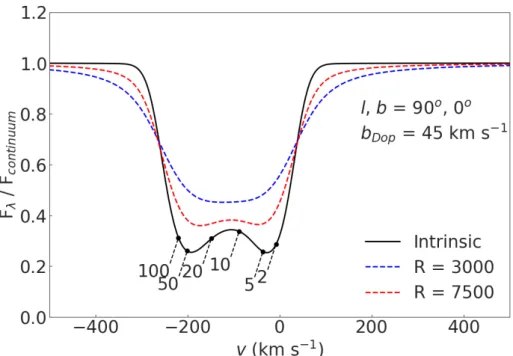
Figure 2: The O vii Heα absorption line from a rotating Galactic hot halo (Hodges-Kluck et al. 2016), modeled with vφ= 180 km s−1, toward l= 90◦, b= 0◦, with Doppler parameter b= 45 km s−1(Miller et al. 2016). The contributions as
a function of distance from the Sun are shown along the bottom of the intrinsic curve, in kpc. The rotation curve of the hot halo, which is encoded in the line shape, can be determined from high spectral resolution observations.
Kinematic, physics and chemistry of the Milky Way CGM
By providing velocity information, high resolution spectroscopy is critical in diagnosing the physi-cal, kinematic, and chemical states of the Milky Way CGM. With velocity information, we can find outwhether the X-ray absorbing gas is in a state of rotation/inflow/outflow, resolve the absorption
lines into different components, and distinguish between thermal and turbulent line broadening.
A resolution of R ∼ 5 000 − 10 000 can help match physically distinct phases and measure bulk velocity better than ∼5–10 km s−1(based on the line centroid) and measure the Doppler-b param-eter to better than ∼10–20 km s−1 (based on line width). Such resolution is necessary to resolve line profiles and so, for example, discriminate between a rotating and non-rotating hot halo (vital for understanding the accretion and feedback history of the Galaxy; Fig. 2), separate different line transitions (e.g., O ii Kβ from O vi Kα, and O ii Kα from O2 Kα), resolve bulk velocity for C, O,
and Fe, and resolve turbulent from thermal motion at T < 107 K. This is a critical advantage of HiReX over Athena as the latter, with a resolution of R ∼ 200, can detect lines without being able to resolve them.
2.2.2 The CGM of external galaxies
Athena will likely detect extended hot halo gas around L? (or Schechter Luminosity, Schechter 1976) galaxies to about 100 kpc (according to models; Bregman et al. 2015) but with poor velocity information. These hot halos are likely to extend far beyond 100 kpc (250–500 kpc; Fig. 1), based on models (e.g., Schaye et al. 2015) as well as the observations of stacked Sunyaev-Zeldovich measurements (e.g., Ma et al. 2015). The extent of the hot gas, as well as its mass, composition, and temperature are set by the accretion and feedback processes, which are poorly constrained. These
fundamental properties will be determined by the HiReX spectroscopic mission, providing great advances in our understanding of galaxy formation and evolution.
Missing metals and baryons in external galaxies
The optical parts of galaxies and their gaseous disks are missing about 75% of the metals produced by their stars and 70-90% of the initial baryon content (Peeples et al. 2014; McGaugh et al. 2010). The inner 100 kpc around galaxies will be probed with Athena, but the gas and metal masses increase with radius, so most of the baryons and metals lie beyond 100 kpc. These outer regions will be studied with HiReX , which has a sensitivity about an order of magnitude better than Athena for line detections. It will measure absorption in more than 100 galaxy halos, providing an excellent radial profile of ions (probably to 250–500 kpc, 1–2R200) in the long-lived halo where the cooling
time exceeds a Hubble time. The O vii columns can be estimated from an extrapolation of Milky Way gas and from direct detection along one extragalactic sight line (Bregman et al. 2015; Nicastro et al. 2018). These O vii columns are more than an order of magnitude greater than observed UV O vi sight lines (Savage et al. 2003; Werk et al. 2016) from cooler gas (also true for lower ionisation state lines), so these X-ray absorption lines will yielda definitive measure of the metals, determining whether the missing metals lie within an extended hot halo. This relates directly to the formation and evolution of galaxies.
Single lines of sight will detect only a few lines (He-like and H-like C and O), but by stacking the absorption systems, weaker lines will be revealed. These include higher ionisation lines than O vii, such as O viii, Ne ix, and Ne x, additional lines at the typical ambient temperature of the halo, such as N vi, N vii, as well as lower ionisation state lines, such as O i, O iii, O iv, and O v. These lines will define the temperature distribution of ions, which is caused by cooling and feedback processes and has become an important prediction of models.
Feedback and rotation in external galaxies
Feedback from SNe and AGNs regulates the formation of galaxies and their environment. De-tailed measurements of the hot X-ray gas provide a snapshot of the feedback today. Feedback will cause the outflow of gas from the disk and there will be turbulence caused by these motions (e.g., Sokołowska et al. 2018). The net effect will be to broaden the lines beyond the thermal widths (40–50 km s−1), and HiReX will have the velocity resolution to separate a line into its thermal and turbulent components, the latter being a direct measure of feedback.
A nascent galaxy gains angular momentum from surrounding non-uniform regions, with the rotational velocity increasing as the gas flows to smaller radii (Lagos et al. 2017). This leads us to expect the hot halo to be rotating, although the initial value of the specific angular momentum can be decreased by the accretion of other halos, and if feedback is very effective, it will mix the angular momentum of the hot halo gas. Thus the rotational profile of the hot halo contains vital clues about accretion and feedback. HiReX will measure the velocity of line centers to exceptional accuracy (<30 km s−1) for sight lines through many different galaxy halos, allowing oneto assemble a composite rotation curve to several hundred kpc.
2.3 Outskirts of clusters and groups of galaxies
Clusters and groups of galaxies represent unique signposts in the Universe where both thermo-and chemo-dynamical properties of the diffuse ionised plasma can be studied in detail through X-ray observations. The past (ASCA and Beppo-SAX ) and the current generation (XMM-Newton, Chandra and Suzaku) of X-ray satellites have demonstrated that metals are not homogeneously distributed in the intra-cluster medium (ICM; see Biffi et al. (2018a); Mernier et al. (2018) for
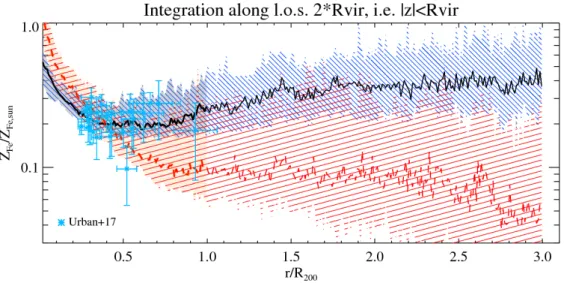
Figure 3: Comparison between observed metallicity profiles in the outskirts of galaxy clusters and results from cosmo-logical hydrodynamic simulations. The cyan asterisks with errorbars correspond to the observational results by Urban et al. (2017) for 10 nearby clusters observed with Suzaku. Simulation results corresponds to the set of simulated clusters whose metallicity profiles have been studied in Biffi et al. (2018b), with blue and red corresponding to simulations that include and exclude the effect of AGN feedback, respectively. The two curves correspond to the median profile computed within the simulation set, while the shaded areas mark the corresponding r.m.s. scatter.
recent reviews on results from simulations and observations). Indeed, relaxed cool-core clusters are characterised by negative metallicity gradients, with an enhanced metallicity in the core regions, likely to be associated to the process of star formation of the galaxies whose assembly gave rise to the Brightest Cluster Galaxies (BCGs) that are at the centre of these clusters. On the other hand, dynamically disturbed non–cool core clusters have a much flatter metallicity gradients, with a lower level of enrichment in central regions. The reason for this is due to the mixing of the gas due to the same dynamical processes which lead to the disruption of the cool core. While these observational results hold out to about one quarter of the virial radius, Rvir, the situation is less clear at larger
radii, where reliable measurements of metallicity are hampered by the low level of emissivity and the corresponding need for precisely characterising background contamination. Indeed, the low particle background of the Suzaku satellite recently allowed to trace, although with rather large uncertainties, the ICM metallicity out to scales approaching the virial radius of a handful of nearby clusters (see Fig. 3).
These studies gave a clear indication of the inextricable link between the recent dynamical history of galaxy clusters and the pattern of chemical enrichment within regions of galaxy clusters and groups which encompass a fraction of their virial region.
Quite interestingly, cosmological hydrodynamic simulations that include a detailed description of chemical enrichment converge to indicate that a negative metallicity gradient in the central re-gions of galaxy clusters and groups naturally arises as the result of the processes of star formation and hierarchical assembly of such structures, independent of the efficiency and nature of the sources of energy feedback that should regulate star formation. On the other hand, the same simulations also predicted that largely different patterns of chemical enrichment are expected in the outer regions of galaxy clusters when including different feedback sources: while feedback from supernovae gener-ates a negative metallicity gradient extending out to the virial radius and beyond, the inclusion of AGN feedback causes a flattening of the metallicity profiles beyond about half of Rvir(e.g., Fabjan
et al. 2010; McCarthy et al. 2011). In fact, this different behaviour is due to the efficiency with which AGN feedback expels metal-enriched gas from the CGM of the proto-cluster galaxies at red-shift z ' 2–4, when gas accretion onto SMBHs reaches the peak of activity. This causes in turn a pre-enrichment of the IGM, which leads to a sort of metallicity floor at low redshift (e.g., Biffi et al. 2018b). This effect is illustrated in Fig. 3, which shows the metallicity profiles predicted by simulations both including (red) and excluding (blue) the effect of AGN feedback, and compares them to observational data on ICM metal enrichment out to the largest radii sampled so far.
While the much higher sensitivity and spectral resolution of Athena/X-IFU are expected to significantly improve with respect to the current observations out to R500 (Cucchetti et al. 2018),
mapping the metallicity of the ICM in emission beyond Rvircould become prohibitively expensive,
or even hardly possible, due to the requirements on the background control and collecting area. At the same time, while current observations of cluster outskirts mainly trace Fe (by mainly measuring the equivalent width of lines in the Fe-K complex), tracing different chemical species would provide further insights on the processes of feedback and gas circulation that determine the cosmic cycle of baryons in general. For instance, Fe and O are expected to be produced by different stellar populations, which are characterised by different lifetimes and, therefore, release them over different time-scales. As a consequence, their distribution could differ, depending on the efficiency of the dynamical processes (e.g. outflow, turbulence) driving their diffusion (Simionescu et al. 2019).
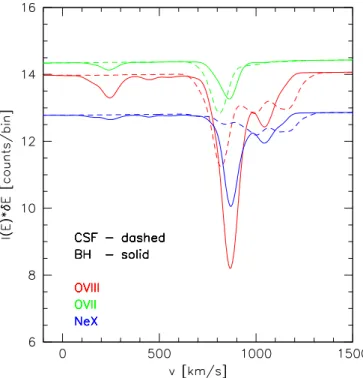
Figure 4: Velocity profile of the absorption lines produced by O vii, O viii and Ne x ions in the spectrum of a background AGN at a projected distance of ∼1.6 Mpc from the center of a massive cluster from simulations of Biffi et al. (2018b). Compared to WHIM, the role of O viii and Ne x is enhanced due to higher temperature of the gas. The dashed and solid lines correspond to the CSF and BH runs, correspondingly. Two prominent absorption structures are present for this sight-line, one at+900 km s−1and a fainter one at+300 km s−1. Each structure possesses an additional kinematic substructure
on top of the thermal broadening. As expected, the lines are significantly stronger in the BH run. The vertical axis shows the number of counts per resolution element for the AGN with 0.5–2 keV flux ∼ 2 10−13erg s−1cm−2and photon index
Γ = 1.2 for a 1 Ms observation with 1500 cm2effective area.
formation-supernova feedback (CSF) and AGN feedback (BH) simulations (Biffi et al. 2018b). As expected, in the BH simulation that involves redistribution of metals by AGN feedback over clus-ter outskirts, the absorption lines are much more prominent. The lines are resolved and can be used to study the flow of metals in cluster periphery. Note, that the higher temperature than in the WHIM leads to stronger lines of O viii and Ne x. This property can be used to separate the WHIM contribution from the hotter cluster outskirts.
High spectral resolution (10–50 times better than calorimeters) absorption tomographic studies of cluster gas allow usto trace different elements at different ionisation stages, and to measure
their spatial distribution and motion along the line-of-sight at large radii (out to 2Rvir) that are
impossible to do in emission.
2.4 AGN and galactic outflows
Current X-ray observatories have established the presence of outflows, produced in the vicinity of supermassive black holes (SMBH) at the heart of AGN. The so-called warm absorbers are detected in a large number of AGN via a wealth of soft X-ray absorption lines from C, N, O, Ne, Mg, Si and S, tracing low ionisation gas outflowing at 100s to 1000s of km s−1and located at a few 10s–100s of parsecs from the SMBH (Kaastra et al. 2000; Kaspi et al. 2002; Blustin et al. 2005). In obscured Seyfert galaxies, this medium is observed via the presence of numerous soft X-ray emission lines. The temperature, density and the source of the ionisation equilibrium of the emitting gas can be measured from radiative recombination continua (RRC) and He-like triplets, as well as from a full characterisation of satellite lines and the Fe L ‘forest’ (Liedahl 1999; Porquet et al. 2010).
There is increasing evidence for the presence of blue-shifted Fe K-shell absorption lines in AGN at rest-frame energies higher than 7 keV (Tombesi et al. 2010; Gofford et al. 2013). These so called ultra fast outflows (”UFOs”) are likely driven off the accretion disk by either radiation pressure (Proga et al. 2000) or magneto-rotational forces (Kato et al. 2004; Fukumura et al. 2015), or both, and the outflow rates derived can be large, of order several solar masses per year. Furthermore these fast, energetic winds, may be the initial stage of the sweeping process that leads to mass losses of hundreds to thousands of M yr−1 on the scale of the AGN host galaxy (Tombesi et al. 2015;
Feruglio et al. 2015). The presence of soft X-ray absorption lines from UFOs has been detected too, showing that these fast winds exhibit different ionisation states (Longinotti et al. 2015; Reeves et al. 2018; Danehkar et al. 2018; Pinto et al. 2018; Serafinelli et al. 2019). These arise from He and H-like O, Ne and L-shell Fe lines and are most apparent when the spectrum is more absorbed overall. This may be associated with lower ionisation gas, like the Broad Absorption Line (BAL) winds in the UV, as part of a clumpy phase of the disk wind capable of producing substantial X-ray obscuration (e.g., NGC 3783, Mehdipour et al. 2017). This process can then facilitate radiative acceleration and driving of winds in powerful quasars at higher redshifts, which are currently beyond reach for soft X-ray spectroscopy.
It is essential to measure all these wind phases over a wide range of radial distances and veloc-ities to understand their nature, their link, their launching mechanism(s) and duty cycle, and thus, ultimately, their relevance in polluting the host galaxy’s surroundings with metals, as predcited by simulations (e.g. Sect. 2.1–2.3, Fig. 3). This can only be performed via accurate measurements of the wind physical properties (e.g., column density, density, ionisation parameter, velocity, dis-tance, time variability) and their relationships, which, in turn, requires high spectral resolution and throughput in the soft X-rays. High resolving power R∼5 000–10 000 is also critical for anaccurate determination of the total wind kinetic power required for galaxy feedback. The X-ray wind en-ergetics can then be compared to that of larger scale molecular and ionised outflows to assess their efficiency in driving (via either energy or momentum) feedback on galaxy scales (Fiore et al. 2017).
A soft X-ray grating with the parameters of HiReX (Sect. 7) is also required to robustly measure wind variability in order to deduce its characteristics.
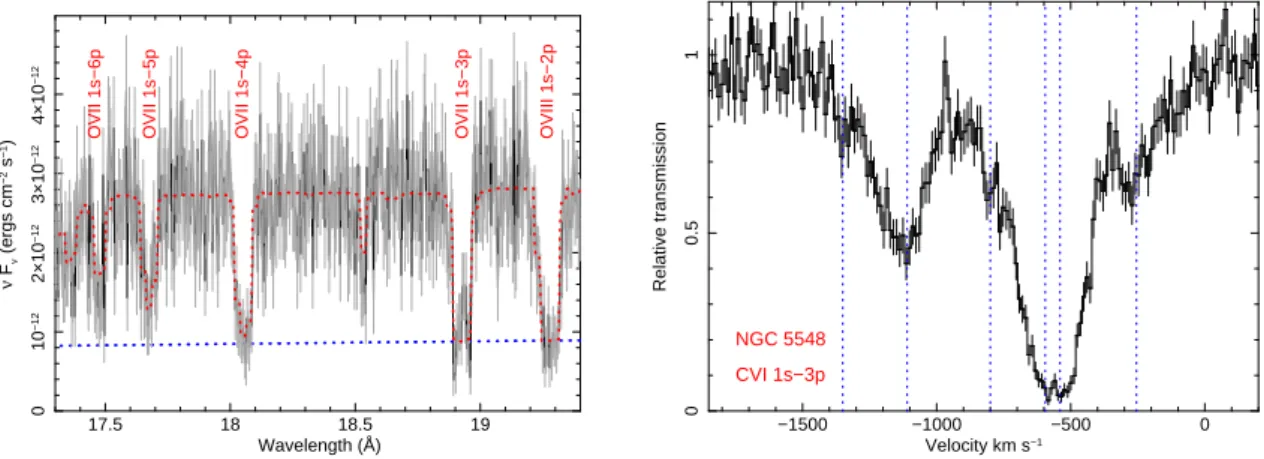
17.5 18 18.5 19 0 10 −12 2×10 −12 3×10 −12 4×10 −12 ν Fν (ergs cm −2 s −1 ) Wavelength (Å) OVIII 1s−2p OVII 1s−3p OVII 1s−4p OVII 1s−5p OVII 1s−6p −1500 −1000 −500 0 0 0.5 1 Relative transmission Velocity km s−1 CVI 1s−3p NGC 5548
Figure 5: Left – simulations of a 20 ks time slice of the variable, fast outflow in PG 1211+143, with a resolution of
R = 5000. The higher order absorption O vii line series is seen in PG 1211+143, where the strongest saturated lines
reveal the covering fraction and the higher order lines determine the column density. Right – a 120 ks simulation of the
Seyfert 1 galaxy, NGC 5548, at a resolution of R= 10000, showing the wind profile in C vi. The wind can be resolved
into at least five distinct velocity components (vertical dashed lines), enabling the wind properties, such as its ionisation, to be mapped as a function of the outflow velocity. A turbulent velocity of σ= 70 km s−1was adopted.
The nearby QSO, PG 1211+143 (at z = 0.0809) has one of the prototype ultra fast outflows at soft X-rays. The current XMM-Newton RGS and Chandra HETGS grating observations have a combined total exposure exceeding 1 Ms (Reeves et al. 2018; Danehkar et al. 2018). However the line diagnostics are currently limited to the strongest 1s → 2p lines, due to the low effective area and resolution, while the mechanism for the outflow variability is uncertain. High throughput and resolution at soft X-rays are prerequisite for measuring absorber variability. Fig. 5 (left panel) shows a HiReX simulation of a short 20 ks (typical variability timescale of AGN in the X-rays) time-slice of PG 1211+143, focused on the O vii line series, demonstrating that the wind variability can be accurately measured on these short timescales. The strongest line profiles (e.g. O viii 1s → 2p and O vii 1s → 3p) are saturated, providing a direct measure of the gas covering fraction, to within 60 ± 5%. Variations in covering could correspond to the transverse motion of outflowing clouds across the line of sight on dynamical size-scales of a few gravitational radii. The weaker higher order absorption lines are not saturated and yield an accurate measure of the hydrogen equivalent column density to within NH= 2.9±0.2×1021cm−2. Changes in ionisation in response to a decrease
in the X-ray continuum, via recombination, can be also be measured to an accuracy of ±5% on a 20 ks timescale. Such monitoring enablesthe density, location and size scale of the absorberto be directly measured (e.g., Nicastro et al. 1999). The data would also allow us to determine the outflow properties, such as the column, covering and ionisation, as a function of the wind velocity. The wind energetics can then be robustly assessed.
The second example is of the Seyfert 1 galaxy, NGC 5548 (at z = 0.017175). This AGN has a notable outflow, spanning at least an order of magnitude in outflow velocity and two orders in ionisation (Kaastra et al. 2014). Presently these outflow components can only be resolved in velocity space through high resolution UV spectroscopy, but not in X-rays; e.g. neither at the resolution of the current X-ray gratings on-board XMM-Newton or Chandra, nor, in ten years from now, with Athena below 1 keV. Fig. 5 (right) shows a 120 ks simulation of the outflow in NGC 5548, based on its un-obscured X-ray state. For illustration, the velocity profile at the C vi 1s → 3p line is plotted, where a resolution of R = 10000 will fully resolve all the wind components. In this example
at least five distinct velocity components are resolved, with v = 250, 550, 800, 1100, 1350 km s−1, each measured to a typical accuracy of ±10 km s−1. Furthermore the wind may vary in ionisation as a function of velocity, e.g. as can occur if the highest ionisation gas originates from the fastest wind components. The high resolution X-ray spectrum would make it possible to measure all the wind properties well beyond those measurable in the narrow ionization windows offered by UV spectroscopy, such as ionisation, as a function of the outflow velocity, providing a multi-dimensional map of the wind and ultimately revealing its complete physical structure.
3
The Inter-Stellar Medium
3.1 Chemical composition and dynamical structure of the ISM
The diffuse interstellar medium (ISM) has a crucial role in the evolution of the Galaxy. Different elements are produced by various types of stellar phenomena (e.g. supernovae type Ia, core-collapse and AGB winds) and their abundances are the direct testimony of the history of stellar evolution. In the neutral phase, heavy elements like iron, calcium, magnesium, etc. are mostly locked into solids and depleted from the gas phase. However, the interstellar dust composition is not well known and the total (gas+ molecules + dust) abundances are yet to be accurately determined. At long wavelengths, for instance, it is still challenging to distinguish between carbonaceous and silicate dust grains (e.g., Min et al. 2007, for the 10µm feature).
The soft X-ray energy band (∼ 0.2–2 keV) contains the strongest transitions of the K shell from the most abundant interstellar atomic species (C, N, O, Ne, Mg, Si) and the Fe L shell. Dust and molecules also imprint a forest of spectral features in the form of X-ray absorption fine structures (XAFS) supporting multi-wavelength studies of interstellar phases and synergies. It is possible to probe the ISM complex composition through the study of interstellar absorption features in the high-resolution X-ray spectra of background galactic X-ray binaries and active galactic nuclei.
High-quality grating spectra unambiguously show the presence of interstellar absorption lines and edges in every spectrum. The whole series of oxygen (O i-viii), N i-ii, Fe i L2 and L3 edges,
Ne i-x and many more species are found (e.g., Juett et al. 2004, 2006; Yao et al. 2009). Strong evidence of dust and molecules in the form of complex XAFS was found in the absorption edges of elements like O, Mg, Si and Fe that are significantly depleted from the gaseous phase (e.g., Lee & Ravel 2005; Lee et al. 2009; de Vries & Costantini 2009). Between 15–25% and 65–90% of the total amount of O i and Fe i (and possibly higher fractions for Mg i and Si i) could be locked in dust grains (Pinto et al. 2010, 2013; Zeegers et al. 2017; Rogantini et al. 2018). Solids may therefore be a significant reservoir of metals and provide a solution to the problem of the missing oxygen, but the uncertainties in the atomic databases and the limited spectral resolution of current detectors (R ∼300–500 for RGS and LETGS) undermine the detection and measurements of dust features (see, e.g., Garc´ıa et al. 2005; Gatuzz et al. 2013). A next-generation detector with superior effective area (A > 1000 cm2) and spectral resolution (R > 1000) at E. 1.5 keV is necessaryto resolve each individual absorption line from the dominant ions and dust compounds.
Micro-calorimeters, like Athena/X-IFU and XRISM Resolve, will have R < 200 at E = 0.5 keV and thus cannot serve to this particular scope. Wavelength-dispersive grating spectrometers are needed. Here we adopt a grating-spectrometer (HiReX ) with R = 5000 resolving power and 2000 cm−2effective area at the Fe L and O K edges (e.g., Heilmann et al. 2017).
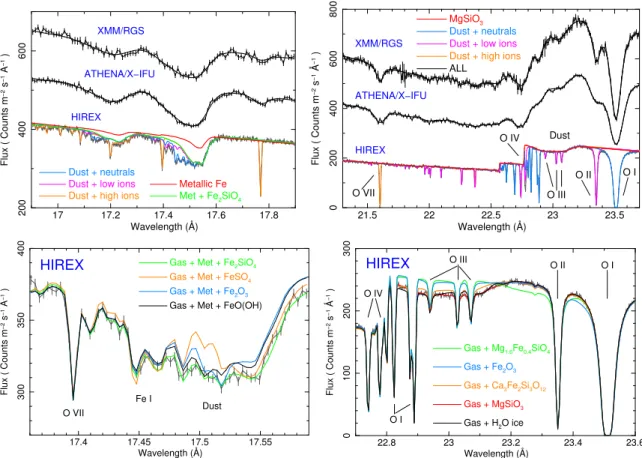
We use as template the best fit model for the RGS stacked spectrum of Cygnus X-2 which includes a comprehensive description of the ISM (neutral and ionised gas plus dust). The dust mainly consists of pyroxene (MgSiO3), metallic iron and fayalite (Fe2SiO4). We have simulated a
17 17.2 17.4 17.6 17.8 200 400 600 Flux ( Counts m −2 s −1 Å −1 ) Wavelength (Å) Metallic Fe Met + Fe2SiO4 Dust + neutrals
Dust + low ions
Dust + high ions
XMM/RGS ATHENA/X−IFU HIREX 21.5 22 22.5 23 23.5 0 200 400 600 800 Flux ( Counts m −2 s −1 Å −1 ) Wavelength (Å) ALL MgSiO3 Dust + neutrals Dust + low ions
Dust + high ions
O I O VII O II Dust O IV O III XMM/RGS ATHENA/X−IFU HIREX 17.4 17.45 17.5 17.55 300 350 400 Flux ( Counts m −2 s −1 Å −1 ) Wavelength (Å)
Gas + Met + Fe2SiO4
Gas + Met + FeSO4
Gas + Met + Fe2O3
Gas + Met + FeO(OH)
O VII Fe I Dust HIREX 22.8 23 23.2 23.4 23.6 0 100 200 300 Flux ( Counts m −2 s −1 Å −1 ) Wavelength (Å) Gas + Mg1.6Fe0.4SiO4 Gas + Fe2O3 Gas + Ca3Fe2Si3O12 Gas + MgSiO3 Gas + H2O ice O I O II O III O IV O I HIREX
Figure 6: Cygnus X-2 HiReX 50 ks spectrum simulated using the RGS fit model as compared to Athena/X-IFU and XMM-Newton/RGS (top panel), which are shifted along the Y-axis for displaying purposes. Low ions refer to e.g. O i-v and high ions to O vi-viii. Only HiReX will be able to resolve individual lines.
All the relevant absorption features are well resolved, even the O iii doublet at 23.05–23.1 Å. The accuracy on the column densities of each molecular compound would be around few % or better. The uncertainties on the velocities of each gas component will be less than few km s−1, providing for the first timeaccurate measurements on both line widths and line of sight velocities. With the current detectors we can only get upper limits of about 100–200 km s−1. Neither RGS nor Athena X-IFU are able to resolve and distinguish the individual features. The uncertainties on gas column densities and temperatures will be better than 5%, enoughto distinguish between photoionisation and collisional equilibrium.
Similar studies will be possible on the ISM of nearby galaxies, by using local X-ray binaries or Ultra-Luminous X-ray sources (ULXs) as beacons, and on the ISM of distant galaxies by observing GRB X-ray afterglows soon after the prompt emission and during their fading phase.
4
Metals in-and-around stars
4.1 Stars
To constrain the metal processing operated by stars the understanding of stellar formation and evo-lution, for both high- and low-mass stars, needs to be improved.
High-mass stars are crucial for a wide range of astrophysical aspects: the starburst events, the chemical enrichment of the Universe, and the multi-messenger astronomy via gravitational wave (GW) events. These stars have a strong impact on their Galactic environment through their winds
and explosions as supernovae. When in binaries, they are the progenitors of double-compact sys-tems which finally merge, emitting GWs. Soft X-rays in massive stars arise in shocks linked to their winds (e.g. G¨udel & Naz´e 2009). X-ray line morphologies are sensitive probes of the properties of these winds (e.g. Herv´e et al. 2013), providing crucial information on many aspects of these outflows. The limited sensitivity of existing facilities and the limited spectral resolution in the soft X-ray domain of forthcoming calorimeters are insufficient to resolve these lines and to study their temporal evolution. A high-resolution and high-efficiency spectrometer in soft X-rays will not only help constrain the mass-loss rates of massive stars, but will allowtracing the impact of small and large-scale wind structures. Doppler tomography of resolved X-ray lines willmap the plasma in the co-rotating magnetosphereof magnetic massive stars. The proposed mission will further allow studying the propagation of photospheric pulsations throughout the stellar wind, investigating the formation of radiative recombination continua, and constraining the fraction of the stellar wind that is under the form of plasma.
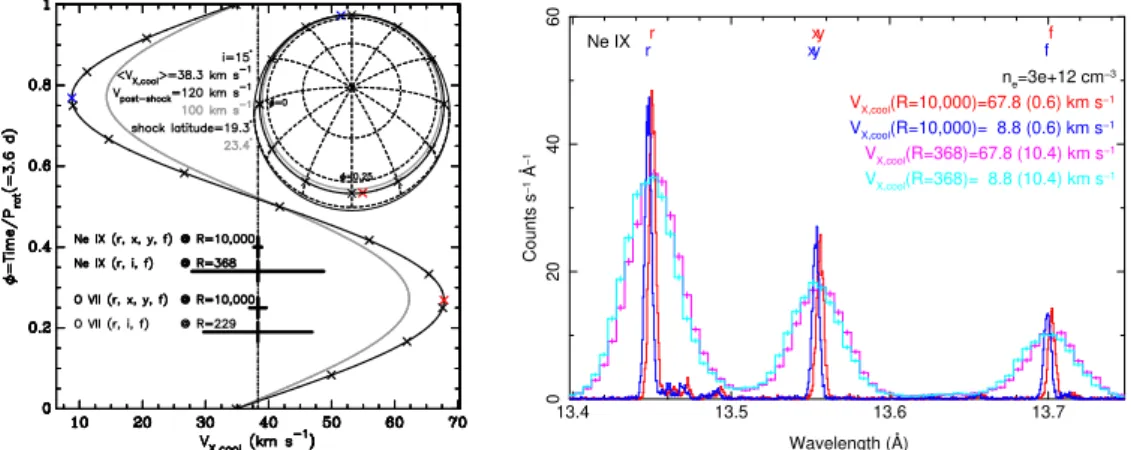
13.40 13.5 13.6 13.7 20 40 60 R10000: 15 ks Wavelength (Å) Counts s −1 Å −1 r xy f r xy f Ne IX ne=3e+12 cm−3 VX,cool(R=10,000)=67.8 (0.6) km s−1 VX,cool(R=10,000)= 8.8 (0.6) km s−1 VX,cool(R=368)=67.8 (10.4) km s−1 VX,cool(R=368)= 8.8 (10.4) km s−1
Figure 7: Kinematics of a point-like accretion-shock at the surface of the young accreting star TW Hya. Left panel: predicted stellar rotational-phase vs. line-of-sight velocity of shocked-plasma at the accretion-stream base. The top-right insert displays the phase-dependent shock position on the sky-projected stellar photosphere. Right panel: simulated X-ray spectra of the Ne ix He-like triplet with a very high-resolution high-effective area soft X-X-ray spectrometer (∆φ=0.05, corresponding to 15 ks), compared to Athena X-IFU (Barret & Cappi 2019). The rms errors on the velocity fitted value (estimated from 500 simulated spectra) are provided between parentheses and as horizontal error-bars in the left panel.
Low-mass stars are the most common and longest living stars. Their evolution is substantially affected by their exchange of mass and angular momentum with their ambient medium during their life. During their formation, low-mass stars accrete mass from their circumstellar disk via magnet-ically channelled streams. At the stream footpoints, the accreting material impacts with the stellar atmosphere producing shocked plasma at ∼3 MK. The current generation of X-ray spectrometers demonstrated that soft X-rays are a powerful probe of the shock region (e.g. G¨udel & Naz´e 2009). The shocked plasma is expected to move inward with v∼100 km s−1. The rotational monitoring of its line-of-sight velocity would tightly constrain the accretion geometry. The limited spectral res-olution in soft X-rays of calorimeters will prevent these kind of studies. Conversely, the proposed mission concept will allowto systematically measure the shocked-plasma velocity (this measure is nowadays achievable only for nearest young accreting star TW Hya, Argiroffi et al. 2017), and to performDoppler-imaging of the shocked plasma on the stellar surfacefor the nearest sources (Fig. 7). This X-ray tomography of the extended shocked emission will be valuable for compari-son with the results of Zeemann-Doppler imaging of stellar photospheres (Donati et al. 2011). In addition, the HiReX mission concept will allow to resolve line widths, and hence to constrain the turbulent motions in the post-shock region.
winds and coronal mass ejections (see Sect. 4.2). These phenomena are governed by the stellar magnetic activity, that is best studied by probing coronal phenomena in X-rays. Flares are the main manifestation of energy transfer from the magnetic field to the coronal plasma. Studying the mo-tions of plasma within flaring structures is important to constrain flare physics, and improve coronal modeling. Plasma located near the flaring loop footpoints (where T ∼10 MK and the emission mea-sure is maximum) is expected to move with v∼100–500 km s−1. Such motions, almost unexplored nowadays in stars, can be systematically studied with HiReX bymonitoring the evolution of line profiles during stellar flares. Athena/X-IFU will likely allow to monitor line shifts (without yet resolving line profiles) only in the extreme cases of very hot flares occurring in extremely active stars.
4.2 Planets
4.2.1 Exoplanet energetic photon radiation environments
The rate at which gas is lost from an exoplanet’s atmosphere is critical for the survivability of surface water. Atmospheric mass loss can be driven by both thermal and non-thermal processes, which depend upon the radiation and winds of their host stars. The dominant thermal process is hydrodynamical outflow energised by extreme ultraviolet (EUV; 100–912 Å) and X-radiation (0.1– 100 Å) that heats the exoplanet’s thermosphere and levitates gas against the exoplanet’s gravitational potential (e.g., Owen & Jackson 2012).
Most of the thermospheric heating is by EUV photons but this radiation cannot be observed directly because of interstellar H absorption. The chromospheric UV and FUV are inadequate EUV proxies. The strength and spectral energy distribution of a star’s EUV emission instead arises from the transition region and corona. The 30–60 Å range contains many lines from the same ionisation stages. Observing these soft X-ray lines enables prediction of the EUV spectrum and thereby constrain the atmospheric mass loss.
Detecting the relevant lines in exoplanet hosts requires very sensitive high-resolution (R ≥ 5 000) spectroscopy that is not feasible with any existing or planned future missions, including Chandra, XMM-Newton or Athena. Observations through flares and other stochastic variability are also required to understand how EUV fluxes vary in time.
4.2.2 Stellar winds coronal mass ejections and exoplanet atmospheric loss
The flow of ionised stellar wind electrons and protons erode an exoplanet’s atmosphere, while coro-nal mass ejections can enhance the loss rate by an order of magnitude or more (Garraffo et al. 2016; Dong et al. 2017; Garcia-Sage et al. 2017; Airapetian et al. 2017). Recent measurements by the MAVEN satellite (Brain et al. 2016) confirmed that the primary mass-loss mechanism for water on Mars is erosion by the solar wind.
The wind mass loss rates for late-type dwarfs are notoriously difficult to measure as the solar mass-loss rate is only about 1.5 × 10⁻¹⁴M yr−1. Radio observations yield only upper limits and
the few indirect estimates possible based on Lyα absorption in the “wall” of hydrogen at the stellar analogy of the heliopause (Wood et al. 2014) are prone to modelling and systematic uncertainty.
Charge-exchange X-ray emission resulting from the interaction of stellar wind ions with ISM neutral H provides a direct means of measuring wind mass loss rates (Wargelin & Drake 2002). The charge exchange X-ray spectrum is dominated by K-shell emission from H-like and He-like ions of C, O, N, and Ne. These lines are broadened by the wind outflow velocity of 500–1000 km s−1 and form broad components underneath the narrower coronal line. A sensitive, low background high-resolution X-ray spectrometer would be ableto resolve out this charge-exchange signal and
simultaneously measure the wind velocity and mass loss rate. This would be new stellar science not feasible at other wavelengths.
In addition to a relatively steady wind, stars are expected to loose mass in coronal mass ejections (CMEs) accompanying flares. CMEs are also associated with high-energy protons accelerated in the flare and CME shock front. CMEs are very difficult to infer on stars and it is currently unknown how much mass and energy are output in this way on stars other than the Sun, and what CME conditions exoplanets experience.
Segura et al. (2010) modeled the effect of a superflare (E ≈ 1034 erg) and CME impact on
a hypothetical Earth-like exoplanet located in the habitable zone (0.16 AU) of the flare star AD Leo (dM3e). High energy protons with energies greater than 10 MeV severely depleted nitrogen oxides, and subsequently ozone, in the atmosphere for 2 years. Airapetian et al. (2016) found CME energetic particles can create important prebiotic molecules and alter atmospheric greenhouse gases potentially important for the Faint Young Sun paradox.
1028 1030 1032 1034 1036 1038
X−ray Energy (erg) 1030
1035 1040
Kinetic Energy (erg)
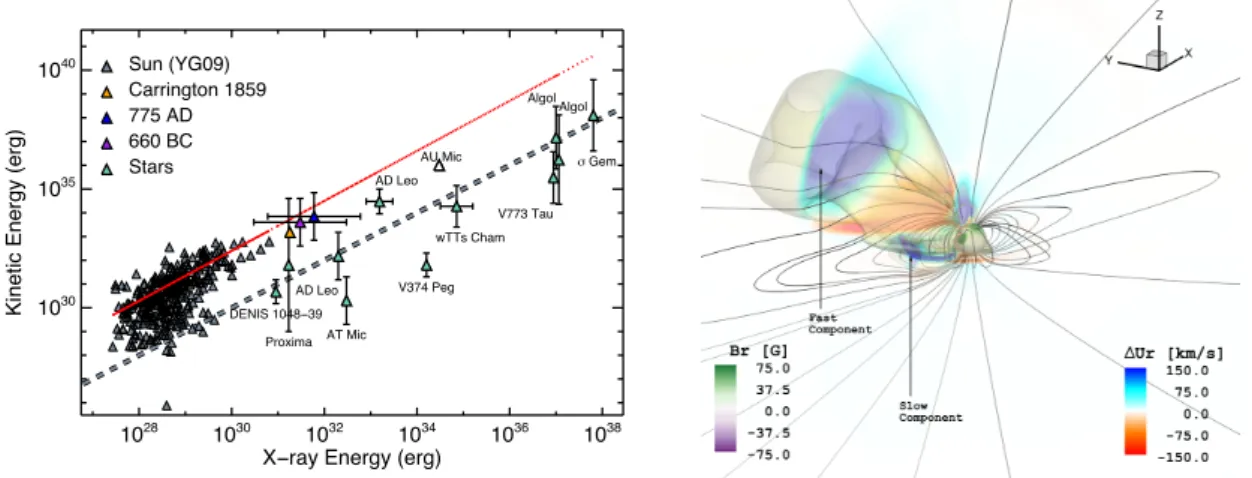
AD Leo AT Mic wTTs Cham AU Mic DENIS 1048−39 AD Leo V374 Peg Algol Proxima Algol V773 Tau σ Gem Sun (YG09) Carrington 1859 775 AD 660 BC Stars
Figure 8: Left: The kinetic energy vs. associated flare X-ray fluence for solar CMEs and CME candidate events from the literature (Moschou et al. 2019). Extrapolating the relation to large events on more active stars is extremely uncertain, requiring definitive CME detections and measurements for characterisation. Right: An MHD CME simulation for a moderately active solar-like star (Alvarado-G´omez et al. 2018). Plasma is compressed and accelerated outward by the CME front, yielding observable Doppler shifts,∆Ur, of up to 100 km s−1or so. Such shifts would be detectable with a
sensitive large area grating spectrometer.
These studies demonstrate the acute need for observations of stellar CMEs. Extrapolations of so-lar CME-fso-lare relationships (Fig. 8) are uncertain by orders of magnitude and appear to overestimate large stellar CME candidate kinetic energies. High-resolution spectroscopy at X-ray wavelengths could routinely and definitivelyobserve the tell-tale Doppler shifts of CMEs or their coronal com-pression waves (Fig. 8) and identify their physical properties, including their thermal structure, masses and energies, as recently discovered by Chandra/HETGS (Argiroffi et al. 2019). A
combi-nation of high throughput and high spectral resolution is critical for mapping out CME frequency and energy vs optical and X-ray flare diagnostics for exoplanet hosts directly, and generally as a function of spectral type and activity level.
4.2.3 Transmission spectroscopy of exoplanet atmospheres
X-rays are powerful diagnostics of planetary upper atmospheric gas density structure and chemical composition. The transit of the hot Jupiter HD189733b was detected through X-ray absorption by oxygen in Chandra observations by Poppenhaeger et al. (2013), who found the scale height of X-ray
absorbing gas was higher than suggested by optical and UV transits. Hot Jupiters and similar giant close-in planets are important for improving theory and models describing atmospheric loss.
X-ray absorption measures gas bulk chemical composition along the line-of-sight — in this case in the transiting exoplanet atmosphere backlit by the host star’s corona. Such measurements are unique to the X-ray range, but only the very closest hot Jupiters are accessible with Chandra and XMM-Newton, and then only at low signal-to-noise ratio. A much more sensitive, high spectral res-olution observatory will be able to observe HD189733b-like transits out to much greater distances, and by co-adding transits will be able to probe the atmospheres of the nearest terrestrial planets. Absorption edge resonance structure (not resolvable with Athena) will distinguish between atomic and molecular or ionised gas, and provide velocity diagnostics for atmospheric outflow. X-rays in combination with optical/IR data will provide a powerful probe for clouds and hazes that can confuse IR spectroscopic analyses(Sing et al. 2016).
5
Supernova remnants
Nearby supernova remnants (SNRs), the outcome of SN explosions, are extended sources which al-low to study the structure and chemical composition of the ejecta produced by the explosion. These characteristics reflect somehow the nature of the progenitor star and pristine features of the parent SNe that may originate from anisotropies developed at the initiation of the explosion. Observations of SNRs, therefore, encode valuable information about the progenitor star and the SN dynamics.
Studies of SNRs may give exceptional hints on the nature of the shocks between the ejecta and the surrounding medium. Examples of this are the investigation of the broadening of emission lines in ejecta-rich knots, the study of the oxygen rich ejecta-knot of SN 1006 performed by Broersen et al. (2013) using XMM-Newton RGS data, and the more comprehensive study of Miceli et al. (2019) on the ion-proton temperature ratio using Chandra gratings data of SN 1987A.
The studies carried out so far and the already developed state-of-the-art MHD models demon-strate the need of a technological breakthrough to increase the spectral resolution of X-ray instru-mentation in order to achieve a better comprehension of a crucial step in the life cycle of elements in the Universe.
To clarify and quantify the required resolution, we have chosen a test case based on real ob-servations of the bright oxygen-rich ejecta knot of the SN 1006, on which an extensive analysis of grating X-ray data has been performed, namely XMM-Newton RGS data Broersen et al. (2013), with the aim to characterise the high resolution spectra and measure the abundances (and there-fore the masses) of different elements present in the knot. Bright X-ray knots are ideal laboratories to study how the pristine explosion asymmetries evolve into late-stage SNR morphologies, so the chosen test case is very relevant for the kind of studies HiReX will be able to perform.
A 10 ks HiReX observation of the knot in SN 1006 would allow us to gain great insight inthe chemical composition of the knot(uncertainties < 0.05 in abundances),the electron and ion tem-peratures of the host rich plasma, and the turbulence and bulk flow of the knotwith uncertainties on the latter of only 7 km s−1.
6
Compact Objects
Outflows are a key ingredient of accretion processes onto compact objects of all masses. In X-ray binaries (XRBs), narrow absorption lines and P-Cygni profiles with velocities of a few hundreds of km s−1have been observed almost ubiquitously in high inclination sources, revealing the presence of equatorial winds in these systems. The winds are photoionised and estimates of the expelled mass indicate that it could be large enough to trigger accretion state changes or even be the reason for
an outburst to cease (Shields et al. 1986; Ponti et al. 2012; Mu˜noz-Darias et al. 2016). A range of ionisations is observed whenever sensitive observations are available, indicating some stratification in the wind (e.g., Ueda et al. 2004; Miller et al. 2006; Kallman et al. 2009). In particular, a low ionisation component of the wind is present in the majority of XRBs that are not absorbed below ∼2 keV in the interstellar medium (see Table 1 in D´ıaz Trigo & Boirin 2016).
Resolving the line profiles provides us with a powerful diagnostic for characterising the winds in XRBs (Ueda et al. 2004; Kaastra et al. 2014). Line profiles are extensively used at UV, optical, IR or mm wavelengths where resolving powers well above 3000 are available. For example, Calvet et al. (1993) used them to identify an accelerating wind in pre-main sequence objects as originating from the accretion disc. In addition, the region between 0.2–2 keV contains diagnostic lines for plasma density like Fe xvii and Fe xxii (Mauche et al. 2004), a crucial parameter to determine the distance between the plasma and the ionising source, which is key to discern among different wind launching mechanisms. Moreover, the wealth of lines in this energy band is also fundamental to diagnose if a plasma is collisionally ionised or photoionised, and thus to differentiate between absorption in the interstellar medium or local to the source.
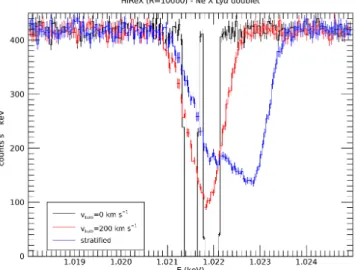
Figure 9: Ne x line profiles expected for a a thermal wind with no significant turbulence (black), a thermal wind with a turbulence of 200 km s−1 (red) and a stratified wind with a velocity profile between 0 and 300 km s−1(blue) and no
turbulence. At a resolution lower than ∼0.2 eV, the line profiles in black and red will be indistinguishable due to the blend of the line doublet. However, with the resolving power of HiReX , we will be able to resolve the velocity profile of the wind (blue) allowing us to make detail comparisons with the expectations for thermal, radiative or magnetic winds and to distinguish between a profile with or without turbulence. All diagnostics shown will critically depend on the capability to recognise a saturated line (see text), which otherwise would introduce an unknown systematic uncertainty in the resolution and interpretation of the line profiles.
HiReX will allow a study of the low ionisation wind components at unprecedented resolution in X-rays. For the first time we will be ableto resolve the line forest between 14–18 Å, determine turbulent and thermal broadening of the lines and measure radial velocities even in the smallest systems. Only resolving powers of ∼5000 or better, as provided by HiReX below 2 keV, will al-low us to disentangle line saturation from turbulent and thermal broadening or a blend of the two components of a H-like ion doublet (see Fig. ??). This and the large amount of lines present in the 0.2–2 keV region will allow us to choose non-saturated lines to map the accretion disc atmo-spheres and winds with exquisite detail. The line spectra from atmoatmo-spheres (dominated by lines from He-like and H-like elements from C to Fe, radiative recombination lines and Fe L lines) are
very sensitive to temperature, ionisation and emission measure of each atmospheric layer, prob-ing the heatprob-ing mechanisms in the disc (Jimenez-Garate et al. 2002). For winds, thermal pressure (Begelman et al. 1983; Begelman & McKee 1983), aided by radiation pressure for systems with luminosities above 50% Eddington, is currently favoured as the main launching mechanism, but the topic of whether there is room for a magnetic wind or not is highly debated (e.g. Done et al. 2018; Fukumura et al. 2018; Waters & Proga 2018). The high resolution line profiles obtained with HiReX will allow us to disentangle between these mechanisms since the wind velocity/acceleration profile is expected to be different for thermal, radiative and magnetic pressure winds (Ueda et al. 2004; Fukumura et al. 2010). In this sense,HiReX will be complementary to Athena by expanding the studies of the highest ionisation component of winds to the lower ionisation ones, but adding fundamental diagnostic parameters such as density.
While Athena will provide a resolving power close to 3000 at 7 keV, sufficient to resolve line profiles for the most ionised component of the plasma revealed by the presence of Fe xxv and Fe xxvi lines, at energies below 2 keV, only HiReX provides the resolving power needed to make the same studies for the lower ionisation components of the wind. Note that the Ne x doublet is only separated by ∼0.5 eV, compared to ∼20 eV for the Fe xxvi doublet (Verner et al. 1996). The recently reported presence of optical winds during the accretion state where jets are observed (e.g., Rahoui et al. 2014; Mu˜noz-Darias et al. 2016) signals the presence of relatively cool material that could be associated to the soft X-ray wind component. Since the high ionisation wind component is absent in such an accretion state and only appears at states dominated by strong thermal emission, the mechanisms behind the X-ray low and high ionisation components could be different. HiReX will allow usto fully characterise the low ionisation component of winds and test if the launching mechanism is the same as for the high ionisation winds. Finally, the line profiles will also allow us to determine the mass loss rate in the wind by constraining the solid angle of the wind through the ratio of emission to absorption.
7
A possible mission concept
Resolving the thermal Doppler width (FWHM) of a transition in an ionic species of atomic mass Min a plasma of temperature T requires a resolving power R= 9700(M/56)1/2(T /106K)−1/2. We choose R= 10 000 as our reference value. At this value, we resolve the lines of Fe ions, the heaviest abundant element, in essentially all X-ray plasmas. Given sufficient photon flux, such resolving power will also enable the measurement of bulk velocities down to a few km s−1.
To maintain an approximately constant resolving power across an extended X-ray energy band, diffractive spectrometers offer the best combination of flexibility and ease of practical implemen-tation. The resolving power of a diffraction grating spectrometer scales approximately inversely proportional to photon energy, that of a microcalorimeter-based spectrometer approximately pro-portional to photon energy. But a diffraction grating spectrometer can be operated in a series of different spectral orders, essentially as an ’echelle’ spectrograph, which allows for a more uniform resolving power coverage of the chosen band. We explore a simple design based on laboratory-proven technology.
Two types of diffraction grating are currently being developed for high-resolution astrophysical X-ray spectroscopy: the Critical Angle Transmission grating (Heilmann et al. 2019), and the ’off-plane’ radial groove gratings (McEntaffer 2019). Very roughly speaking, the first type combines low tolerance alignment implementation with a relatively meticulous manufacturing process, while the second type is faster to manufacture but requires precise optical alignment. Both types offer a natural combination of high dispersion and high diffraction efficiency. We detail a possible design based on CAT gratings.
We choose 100–2000 eV as the baseline energy range. The energy range 500–1000 eV (12–23 Å) is especially rich in astrophysically important transitions (the O K-shell and Fe L shell species), and we blaze the spectrometer at 15 Å. For a grating period d = 2000 Å, the angle of incidence on Si grating bars should not exceed 2 degrees, and the spectrometer operates in spectral orders m ≈ 9 around the blaze wavelength (Heilmann et al. 2019). Order separation can be ensured by reading out the spectroscopic image with a semiconductor imaging detector with an energy resolving power of order 10 or better, such as delivered by a Fano-limited Si device. Assuming a focusing optic with angular resolution ≤ 1 arcsec, and ignoring spherical aberration and the effect of grating imperfections, results in a spectroscopic resolving power at blaze of 14 400. Spectral orders 1–12 provide a resolving power over 10 000 at all wavelengths longer than about 8 Å.
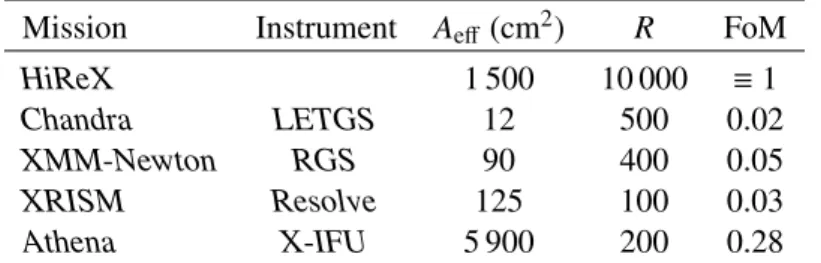
If we assume that systematic effects (uncalibrated pixel-to-pixel quantum efficiency variations) in the focal plane detector are the ultimate limit to the minimum detectable line equivalent width, then, for an assumed 3% systematic error, the minimum detectable equivalent width is 3% of the instrument resolution, or EWlimit= 3 × 10⁻²(λ/10 000)= 3 × 10⁻⁶λ Å= 0.06(λ/20Å) mÅ.
Table 1: Figure of Merit (FoM) for measuring equivalent widths of weak lines at 0.5 keV energy for various high-resolution X-ray spectrometers. The expected detection significance scales with FoM ∼ √AeffRwith Aeff the effective
area and R the resolution of the instrument.
Mission Instrument Aeff (cm2) R FoM
HiReX 1 500 10 000 ≡ 1
Chandra LETGS 12 500 0.02
XMM-Newton RGS 90 400 0.05
XRISM Resolve 125 100 0.03
Athena X-IFU 5 900 200 0.28
Table 1 compares the figure of merit (expected significance) of weak line detections for various instruments. In this respect HiReX is 20–50 times better than the present grating spectrometers. While Athena/X-IFU can compensate the lower spectral resolution by more effective area in terms of statistical significance of line detections, the ultimate limit for weak lines is determined by the systematic uncertainties outlined above. Assuming a typical 3% systematic uncertainty for all these instruments, the ultimate performance is then determined solely by the resolving power R. In this respect, for detection of weak lines, HiReX is better than all other instruments by a factor of 20–50.
8
Acknowledgements
Team members thank the following people for supporting this effort and contributing to the discus-sion and development of the paper: M. Audard (Un. of Geneva), M. Barbera (INAF), D. Barret (CNRS - IRAP, France), G. Betancourt-Martinez (IRAP), V. Biffi (INAF/SAO), E. Branchini (Un. Roma Tre), E. Costantini (SRON), J.R. Crespo (MPI-Heidelberg), K. Dolag (MPA), A. Finoguenov (Un. of Helsinki), V. Grinberg (Un. of Tuebingen), J.W. den Herder (SRON), I. Khabibullin (MPA & IKI), A. Maggio (INAF), Y. Naz´e (University of Li`ege), S. Paltani (Un. of Geneva), L. Piro (INAF), G. Ponti (MPE), E. Rasia (INAF), G. Rauw (University of Li`ege), F. Reale (INAF), A. Simionescu (SRON), J. Wilms (R. Obs. Bamberg).
References
Airapetian, V. S., Glocer, A., Gronoff, G., H´ebrard, E., & Danchi, W. 2016, Nature Geoscience, 9, 452
Airapetian, V. S., Glocer, A., Khazanov, G. V., et al. 2017, ApJ, 836, L3
Alvarado-G´omez, J. D., Drake, J. J., Cohen, O., Moschou, S. P., & Garraffo, C. 2018, ApJ, 862, 93 Argiroffi, C., Drake, J. J., Bonito, R., et al. 2017, A&A, 607, A14
Argiroffi, C., Reale, F., Drake, J. J., et al. 2019, Nature Astronomy, 328
Barcons, X., Barret, D., Decourchelle, A., et al. 2017, Astronomische Nachrichten, 338, 153 Barret, D. & Cappi, M. 2019, A&A, in press, arXiv:1906.02734
Begelman, M. C. & McKee, C. F. 1983, ApJ, 271, 89
Begelman, M. C., McKee, C. F., & Shields, G. A. 1983, ApJ, 271, 70 Biffi, V., Mernier, F., & Medvedev, P. 2018a, Space Sci. Rev., 214, 123 Biffi, V., Planelles, S., Borgani, S., et al. 2018b, MNRAS, 476, 2689
Blustin, A. J., Page, M. J., Fuerst, S. V., Brand uardi-Raymont, G., & Ashton, C. E. 2005, A&A, 431, 111
Bonamente, M., Nevalainen, J., Tilton, E., et al. 2016, MNRAS, 457, 4236
Brain, D. A., Bagenal, F., Ma, Y.-J., Nilsson, H., & Stenberg Wieser, G. 2016, Journal of Geophys-ical Research (Planets), 121, 2364
Bregman, J. N., Alves, G. C., Miller, M. J., & Hodges-Kluck, E. 2015, Journal of Astronomical Telescopes, Instruments, and Systems, 1, 045003
Bregman, J. N., Anderson, M. E., Miller, M. J., et al. 2018, ApJ, 862, 3 Broersen, S., Vink, J., Miceli, M., et al. 2013, A&A, 552, A9
Calvet, N., Hartmann, L., & Kenyon, S. J. 1993, ApJ, 402, 623 Cen, R. & Fang, T. 2006, ApJ, 650, 573
Cen, R. & Ostriker, J. P. 2006, ApJ, 650, 560
Churazov, E., Haehnelt, M., Kotov, O., & Sunyaev, R. 2001, MNRAS, 323, 93 Crain, R. A., Schaye, J., Bower, R. G., et al. 2015, MNRAS, 450, 1937
Cucchetti, E., Pointecouteau, E., Peille, P., et al. 2018, A&A, 620, A173 Danehkar, A., Nowak, M. A., Lee, J. C., et al. 2018, ApJ, 853, 165 de Vries, C. P. & Costantini, E. 2009, A&A, 497, 393