de
l
'
Document de travail
Q
UANTITATIVE
M
ETHODS AND
E
CONOMIC
H
ISTORY
N°
2010-15
JUILLET
2010
Guillaume DAUDIN
OFCE - Centre de recherche en économie de Sciences Po
69, quai d’Orsay - 75340 Paris Cedex 07 Tél/ 01 44 18 54 00 - Fax/ 01 45 56 06 15
Quantitative Methods and Economic History
Guillaume Daudin
Abstract:
This paper makes the point that quantitative methods should be part of the toolkit of all economic historians. In the first part I will show that quantitative methods have been obviously important in the rise of economic history as a field up the 1980s. In a second part, I will illustrate through examples that quantitative methods coming from various social sciences can provide use new ways of thinking about economic history issues. In the last part, I will show that while there are legitimate reasons to be worried about the limitations of quantitative methods, they can still be a very useful and fruitful way of doing economic history in a pluralistic scientific environment.
Keywords : Economic History, quantitative methods JEL classification codes : NO1
Résumé
Cet article défend l’idée que les méthodes quantitatives doivent faire partie de la boîte à outil de tous les historiens économistes. Dans la première partie, je montre que les méthodes quantitative ont eu une grande importance dans la montée de l’histoire économique en tant que champ scientifique jusqu’aux années 1980. Dans la deuxième partie, j’illustre à partir de quelques exemples comment des méthodes quantitatives issues de sciences sociales variées peuvent nous fournir de nouvelles manières de réfléchir sur les problèmes d’histoire économique. Dans la dernière partie, je souligne que, s’il y a en effet des raisons légitimes d’être inquiet des limites des méthodes quantitatives, elles forment de toutes les manières une manière utile et fructueuse de faire de l’histoire économique dans un environnement scientifique pluraliste.
Mots Clés : Histoire économique, Méthodes quantitatives Classification JEL : NO1
1
[…] when you cannot measure it, when you cannot express it in numbers, your knowledge is of a meagre and unsatifactory kind […]
“Kelvin’s Dictum”2
“and even when we can measure it, our knowledge will be meager and unsatisfactory”
Jacob Viner3 I thank the organizers of the XLII study week of the Instituto Internazionale di Storia Economica “F. Datini” to have given me the occasion to organize my thoughs on the relations between economic history and the “mathematical-statistical sciences”. To be frank, I am not quite sure what is meant by “mathematical-statistical sciences”. I suppose it is not synonymous with “cliometrics” as these include economic theory. I will assume it means all quantitative methods. This paper will complement the paper written by Mark Thomas for the same occasion: we initially presented our thoughts together.
I was taught as a statistician before I started dabbling in economic history, so my point of view is quite different from most participants. In particular, I have an spontaneous curiosity about quantitative methods. Still, I will make the point in that communication that quantitative methods should be part of the toolkit of economic historians spontaneously interested in more consequential matters. In a first part I will show that quantitative methods have been obviously important in the rise of economic history as a field up the 1980s. In a second part, I will illustrate through examples that quantitative methods can still provide use new ways of thinking about economic history issues. In the last part, I will show that while there are legitimate reasons to be worried about the limitations of quantitative methods, they can still be a very useful and fruitful way of doing economic history in a pluralistic scientific environment.
1. TEXTUAL ANALYSIS
Thanks to easily available article databases such as JSTOR, it is much easier now to track the quantitative evolutions of economic history. For the question at hand, if there were an unambiguous way to find economic history articles among all historical articles and articles using quantitative methods among all economic history articles, we could easily track the usage of quantitative methods in history in general and in economic history in particular.
Alas, there are difficulties. First, not all journals are in JSTOR. JSTOR includes only 91 history discipline journals. Its includes many of the main journals of the field in history in general (American Historical Review, Past & Present, Comparative Studies in Society and
History, Journal of Interdisciplinary History) or in Economic History (Journal of Economic History and Economic History Review). Still, the list of journals given by the American
Historical Association includes more than 400 English-language titles: JSTOR provides only a sample. In economic history, journals as important as Explorations in Economic History and the Annales are missing. Non-English language journals are under-represented: the history discipline journals include only one multi-language journal (Historia: Zeitschrift für Alte
Geschichte) and two French-language journals (Mouvement Social and Vingtième Siècle).
That makes any bibliometric study partial. Furthermore, JSTOR in itself is a tool to find
2
Sir William THOMSON, Popular addresses, edition of 1888-1889. 3
See R.K.MERTON,D.L.SILLS,S.M.STIGLER, The Kelvin Dictum and Social Science: An Excursion into
specific papers rather than a tool for bibliometric exercises. However, Jstor has a companion bilbliographic tool named “Data for Research” (http://dfr.jstor.org). It informs us, for example that there were 123,057 articles published in history discipline journals between 1951 and 2008, and that 13,435 included the expression “economic history”.
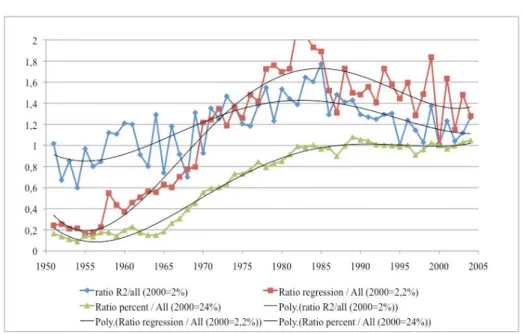
A much more important difficulty is how to identify quantitative methods. Quantification can have different goals. In the second part, I distinguish between three more and more ambitious goals: counting things (what I am trying to do in this part: e.g. simply checking the number of articles using such or such word), exploring the data (using descriptive statistics to determine time trends – I try a bit of that) and establishing links (modelling hypothesis and testing them). I use markers that are linked with both the least ambitious quantification (the word “percent”) and the most ambitious (the words “R2” and “regression” which both refer to canonical econometric techniques). This is obviously unsatisfactory, as there are many ways of doing brillant quantification without using “R2” and “regression” obviously, but maybe even without using “percent”. However, the results of numerous searches concord enough to offer some indications on what has been happening to the use of quantitative methods since the 1950s. All the following figures give indication on the ratio between the number of articles for different searches normalized to the ratio for 2000 in all history discipline journals.
The last criterion is the least stringent, as 24% of all papers in history did include it in 2000. The first criterion is interesting, but gives a number of false positive, especially at the beginning of the period, because of numerous OCR mistakes. Fig. 1 shows that mathematics and statistics, identified in this way, were on the rise from the 1960s to the 1980s. The most stringent criteria suggest that they then declined, even if the reality of this decline is not very precisely measured.
Fig. 1. The use of quantitative methods in history
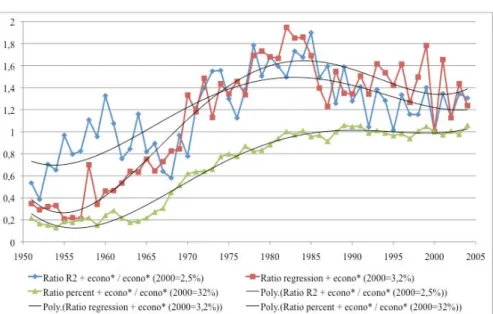
Fig. 2 and
Fig. 3 show the same information restricted to economic history. Both show that there was something special about the period from the 1960s to the 1980s: the use of quantitative methods increased quickly then. The reason for its subsequent decline is less clear. The lax criterion to mark economic history (whether a word starting with “econo” was included in an article) shows a subsequent decline for “R2” and “regressions”. The stringent criterion (whether the expression “economic history” was included in an article) only shows stabilization.
Fig. 2. The use of quantitative methods in economic history (lax criterion)
Fig. 3. The use of quantitative methods in economic history (stringent criterion)
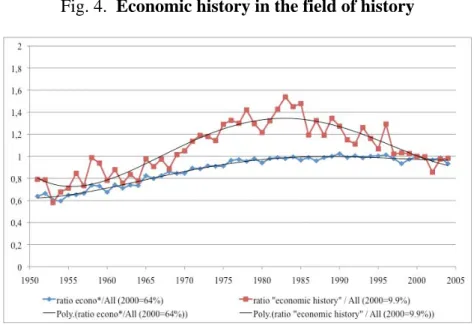
Finally, Fig. 4 measures the importance of economic history in history. The picture is mixed. The most lax criterion shows a rise of economic history up to the mid-1980s and a stabilization after that. The most stringent criterion suggests that this rise was followed by a relative decline down to now.
Fig. 4. Economic history in the field of history
The period from the 1960s to the 1980s can obviously be associated with the cliometrics revolution. During this time, both the usage quantitative methods and the importance of economic history were on the rise in history. The cliometrics revolution did bring a measurable change in the way economic historians treat quantitative evidence. These changes have not been a fad, even if these methods did not conquer the whole of economic history. The rest of the story is more mixed. Adopting a stringent definition of economic history suggests that economic history got into a relative decline in the field as large – a view certainly shared by many – while quantitative methods were always as important to it. Adopting a lax definition of economic history suggests that more articles mentioned economic matters, but that they did it less and less with the help of quantitative methods.
One way or the other, the correlation of the rise of the use of quantitative methods on the one hand and the importance of economic history in the field in the other hand is striking. Our field certainly benefited from these new methods. This dynamism had run its course in the 1980s. Considering the data, and perhaps pushing the interpretation too far, we might say that afterwards economic history as a strict field declined, while the share of papers alluding to economic subjects stabilized. The field itself was and is still as reliant on quantitative methods as it had become by 1980 while the discipline of history as large, even in articles treating economic factors, has become less so.
2. LESS TRAVELLED PATHS IN QUANTITATIVE METHODS
This relative decline of economic history in the field of history, along with the relative decline of the use of quantitative tools in history in general, might call for the exploration of new quantitative methods by economic historians. This part will discuss some of the available methods. The methods from econometrics are presented in Mark Thomas’s paper. Here, I will look at the quantitative methods from other social sciences. There are two reasons for this choice of focus.
First, I suppose we all aspire at being foxes rather than hedgehogs. Would you rather know and use a lot of methods rather than completely master a single one? I know which life would be the more boring. Furthermore, even though hedgehogs are very good at convincing
people that they are right, because of their coherence and single-mindedness, it seems that they are not so good at being actually right.4
Second, economic history has always been more eclectic that applied economics. As a consequence, many have remarked that there is a long lag before the most advanced econometrics are diffused. In itself, this is not a good thing.5 Yet, it seems to be what works. To quote Broadberry: “It is not the most revolutionary high-tech version of Cliometrics that has triumphed, but rather the most basic quantitative historical approach research incorporating simple ideas from economics.”6
For these two reasons, I believe it might be fruitful to increase the “extensive margin” of our knowledge of quantitative methods rather than the “intensive margin”.7 I will present these methods from the less ambitious (simply counting) to the more ambitious (testing relationships).
2.1. Counting new things
Numerous objects of economic history are already quantitative: prices, wages, production… and can easily be counted. But why limit oneself to counting what is already under this format, when quantitative analysis can help explore other types of data?
Literature, political science and sociology have for a long time used quantification to analyse texts by counting words, or, when possible, word roots. This allows to track the evolution of political discourse, showing for example that French Communist Party was not obsessed with national issues in the 1930s.8 Closest the economic history, the analysis of the vocabulary of eight Carolingian polyptychs helps understand the rural economy of the period. All use words related to obligatory labour. The latest one (Prüm) seems to insist more on measures of capacity as a way to count obligatory labour, and is more precise in the description of the type of labor than the oldest one (Saint-Germain).9
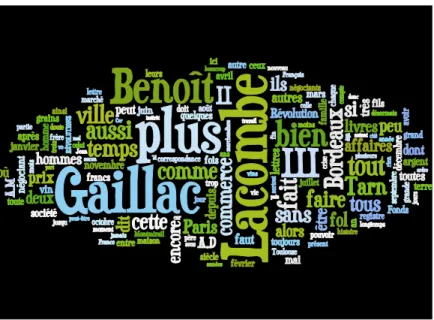
I have not found many example of the use of lexicometry in economic history. Yet, it is easy to imagine how it could be used. Annual reports and board meeting minutes could be analysed to better understand the motivation of business actors. Political discourse could be analysed to track the evolving beliefs in the importance of the intervention of the State in the economy. Early Modern business letters could be analysed to preoccupations of their merchants. For a very simple example of the latest use, here are word clouds referring to the correspondence of two late eighteenth century French merchants, one in Nice and the other one in Gaillac10. At their cores, these world clouds are only another way of presenting an histogram of the frequency of each word in a texte. The difference between the two graphs
4
P.E. TETLOCK, Expert Political Judgment: How Good Is It? How Can We Know?, Princeton 2005
(Princeton University Press). 5
N.F.R. CRAFTS, Economics and History, in Companion to Contemporary Economic Thought, I.S.
GREENAWAY,M.BLEANEY (eds.), Routledge 1991, pp. 812-829.
6
S. BROADBERRY, Review of Reflections on the Cliometric Revolution: Conversations with Economic
Historians, ed. J.S.LYON,L.P.CAIN,S.H.WILLIAMSON. London 2008 (Routledge) (2008)."History of Economic
Ideas”, 17, 2009, 1, pp. 237-238. Quoted in J.S.LYONS, Theory and Fact in the Practice of Economic History,
EHS 2010 Meetings Durham. 7
Part of the following description is inspired from C.LERMERCIER,C.ZALC, Méthodes quantitatives pour
l'historien, Paris 2008 (La Découverte).
8
D.MAYAFFRE, History and Information Technology: the French Are Way Behind, in “Lexicometrica”, 3,
2001. 9
S.GUÉRAULT, Le vocabulaire économique et technique des polyptyques, in “Histoire et Mesure”, XVIII,
2003, 3/4, pp. 313-333. 10
M.-L.CARLIN, Un Commerce de détail à Nice, sous la Révolution : la maison Colombo, Aix-en-Provence
1965 (La Pensée Universitaire). and J.CORNETTE, Un Révolutionnaire ordinaire : B. Lacoube, négociant
may come from the choice of extracts by both historians, and the fact that the Lacombe word cloud includes words from the commentary around the original letters. They do not tell us much directly, though maybe they suggest ways in which the text should be analysed using more advanced lexicometric tools (using, for example, proximity) that have been developped for a long time.11
Fig. 5. “Wordle” around Colombo
Fig. 6. “Wordle” around Benoît Lacombe
Another potential source of quantitative data comes from bibliographical analysis, or any kind of longitudinal data. Already, linking individuals in the 19th century American census
11
C. LEMERCIER, C. ZALC, “Lexicométrie: une bibliographie complémentaire” http://
has provided very interesting insights on migrations. Similar research has been conducted based on veteran records in the United States collected by the Center for Population Economics in Chicago.12 This allows to focus on individual trajectories rather than the evolution of groups which constituting individuals might be changing. There might be a link there with the interests of the Italian school of micro history.
One can imagine also studying smaller groups and using the data from prosopography studies. This method is very common in sociology. It has also been used, for example, in the history of technology. Allen has used this method to analyse the characteristics of inventors during the Industrial Revolution.13
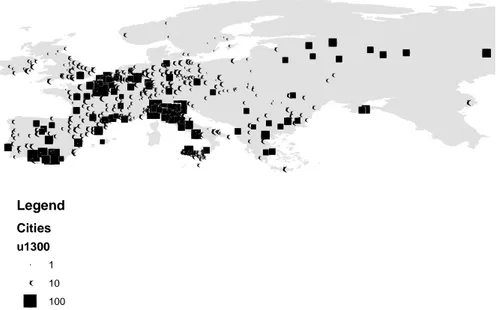
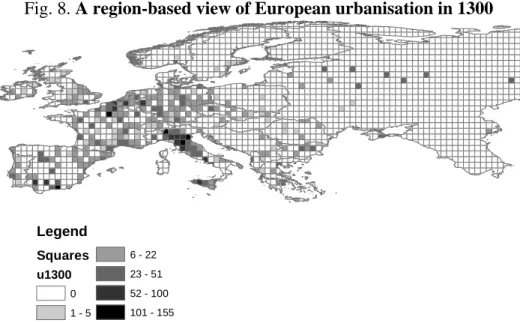
Another way of counting new things is to use the tools of Geographical Information Systems. Beside the fact that map are great communication tools, and hence important in convincing an audience of the quality of ideas, they allow to transform the data geographically. For example, we can have different view of European urbanization, which can be used in different ways, if we study it based on individual cities or based on 70 km squares.14 This method is equivalent to the common archeological method creating a regular grid (carroyage).
Fig. 7. A city-based view of European urbanization in 1300
( ! ( ! ( ! ( ! ( ! ( ! ( ! ( ! ( ! ( ! ( ! ( ! ( ! ( ! ( ! ( ! ( ! ( ! ( ! ( ! ( ! ( ! ( ! ( ! ( ! ( ! ( ! ( ! ( ! ( ! ( ! ( ! ( ! ( !( ! ( ! ( ! ( ! ( ! ( ! ( ! ( ! ( ! ( ! ( ! ( ! ( ! ( ! ( ! ( ! ( ! ( ! ( ! ( ! ( ! ( ! ( ! ( ! ( ! ( ! ( ! ( ! ( ! ( ! ( ! ( ! ( ! ( ! ( ! ( ! ( ! ( ! ( ! ( ! ( ! ( ! ( ! ( !( ! ( ! ( ! ( ! ( ! ( ! ( ! ( ! ( ! ( ! ( ! ( ! ( ! ( ! ( ! ( ! ( ! ( ! ( ! ( ! ( ! ( ! ( !( ! ( ! ( ! ( ! ( ! ( ! ( ! ( ! ( ! ( ! ( ! ( ! ( ! ( ! ( !( ! ( ! ( ! ( ! ( ! ( ! ( !( ! ( ! ( ! ( ! ( ! ( ! ( ! ( ! ( ! ( ! ( ! ( !( ! ( ! ( ! ( ! ( ! ( ! ( ! ( ! ( ! ( ! ( ! ( ! ( ! ( ! ( ! ( ! ( ! ( ! ( ! ( ! ( ! ( ! ( ! ( ! ( ! ( ! ( ! ( ! ( ! ( ! ( ! ( ! ( ! ( ! ( ! ( ! ( ! ( ! ( ! ( ! ( ! ( ! ( ! ( ! ( ! ( !( ! ( ! ( ! ( ! ( ! ( ! ( ! ( ! ( ! ( ! ( ! ( ! ( ! ( !( ! ( ! ( ! ( ! ( ! ( ! ( ! ( ! ( ! ( ! ( ! ( ! ( !( ! ( ! ( ! ( ! ( ! ( ! ( ! ( ! ( ! ( ! ( ! ( ! ( ! ( ! ( ! ( ! ( ! ( ! ( ! ( ! ( ! (!(!( ! ( ! ( ! ( ! ( ! ( ! ( ! ( ! ( ! ( ! ( ! ( ! ( ! ( ! ( ! ( ! ( ! ( ! ( ! ( ! ( ! ( ! ( !( ! ( ! ( ! ( ! ( ! ( ! ( ! ( ! ( ! ( ! ( ! ( ! ( ! (!(!( ! (!( ! ( ! ( ! ( ! ( ! ( ! ( ! ( ! ( ! ( ! ( ! ( ! ( ! ( ! ( ! ( ! ( ! ( ! ( ! ( ! ( ! ( ! ( ! ( ! ( ! ( ! ( ! ( ! ( ! ( ! ( ! ( ! (!( !( ! ( ! ( ! ( ! ( ! ( ! ( ! ( ! ( ! ( ! ( ! ( ! ( ! ( ! ( ! ( ! ( ! ( ! ( ! ( ! ( ! ( ! ( ! ( ! ( ! ( ! ( ! ( ! ( ! ( ! ( ! ( ! ( ! ( ! ( ! ( ! ( ! ( ! ( ! ( ! ( ! ( ! ( ! ( ! ( ! ( ! ( ! ( ! ( ! ( ! ( ! ( ! ( ! ( ! ( ! ( ! ( ! ( ! ( ! ( ! ( ! (!( ! ( ! ( ! ( ! ( ! ( ! ( ! ( ! ( ! ( ! ( ! ( ! ( ! ( ! ( ! ( ! ( !( ! ( ! ( ! ( ! ( ! ( ! ( ! ( ! ( ! ( ! ( ! ( ! ( ! ( ! ( ! ( Legend Cities u1300 ! ( 1 ! ( 10 100 12
For an example, see L.P.CAIN,S.CH.HONG, Survival in 19th Century Cities: The Larger the City, the Smaller Your Chances, in “Explorations in Economic History”, 46, 2009, pp. 450-463.
13
R.C. ALLEN, The British Industrial Revolution in Global Perspective, Cambridge 2009 (Cambridge
University Press), chpt. 11. 14
The data come from P. BAIROCH, J. BATOU, and P. CHÈVRE. 1988. La Population des villes européennes : Banque de
données et analyse sommaire des résultats 800-1850 / The Population of European Cities: Data Bank and Short Summary of Results. Genève 1988 (Libraire Droz).
Fig. 8. A region-based view of European urbanisation in 1300 Legend Squares u1300 0 1 - 5 6 - 22 23 - 51 52 - 100 101 - 155
2.2. Exploring the data
Econometrics is about testing the existence of relationships between variables in the data. What a number of fields call “data analysis”, or “data mining” (without the negative connotation usually attached to the expression in economics) is about letting the data tell you what kind of relationships exist a priori. It is about finding ways of exploring and presenting the data that produce meaning by themselves. It is about how to transform data into information. It is dangerously close to the pitfalls of un-theoretical observation.
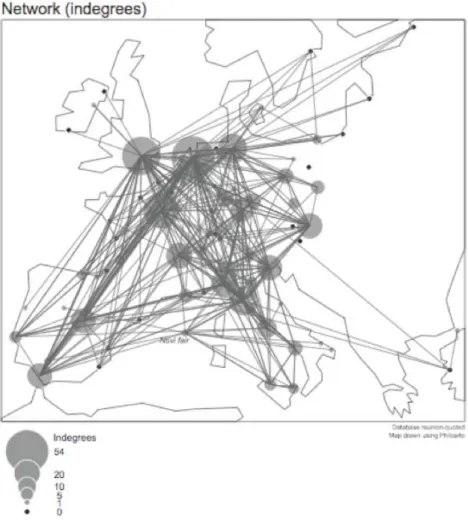
To some extent, network analysis does not suffer too much from this problems. The measured proximities are quite intuitive, and the ratio between the amount of data and the expected information is not too high. It has been used often in economic history, for example to analyse the evolving centres of foreign exchange relations between the 18th century and the 20th century.15 In the case of the map shown, the centrality of each centre can be computed with the number of places they are quoted in. Amsterdam is quoted in 84% of cities, more often than London or Paris.
15
M.FLANDREAU,CH.GALIMARD,C.JOBST,M.DEL PILAR NOGUÉS MARCO, Monetary Geography Before
Fig. 9: Monetary agglomeration in the mid-18th century
Network analysis has also been used to study business networks, e.g. to compare 19th century Brazilian and Mexican networks.16 It has also been used to understand the evolutions of the international trade network.17
The pitfall of observation without theory are much more important in the large family of multivariate analysis: discrimination analysis, hierarchical analysis, cluster analysis, factorial analysis, reciprocal averaging, optimal matching analysis… All these methods try to spot patterns in the data and to identify groups among the variables or the observations. Their problem is that they do not test relations by themselves. They simply try to spot interesting ones. The relations they find are very dependant on the exact method used. For example, I have long tried to identify patterns in French regional markets based on the data from the
Maximum.18 I had a number of variables for small geographic units in 1794 France giving me
information on whether they were buying various categories of goods from various other places. Because I had 14 goods categories and because there were approximately 550 districts, each of my 88 observations was associated with 7 700 variables (taking the value one if they were buying and 0 if they were not), or only 550 variables when I was looking at trade for a
16
A.MUSACCHIO,I.READ, Bankers, Industrialists, and Their Cliques: Elite Networks in Mexico and Brazil
during Early Industrialization, in “Enterprise and Society”, 8, 2007, 4, pp. 842-880.
17
D.A. SMITH, D.R. WHITE, Structure and Dynamics of the Global Economy: Network Analysis of
International Trade 1965-1980, in “Social Forces”, 70, 1992, 4, pp. 857-893.
18
G. DAUDIN, Domestic Trade and Market Size in Late Eighteenth-Century France, in “Journal of
specific goods category. I was trying to identify regional markets, or to create “cluster” of observations looking like one another. To do that, I had to make a number of more or less arbitrary decisions:
- How was I to measure distance between two observations? Between clustered observations?
- What method was I to choose to create the partitions for a given number of cluster? Hierarchical or partition? Deterministic or probabilistic?
- Once the “optimal” clusters were determined for each level of partition, which method was I to choose to determine which level of partition was the best one (i.e. how many groups there should be)? How was it going to differ from goods to goods?
- Once I had determined the optimal number of cluster and the optimal partitions in each case, how was I going to compare partitions?
There are many possible answers to each of these questions. Except through a very data-intensive exploration of all the possible answers, it is easy to see that the robustness of the results can easily by cast in doubt. In the end, the possibilities seemed so difficult to discriminate between one another that I decided to go in another direction, and ground my analysis on run-of-the-mill gravity equations with out-of-sample predictions. This was only possible when I had determined what was the exact question I wanted to ask the data. Not simply “what were regional markets in late eighteenth-century France?”, but rather “were French markets larger or smaller than Britain?”.19 Quantification without a good question is fraught with danger!
Similar arguments have already been made against these methods.20 So, despite the fact that they are to some extent part of the exception française, I believe they can only be used cautiously and as a first step for the analysis.
2.3. Establishing relationships
In fine, most social historians want to establish the existence of relationships between
variables. Regressions, under all their different forms, are very efficient ways of doing that. However, because regressions are based on probabilities, they can only be used when the dataset is large enough. Yet, even when it is small, it is possible to establish relationships between variables. Simply, it cannot be done with the use of probabilities. Qualitative Comparative Analysis uses Boolean algebra (familiar to those of us exposed to “New Math” during their childhood) to systematize the logic of qualitative approaches to more than an handful of cases.21 To some extent, it is a way to reconcile narratives and hypothesis testing. In the simplest sense, it is a way to collect in a systematic way the necessary conditions and the sufficient conditions for some social phenomenon to happen, for example peasant revolts.
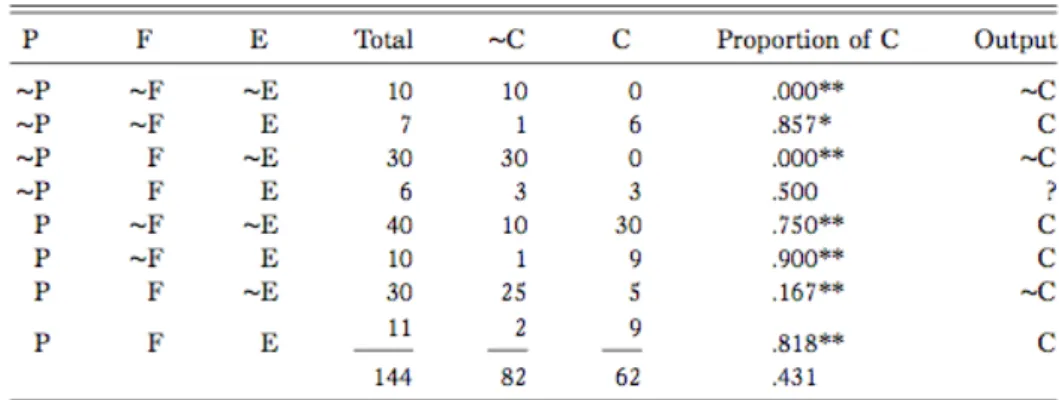
I am personally not very familiar with this method, but I would like to illustrate it with an example. The question is about why do men convert to Evangelical Christianity in Venezuela.22 The dataset is not large: only 75 cases. The information used in the following table is whether there was conversion or not, whether the men were living with their own
19
For many goods, and especially the ones important for the Industrial Revolution, they were larger. 20
H.LE BRAS, L'analyse multivariée est-elle une méthode générale de recherche ?, in “Histoire et Mesure”, 12, 1997, pp. 3-4, 321-335.
21
C.C.RAGIN, The Comparative Method: Moving beyond Qualitative and Quantitative Strategies, Berkeley
1987 (Univ of California Press). 22
D. SMILDE, A Qualitative Comparative Analysis of Conversion to Venezuelan Evangelicalism: How
Networks Matter, in “The American Journal of Sociology”, 111, 2005, 3, pp. 757-796. Another example, more
germane to our interests, but more difficult to present simply, can be found in: A.HICKS,J.MISRA,TANG NAH
NG, The Programmatic Emergence of the Social Security State, in “American Sociological Review”, 60, 1995, 3,
family, whether they have been living with an evangelical and whether they have been experiencing life problems. This yields a “Truth table” (were ~ means “not”).
Table 1. Truth table of combinations of life problems, living with family of origin, and
living with an evangelical
This “Truth table” can be reduced to a number of logical propositions, disregarding the ambiguous row ~PFE:
“Combination 1: P FE and P FE can be reduced to FE. “Combination 2: P F E and P FE can be reduced to P F. “Combination 3: P FE and PFE can be reduced to PE. “C = FE + P F + PE.
“Put substantively, conversion (C) results from spells in which men (1) do not “live with family of origin and live with an evangelical ( FE) or (2) are experiencing “life problems and do not live with family of origin (P F) or (3) are experiencing “life problems and live with an evangelical (PE). Preliminary analysis, then, shows “that the experience of life problems is part of the story, but is neither sufficient “nor necessary “for conversion. Rather, two variables fill out the picture by “pointing toward a “respondent’s network position.”23
Obviously, this suggests “logit regression” to the adept of econometrics. It seems to have some advantages over it, though. First, it does not depend so much on the quality of the sample, as it only deals with Yes/No propositions: there is no need for precise measures of causality there. Furthermore, it allows to explore the issue of interactive variables in a more natural way than the computation of marginal effects.
Finally, remember that my claim here is not that this or that method is a mandatory step on the staircase of truth, but rather that it can be usefully used to explore the questions we want explored. In that respect, if a method fails to convince for various reasons, a very close one can still be useful. Probabilities and Boolean logic are two different of way of thinking about reality: each one may convince different people.
This method comes from political sociology. Demographics and labour sociology have spent a lot of time developing methods to formalize the link between variables regarding the life of an individual. This is called the event history analysis. It uses survival analysis like the
23
Cox hazard model. It is linked to the use of the longitudinal data on the life of individual, e.g. the work on veterans from the Civil war.24
Another development, from educational sociology, might be interesting for economic historian: the “multilevel analysis”. This extension of regressions takes into account the different levels at which the variable may be defined and the fact that each level may have a particular influence on the individual and on the effect of variables. In the sociology of education, these levels might be pupil, class, school and school district. I have not found any example of the use of these methods in economic history, even if they are closely linked to panel methods.
3. WHY ARE QUANTITATIVE METHODS USEFUL?
In presenting new methods for economic history, I have assumed in the second part of the paper that for economic history to become more important in the field of history, it should do better of the same. It benefited tremendously of the influx of new quantitative methods in the 1960s to 1980s: it should look for new ways of using them for the future. An alternative view would be that quantitative methods in general have turned from boon to curse. They have had their uses, but their limitations have become more and more obvious and we should discard them from the econmic historian’s toolbox. I do not think this is the case and will explain why here.
3.1. Quantitative methods with and without cliometrics
The first part has shows the strong correlation between the rise of statistical methods and the rise of cliometrics from 1960 to 1980. The history of the cliometrics has been told numerous times.25 Let us simply remind to the reader some of its first stages: the first joint session of Economic History Association and the NBER Conference on Income and Wealth in 1957, the publication of The Economics of Slavery in the Antebellum South in 1958,26 the first annual conference in 1960, the memorable session at the American Economic Association in 1964 and the publication of Railroads and American Economic Growth in the same year…27 Cliometrics then took over the economic history jobs in economic departments and the pages in prestigious journals.28
The cliometrics revolution included a new emphasis on the statistical treatment of quantitative data. However, this was much less “revolutionary” than its new emphasis on using the insights from economic theory, and specifically neo-classical price theory. In the words of McCloskey, “The raison d'être of cliometrics is avoiding the absurdities of economic
24
L.P.CAIN,S.CH.HONG, Survival in 19th Century Cities, cit.
25
One of the latest ones is J.S. LYONS, L.P. CAIN, S.H. WILLIAMSON, Reflections on the Cliometrics
Revolution : Conversations with Economic Historians, Abingdon 2008 (Routledge). For a textbook presentation,
see J.W. DRUKKER, The Revolution that Bits Its Own Tail. How Economic History Changed Our Ideas on
Economic Growth, Amsterdam 2006 (Aksant).
26
Conrad and Meyer (A.H.CONRAD,J.R.MEYER, The Economics of Slavery in the Ante Bellum South, in
“The Journal of Political Economy”, 66, 1958, 2, pp. 95-130.. 27
R.W.FOGEL, Railroads and American Economic Growth: Essays in Econometric History, Baltimore 1964
(Johns Hopkins Press). 28
R.WHAPLES, A Quantitative History of the Journal of Economic History and the Cliometric Revolution, in
“The Journal of Economic History”, 51, 1991, 2, pp. 289-301; IDEM, The Supply and Demand of Economic
History: Recent Trends in the Journal of Economic History, in “The Journal of Economic History”, 62, 2002, 2,
history without economics”.29 It is only latter that cliometrics has started using more sophisticated quantification alongside with a more eclectic use of economic theory.30
As such, most of the cliometrics revolution would not concern us here, but should be treated along with the relation between economic theory and economic history. A caveat to that welcome restriction of our field of study is that theories are not the only export of economics into economic history. Economics also exported empirical methods, even if they were not central to the cliometrics revolution. Most quantitative methods used nowadays in economic history are direct application of the methods devised by economists to answer their own questions that are aptly named “econometrics”.31
Quantitative economic history is much older than cliometrics. In France, Simiand was for example in the early 20th century an ardent proponent of the use of statistics in social sciences: “La forme statistique [est] le seul moyen d’atteindre les phénomènes collectifs, qui sont la
condition des phénomènes individuels”.32 In the English-speaking world, Kelvin’s dictum is
well known (see supra). For economic history specifically, Clapham’s statement is also well known: “Every economic historian should, however, have acquired what might be called the statistical sense, the habit of asking in relation to any institution, policy, group or movement the question: how large? how long? how representative?”33
In part because of the influence of Simiand, statistics were awarded a very important role in the Annales school that, to French historians certainly, appears as the main innovation of the inter-war period in the field of history. Annales historians were fascinated with numbers, particularly time series. They have produced impressive works of histoire sérielle, especially about the French early modern period. However, they had difficulties with the interpretation of these numerous time series, probably because they did not have at hand a coherent theoretical way of thinking about the world comparable to what was latter introduced by the cliometrics revolution. The Malthusian model was very important, some Marxist ideas were used – especially in the early works –, but on the whole the theoretical reflection was seen as quite secondary to the gathering of facts.34 However, the rejection of neo-classical economic paradigm (and its homo œconomicus) was very clear, as the exposition of the cliometrics revolution by Chaunu shows.35
Yet, it is barely worth mentioning that theory and understanding cannot simply be expected to spring out of facts. Many models are possible to explain similar facts. Some of these models are not internally consistent. Some others are in contradiction with regularities observed elsewhere. Simply looking at time series will only allow simplistic trend spotting or journalistic comments. At its worse, these comments assume that the market has a life of its own, behaving sometimes like an optimist and sometimes like a pessimist. Keynes’s sentence might apply to researchers interested only in facts: “Practical men, who believe themselves to be quite exempt from any intellectual influence, are usually the slaves of some defunct
29
D.N.MCCLOSKEY, The Achievements of the Cliometric School, in “The Journal of Economic History”, 38, 1978, 1, pp. 13-28. For an vivid illustration of the method, see D.NORTH, The State of Economic History, in “The American Economic Review”, 55, 1965, 1/2, pp. 86-91, 89-90.
30
N.F.R.CRAFTS, Cliometrics, 1971-1986: A Survey, in “Journal of Applied Econometrics”, 2, 1987, 3, pp. 171-192.
31
This is not to say, by the way, that quantification is not a matter of debate in economics as well as in history (see for example the issues of accounting, welfare and happiness economics, etc.).
32
F.SIMIAND, La méthode positive en science économique, Paris 1912 (F. Alcan). See J.BOUVIER, François
Simiand, la statistique et les sciences humaines, in Pour une histoire de la statistique. Paris 1977 (INSEE).
33
J.H. CLAPHAM, Economic History as a Discipline, in Encyclopaedia of the Social Sciences, E.R.A.
SELIGMAN,A.JOHNSON (eds.), London 1931 (Macmillan), p. 328.
34
J.W.DRUKKER, The Revolution, cit., pp. 65-70. 35
P.CHAUNU, L’économie : Dépassements et prospectives, in Faire de l’histoire, J.LE GOFF,P. NORA
economist”.36 There cannot be a pure empirical approach to economic history, nor to any branch of social sciences.
3.2. Criticizing numbers in history
Chaunu’s criticisms of the cliometrics revolution included not only that it was grounded too much in neo-classical economic theory, but also that it was trying the apply a national accounting framework that only made sense from the 19th century onwards. No interesting questions, pertaining for example to the longue durée, could be answered by the use of such tools.37 This is, despite the importance of Pierre Chaunu for histoire sérielle, a version of an argument that condemns quantification in itself because of the period or field in which it is applied to.
Let us call that the the first strand of criticism against quantification. To some extent, this argument is puzzling. How can anyone interested in economic history hold the view that quantification is not useful? Many aspects of economic life are naturally quantifiable: production, consumption, prices… Yet, all would agree that the historical record is imperfect. As a result, some historians believe that quantification requires more from the historical record than it can provide. The value of the sources determines the limits of usable knowledge. This criticism can be found as early as in Seignobos38. Parker has complained about the fact that “the statistical method […] imposes a severe strain on the accuracy and completeness of an imperfect historical record”.39
One might think that the solution to the unreliability of the data is simply to get more and better data. The archives have certainly not been scourged for all their content. Even when they have been, as in the case of Ancient history, archaeology promises new databases that could be fruitfully exploited. And simply thinking about the potential of archaeology for the medieval and the more recent periods should make anyone confident that our quantitative knowledge will still improve.
Yet, the consequences of this first strand criticism should not be underestimated. Even if we might be able to answer most “objective” questions with more and better data, it is not certain that would be the best use of our academic resources. Economics teaches us about tradeoffs. The resources used to pursue a line of research according to a particular methodology are not available for other methodologies. Furthemore, even though for current issues, it is often possible to use ressources to provide measures compatible with new concepts, it is possible that the past will never yield the data needed for our question. In that case, the quantitative historian might be a hammer looking for a nail even if there are none to be found.
A second strand of criticism is that, even if the numbers available were reliable, some interesting questions are not quantifiable. Seignobos, again, criticise the idea that comparing the print run of different books might give an idea of their intellectual influence. His point is not really that that we would rather like to know how often the book was read, or how
36
J.M.KEYNES, The General Theory of Employment, Interest and Money, London 1936 (Macmillan and
Co., ltd.), book 6, chpt. 24. 37
P.CHAUNU, L’économie, cit.
38
CH.SEIGNOBOS, La méthode historique appliquée aux sciences sociales, Paris 1902 (Alcan), p. 210. For
this discussion, see . BOUVIER, François Simiand, cit., and M. REBÉRIOUX, Le débat de 1903: historiens et
sociologues, in Au berceau des Annales, C.-O.CARBONELL,G.LIVET (eds.), Toulouse 1983 (Presses de l'IEP), pp. 219-230.
39
W.N.PARKER, Introduction, in Trends in the American Economy in the Nineteenth Century (Conference
on Research in Income and Wealth), Princeton 1960 (Princeton University Press for the NBER) (Quoted by
important were the people reading it. It is that the reasons why one book has been important and not another are non-quantifiable because they are subjective and psychological.40
This criticism could be taken as simply a condamnation of bad quantification. Obviously, a print run could be a very imperfect measure of readership. More fundamentally, a text can be important even if it has never been distributed (like an administrative memo that helped to take a momentous decision) or even never really written (like the Protocol of the Wise Men of
Zion)… The notion of “importance” should be discussed and clarified before any
quantification is started. But maybe it will lead to renuncing to quantification.
This second strand of criticism recurrs in every wave of criticism of quantitative history. It can also be found in the recent rise of cultural history that has made history departments in the United States and other places so hostile to economic history, or even to objectivist empiricist social history. “By the mid-1970s a significant minority of American “new social historians,” […] had grown increasingly frustrated by the limits of quantitative history. Although our methodology enabled us to understand more and more about the structural constraints and social forces that shaped people’s lives, the offered no guidance for understanding how people actually made sense and grappled with these forces and constraints.”41 The renewed interest for these questions led to a situation where “At the University of Chicago, at least, most history graduate students would count it an insult to their intelligence and dignity if their professors so much as intimated that they might construct data bases, plot out graphs, and analyse statistical distributions”.42
Even though I am a heavy user of quantification, I believe that both criticisms are valid. The second one is more damning than the first one, though I am puzzled as to why it would lead to a wholesale rejection of quantification. This might be a reaction to the perceived “modernist” tendency of quantification users, who sometime behave as if they believed that numbers are the only sure pathway to truth.
3.3. Quantitative methods as one of the rhetorical tools
Is quantitative economic history the best use possible of economic historians’ resources? The answer to that question is not obvious. An important reason to believe that the answer might be “no” is the way part of the thinking about one of the main issues in economic history – economic growth – has evolved. According to North and Nye, much of the success of the Cliometrics revolution has been negative: “debunking bad arguments and eliminating outrageous claims”.43 They argue that, to answer the real questions, taking into account among other the role of institutions, politics and incentives, economic historians should move back to a method anchored in narration which they call “Analytical Narrative”. This method harks back to economic history before the Cliometrics revolution. Its recourse to formal model is limited in so far as it recognizes that social dynamics will never be satisfactorily modelled. It does not have to be mathematical or heavy in number crunching as these are not very useful when the main aim of the narrative is to understand the foundation of human decision making in situations of uncertainty along with its relation with institutions and
40
CH.SEIGNOBOS, La méthode historique, cit., p. 134.
41
W.H.SEWELL, Whatever Happened to the 'Social' in Social History?, in School of Thought: Twenty-Five
Years Of Interpretive Social Science, J.W. SCOTT, D. KEATES (eds.), Princeton 2001 (Princeton University Press), pp. 209-226, p. 211-212.
42
Ibid., p. 209. 43
D.C.NORTH, J.V.C.NYE, Cliometrics, the New Institutional Economics, and the Future of Economic
History, in Economic History Association Conference, Abstracts in the “Journal of Economic History” -
culture. Again, the interest for psychology is an important part of this criticism of quantitative methods.
This proposal is closely linked to the research program of the New Institutional Economics. E.g. Greif certainly uses formal model making, but he does not make much use of numbers.44 Some numbers can certainly be found in the founding example of analytical narratives by Bates, Greif, Levi Rosenthal and Weingast, but the core of their ambition is to extract generalizations from case studies.45 There are ways of doing good economic history that are not centred on quantitative methods. Looking at the typical articles in the Economic
History Review would be an easy way to be convinced of the same thing. Other areas of
economics seem to be interested in their own adapted version of analytical narratives.46 In a parallel way to the appeal of McCloskey to recognize that modelling is only one of the accepted rhetorical tools of economics, we should recognize that quantification is only one of the rhetorical tools of economic history.47 It is a very important tool, as it allows easy comparison and hence easy conversation. It facilitates division of labour between researchers. Quantitative arguments are easier to make and to falsify than argument based on qualitative knowledge of the sources. They allow to pass judgment based on explicit facts, that require less erudition than alternative methods.48 Still, economic history should recognize that numbers do not convey all the possible interesting characteristics of an object. As such, quantification is simply a metaphor, selecting the traits of the object that are of interest for the current research. As we often hear in seminars from our historian colleagues, it leaves quite an awful number of things out. The real question is whether these things are important or not to the question at hand. Taking a leaf from McCloskey’s article again, this is illustrated by a quotation discussing purely literary matters: “acceptance of an analogy […] is often equivalent to a judgment as to the importance of the characteristics that the analogy brings to the fore”.49
Thus, even if the opposition to quantification seems simply Luddite at first glance, it is very defensible. In retrospect, the argument seems even trite and trivial. Depending on the question of interest, quantification can be either useful or not. There should be no a priori judgment on the value of an argumentation simply on the ground of its use or not of mathematics. Now, of course, the real issue is to discover when and how it should be employed. This is mainly a problem of judgment, and certainly not of fixed rules.
44
A.GREIF, Institutions and the Path to the Modern Economy: Lessons from Medieval Trade, Cambridge
2006 (Cambridge University Press). 45
R.H.BATES,A.GREIF,M.LEVI,J.-L.ROSENTHAL,B.R.WEINGAST, Analystic Narratives, Princeton, NJ 1998 (Princenton University Press).
46
In Search of Properity: Analytical Narratives on Economic Growth, ed. D. RODRIK, Princeton 2003
(Princeton University Press). 47
D.N.MCCLOSKEY, The Rhetoric of Economics, in “Journal of Economic Literature”, 21, 1983, 2, pp. 481-517. In that usage, rhetoric means “the art of discovering warrantable beliefs and improving those beliefs in
shared discourse”. W.C. BOOTH, Modern Dogma and the Rhetoric of Assent, Chicago 1974 (University of
Chicago Press), quoted in Ibidem. 48
P.-C.HAUTCŒUR, Entre Micro et Macro, quelle place pour le quantitatif en histoire économique ?, in
“Historiens et Géographes”, 378, pp. 137-144. 49
C. PERELMAN, L. OBRECHTS-TYTECA, The New Rhetoric: A Treatise on Argumentation (translation),
Notre Dame 1967 (1958) (Notre Dame University Press), again quoted in D.N.MCCLOSKEY, The Rhetoric of
CONCLUSION
This paper has started with some textual analysis. Quantitative methods have been very important in the rise of economic history as a subfield of history from the 1960s to the 1980s. After that, economic history has declined relatively while quantitative methods seemed to be less and less popular in history in general. In a second part, I have illustrated that new, fruitful quantitative methods, coming from other social sciences than economics exist and could be used. In a third part, I have argued that, despite legitimate criticisms, quantification can and should be a very important tools for economic historians.
Quantification has produced useful results. It allows easier conversation and debate. It is one of the ways to knowledge and understanding. Obviously, it is not a panacea. It cannot help for some legitimate historical questions. It has been abused to explore to dead ends. It has lead to scholastic debates on barren research questions. Some historians who believe this has been the case more often than I do might be tempted to do the prudent thing when confronted with someone who pretends to be Napoleon: under no circumstance should you start discussing cavalry tactics at Austerlitz.50 Yet, if historians doubtful about the use of quantitative methods do not engage with them to show their limitations, who will? We exclude ourselves and others from scientific conversation for the greater peril of the field. I would rather take an irenical position. Let us ask interesting questions, be flexible with our tools, and inclusive in our debates.
50
That was why Solow did not want to engage more seriously with neoclassical economists. See his