HAL Id: hal-03226644
https://hal.archives-ouvertes.fr/hal-03226644
Submitted on 15 May 2021
HAL is a multi-disciplinary open access archive for the deposit and dissemination of sci-entific research documents, whether they are pub-lished or not. The documents may come from teaching and research institutions in France or abroad, or from public or private research centers.
L’archive ouverte pluridisciplinaire HAL, est destinée au dépôt et à la diffusion de documents scientifiques de niveau recherche, publiés ou non, émanant des établissements d’enseignement et de recherche français ou étrangers, des laboratoires publics ou privés.
Drivers of i-DNA Formation in a Variety of
Environments Revealed by Four-Dimensional UV
Melting and Annealing
Mingpan Cheng, Jielin Chen, Huangxian Ju, Jun Zhou, Jean-Louis Mergny
To cite this version:
Mingpan Cheng, Jielin Chen, Huangxian Ju, Jun Zhou, Jean-Louis Mergny. Drivers of i-DNA Forma-tion in a Variety of Environments Revealed by Four-Dimensional UV Melting and Annealing. Journal of the American Chemical Society, American Chemical Society, 2021, �10.1021/jacs.1c02209�. �hal-03226644�
Drivers of i-DNA formation in a variety of environments revealed by
four-dimensional UV melting and annealing
Mingpan Cheng†,‡,*, Jielin Chen†, Huangxian Ju†, Jun Zhou†,*, and Jean-Louis Mergny†,‡,§,*
†
State Key Laboratory of Analytical Chemistry for Life Science, School of Chemistry & Chemical Engineering, Nanjing University, Nanjing 210023, China.
‡ , , INSERM U1212, CNRS UMR5320, IECB, Pessac 33607,
France.
§
’Op q c c , Ec l P l ch q , C S, I SE M, I P l ch q Paris, 91128 Palaiseau cedex, France.
ABSTRACT
i-DNA is a four-stranded, pH-sensitive structure formed by cytosine-rich DNA sequences. Previous reports have addressed the conditions for formation of this motif in DNA in vitro and validated its existence in human cells. Unfortunately, these in vitro studies have often been performed under different experimental conditions, making comparisons difficult. To overcome this, we developed a four-dimensional UV melting and annealing (4DUVMA) approach to analyze i-DNA formation under a variety of conditions (e.g., pH, temperature, salt, crowding). Analysis of 25 sequences provided a global understanding of i-DNA formation under disparate conditions, which should ultimately allow the design of accurate prediction tools. For example, we found reliable linear correlations between the mid-point of pH transition and temperature (-0.04 ± 0.003 pH unit per 1.0 °C temperature increment) and between the melting temperature and pH (-23.8 ± 1.1 °C per pH unit increment). In addition, by analyzing the hysteresis between denaturing and renaturing profiles in both pH and thermal transitions, we found that loop length, nature of the C-tracts, pH, temperature, and crowding agents all play roles in i-DNA folding kinetics. Interestingly, our data indicate which conformer is more favorable for the sequences with an odd number of cytosine base pairs. Then the h m l pH l f “ ” -DNAs from human promoter genes were measured under near physiological conditions (pH 7.0, 37 °C). The 4DUVMA method can become a universal resource to analysis the properties of any i-DNA-prone sequence.
INTRODUCTION
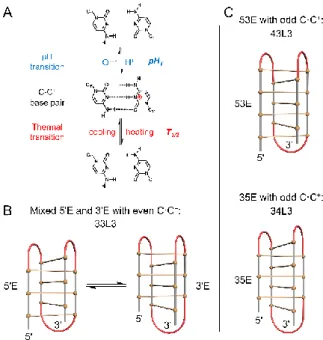
DNA is prone to structural polymorphism: in addition to the canonical Watson-Crick double-helix, a number of alternative structures are known. Among these oddities is the four-stranded, C-rich i-DNA structure 1-2, which forms under mildly acidic conditions that stabilize hemi-protonated C·C+ base pairs (Figure 1A) 3-4. In the i-DNA structure, two interlocked parallel-stranded duplexes consisting of C·C+ base pairs are held together in a head-to-tail orientation. A typical intramolecular i-DNA involves four contiguous cytosine tracts and three loops (Figure 1B) 5-8. As cytosine protonation at the N3 position is essential for formation of the hemi-protonated base pairs, stability and unfolding/folding rates of i-DNA depend on pH 9-20. i-DNA stability is often modest under physiological conditions 11, 13, 21, but some i-DNA structures have been shown to remain folded at neutral pH 11, 13-16, 20-26. In-cell NMR 20, 27 and experiments with an i-DNA-specific antibody 28 recently demonstrated that i-DNAs are present in human cells.
Figure 1 i-DNA formation. (A) Equilibrium between unpaired bases and C·C+ base pair, which are probed by determination of mid-points of pH-induced and thermal transitions, pHT and T1/2, respectively. (B) Mixed 5'E and 3'E
conformers formed by the sequences with even numbers of C·C+ base pairs. Loop regions are in red. (C) 53E (upper) and 35E (lower) conformers formed by the sequences with odd numbers of C·C+ base pairs. Sequences of 33L3, 43L3, and 34L3 are listed in Table 1.
In contrast to G-quadruplexes formed by G-rich sequences, i-DNA strand orientations are fixed. Adjacent strands are always antiparallel to each other, and diagonally opposed strands run in the same direction. As a consequence, i-DNA structures are less polymorphic than G-quadruplexes. Nevertheless, some variability is observed in i-DNA structures: For sequences with an even number of C·C+ base pairs, two conformers, called 5'E and 3'E, are possible, as the two external solvent accessible C·C+ base pairs may be located at either the 5' or the 3' ends of both duplexes, respectively (Figure 1B) 7-8, 29-34. For sequences with an odd number of C·C+ base pairs, one duplex has more base pairs than the other and both 5' and 3' terminal base pairs are oriented to maximize stacking interactions 12, 19, 35-37. Two different arrangements are observed depending on primary sequence (Figure 1C): In the 53E arrangement (not to be confused with 5'E), the (n+1) C-tracts are the first and third runs of cytosines. In the 35E conformer, the (n+1) C-tracts at the second and fourth positions. For example, sequences 43L3 [d(C4T3C3T3C4T3C3)] and 34L3
i-DNA stability depends on the number of C·C+ base pairs, and structures with longer central loops are more stable than those with shorter loops 11, 13, 20, 24. In addition to pH and temperature, cation type and concentration influence both stability and conformation: Na+, K+, Li+, NH4+, and Cu2+
destabilize i-DNA 5, 38-40, whereas Ag+ and Cu+ stabilize this structure 41-44. Moreover, i-DNA has been reported to be stabilized by macromolecular crowding conditions 45-50.
Mid-points of acid-alkaline (pH) and thermal transitions, referred to here as pHT and T1/2,
respectively, are often used to determine the stability of i-DNAs (Figure 1A). However, comparing results is often difficult as pHT is often determined at a given temperature, and thermal stability is
only measured at a few pH values 5, 11, 13-16, 20. These limited measurements do not provide a reliable global picture of pHT dependency on temperature or of thermal stability on pH and do not allow the
determination of the folded fraction under a range of conditions. To illustrate the need for standardization, in two recent papers 11, 13, the melting temperature of i-DNA formed by the same sequence, d(C4T3C4T3C4T3C4), was found to be 71.7 °C and 56.4 °C; the values were measured at
pH 5.0 with 37 mM K+ and pH 5.5 with 110 mM Na+, respectively. The pHT values also differed:
Values were 6.95 and 7.1, measured at 23 °C and 20 °C, respectively.
In order to overcome these limitations, we developed a systematic four-dimensional analysis of UV melting and annealing (4DUVMA). The 4DUVMA approach measures the UV absorbance spectra (220-330 nm wavelength range) over the pH range between 5.0 and 8.0 at temperature range between 5 to 90 °C. In contrast with recent studies in which we analyzed over 200 sequences in a limited set of conditions 20, 24, here we evaluated a smaller panel of 20 sequences with 6 to 12 C·C+ base pairs (Table 1) in far more conditions. Formation diagrams were constructed for each i-DNA in which the fraction folded was determined under all pH and temperature combinations. This analysis allowed us to establish clear correlations between pHT and temperature and between T1/2 and pH.
Furthermore, we found that conformer 53E is more stable than 35E for all sequences with an odd C·C+ base pair number. We then applied the 4DUVMA method to five sequences with the potential to form DNA found in human promoter regions. Finally, the effect of molecular crowding on i-DNA stability and hysteresis was investigated.
RESULTS
Here we systematically analyzed 20 model sequences (Table 1) using 4DUVMA. The C-tracts of these sequences range in length from three to six, allowing the formation of up to 12 C·C+ base pairs, thus avoiding complex biphasic melting profiles observed for longer sequences 11, 13. The total number of nucleotides involved in loops, defined as loop size, is either three or nine nucleotides. Sequences are named based on the lengths of C-tracts and individual loops.
Table 1 Twenty model sequences used in this work.
Name Sequence (5'→3') C·C+ no. a loop size b nt c Conformation d Molecularity e
33L1 CCCTCCCTCCCTCCC 6 3 15 mix dm 33L3 CCCTTTCCCTTTCCCTTTCCC 6 9 21 mix m 34L1 CCCTCCCCTCCCTCCCC 7 3 17 35E dm 34L3 CCCTTTCCCCTTTCCCTTTCCCC 7 9 23 35E m 43L1 CCCCTCCCTCCCCTCCC 7 3 17 53E m(d) 43L3 CCCCTTTCCCTTTCCCCTTTCCC 7 9 23 53E m 44L1 CCCCTCCCCTCCCCTCCCC 8 3 19 mix m(d) 44L3 CCCCTTTCCCCTTTCCCCTTTCCCC 8 9 25 mix m 45L1 CCCCTCCCCCTCCCCTCCCCC 9 3 21 35E m 45L3 CCCCTTTCCCCCTTTCCCCTTTCCCCC 9 9 27 35E m 54L1 CCCCCTCCCCTCCCCCTCCCC 9 3 21 53E m 54L3 CCCCCTTTCCCCTTTCCCCCTTTCCCC 9 9 27 53E m 55L1 CCCCCTCCCCCTCCCCCTCCCCC 10 3 23 mix m 55L3 CCCCCTTTCCCCCTTTCCCCCTTTCCCCC 10 9 29 mix m 56L1 CCCCCTCCCCCCTCCCCCTCCCCCC 11 3 25 35E m 56L3 CCCCCTTTCCCCCCTTTCCCCCTTTCCCCCC 11 9 31 35E m 65L1 CCCCCCTCCCCCTCCCCCCTCCCCC 11 3 25 53E m 65L3 CCCCCCTTTCCCCCTTTCCCCCCTTTCCCCC 11 9 31 53E m 66L1 CCCCCCTCCCCCCTCCCCCCTCCCCCC 12 3 27 mix m 66L3 CCCCCCTTTCCCCCCTTTCCCCCCTTTCCCCCC 12 9 33 mix m a
Maximum theoretical number of C·C+ base pairs formed assuming intramolecular folding and no cytosines involved in loop formation. b Total number of nucleotides in the three loops assuming no cytosines are involved in loop formation. c Oligonucleotide
total length in nucleotides. d Conformation: ‘mix’ refers to a mixture of 3'E and 5'E conformers, see text and Figure 1 for details. e Molecularity was determined by SE-HP C pH 6.0; ‘ m’ c m f m (m j ) m m (m ), ‘m( )’ indicates a monomer with traces of a dime , ‘m’ f p l m m c p c .
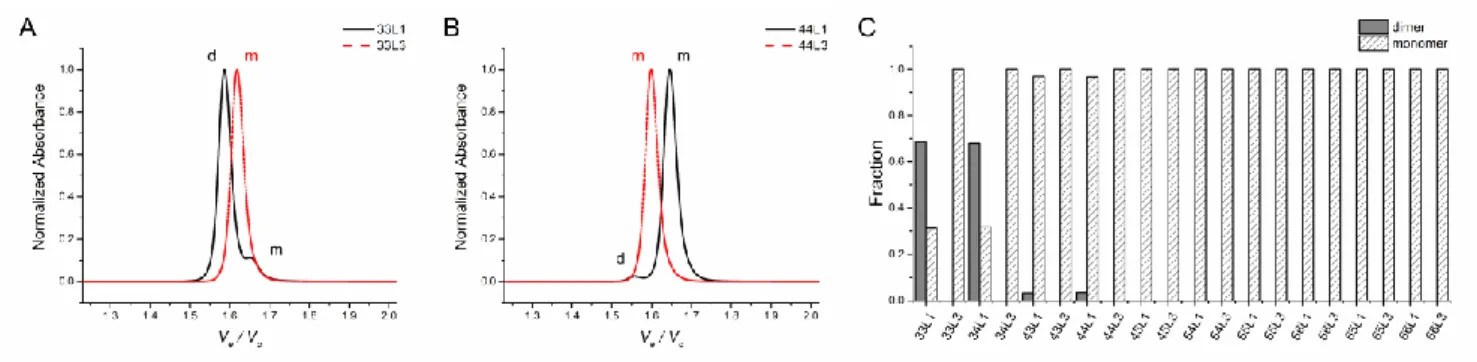
Figure 2 Molecularity of the folded species deduced from SE-HPLC analysis at pH 6.0. Normalized chromatograms of
(A) 33L1 and 33L3 and (B) 44L1 and 44L3. Peaks corresponding to monomer and dimer species are m k w h ‘m’ ‘ ’, p c l . (C) Fraction of monomeric and dimeric species for each i-DNA oligonucleotide analyzed.
Size-exclusion high performance liquid chromatography (SE-HPLC) is a powerful tool to discriminate aggregation states of quadruplex DNAs 51-52. We used SE-HPLC to evaluate monomer to dimer ratios of the i-DNAs. Chromatography profiles of sequences at pH 6.0 are provided in Figures 2A-B and Figure S1. The so-called structure index 51 can be used to discriminate the
molecularity of i-DNAs; the monomer and dimer species have structure indexes around 5.8 and 6.2, respectively. The fractions of monomeric and dimeric species in each i-DNA were determined (Figure 2C and Table 1). 33L1 and 34L1 mainly fold into intermolecular i-DNAs (~68% dimer for both). 43L1 and 44L1 mainly fold into intramolecular structures (~97% monomeric for both). All other sequences exclusively (>99%) adopt an intramolecular fold.
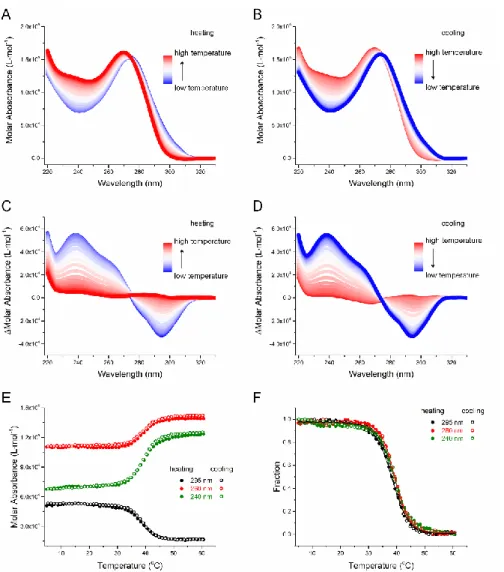
4DUVMA experiments were then performed for each sequence. To illustrate the procedure, the temperature dependent UV spectra at pH 6.0 of 44L1 are shown in Figures 3A-B. The temperature-dependent thermal difference spectra (TDS) 24 were obtained by subtracting the UV spectrum of fully unfolded species at the highest temperature (90 °C) from the spectra of fully or partially folded species at a lower temperature, between 5 and 90 °C (Figures 3C-D). The TDS positive peak around 240 nm and negative peak around 295 nm indicate the formation of i-DNA 53. Upon heating, the intensities of both peaks decrease, as a result of i-DNA dissociation; upon cooling, the intensities increase as i-DNA refolds. To verify the robustness of our analysis, we determined the folded fractions and the temperatures at which half of the molecules are folded (T1/2) at different
wavelengths (e.g., 295, 260, 240 nm). Figure 3F indicates that these profiles are nearly superimposable. We chose the absorbance at 295 nm to process the data as changes at this wavelength are proportionally higher than at other wavelengths.
Figure 3 UV absorbance analysis of the denaturation and refolding of 44L1 at pH 6.0. Temperature dependence of the
UV absorbance during (A) melting and (B) annealing in the 220-330 nm wavelength range. TDS monitored during (C) melting and (D) annealing. (E) Molar absorbance and (F) fraction folded monitored at 240, 260, and 295 nm during melting and annealing.
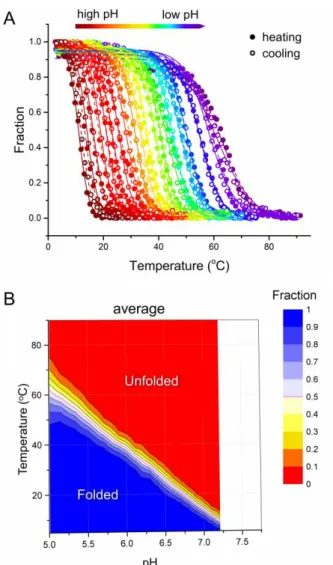
Denaturation and renaturation profiles for each model oligonucleotide were determined at 26 different pH values ranging from 5.0 to 8.0. These plots for the heating and cooling processes are shown for 44L1 in Figure 4A. As expected, stability clearly increased when pH decreased. We then determined the fraction folded at each temperature for each melting profile at a given pH, allowing us to draw the formation diagram for 44L1, shown in Figure 4B. Data for all other oligonucleotides are presented in Figure S2. From the formation diagrams, we extracted pH-dependent T1/2 values
and temperature-dependent pHT values during both heating and cooling processes.
Figure 4 pH and temperature dependency of i-DNA formation for the 44L1 sequence. (A) Fraction folded as a function
of temperature deduced from UV melting and annealing profiles at different pHs. Note that the transition is more abrupt (i.e., occurs over a small temperature range) at high pHs. Nonlinear regression analysis using a two-state transition model of each individual curve is presented in supplementary information. (B) Formation diagram of i-DNA under different pH and temperature combinations. The fraction here corresponds to the average of two determinations made during the melting and annealing processes. Note that the region corresponding to partial formation, in yellow, is smaller pH 5.5, l f h p (m “c p ”) (p l ).
pH-dependent T1/2 values are plotted versus pH for 44L1 in Figure 5A. Data for all other
oligonucleotides are shown in Figure S3, and raw values are provided in Table S1. Tm in this work
is defined as the average of T1/2 obtained from heating and cooling processes 10, 54. An excellent
g l c l (P ’ > 0.99) w Tm and pH was found for all sequences in
this pH range (Figure 5B). Linear fitting results of Tm as a function of pH are given in Table S2.
These experiments allowed a precise and general quantitative assessment of pH dependency of i-DNA stability: Tm drops by 23.8 ± 1.1 °C per pH unit increment (Figure 5C); in a remarkable way,
this value is nearly independent on sequence, as shown by the nearly-parallel lines in Figure 5B. How C·C+ base pair number and loop size affect the Tm in environments that range from acid to
and structures with longer loops were more stable than those with three single-nucleotide loops. Tm
increased monotonically with C-tract length, but this increase leveled off for long runs, as the Tm
increases due to each additional C·C+ base pair dropped from ca. 4.5 °C for the shortest to 1.5 °C for the longest oligonucleotides (Figure 5D). There is a difference between the two families of sequences having a total loops size of 3 or 9 nucleotides: 33L1 and 34L1 are partially or mainly folded into intermolecular i-DNAs, while all sequences with loop size 9 adopt intramolecular structures. (Figure 2).
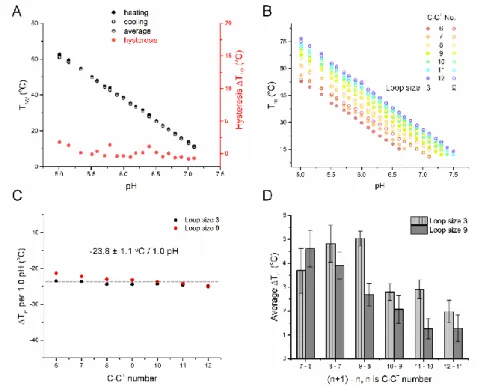
Figure 5 Thermal stability of i-DNA is pH dependent. (A) T1/2 values versus pH for the 44L1 sequence. (B) Effects of
C·C+ base pair number, loop size, and pH on Tm. For the sequences with an odd number of C·C+ base pairs (7, 9, or 11),
Tm values are averages of two i-motifs with 53E and 35E conformers. (C) Tm change per pH unit increase for model
sequences. (D) Average Tm change per each additional C·C+ base pair.
Figure 6 Temperature-dependence of pH-induced transitions of i-DNA structures. (A) pHT values determined at different
temperatures for 44L1. For this sequence, there is little or no hysteresis between the heating and cooling processes. (B) Effects of C·C+ base pair number, loop size, and temperature on pHT. For the sequences with an odd number of C·C
base pairs (7, 9, and 11), pHT values are averages of the two i-motifs with 53E and 35E conformations. (C) Average pHT
change per 1.0 °C increment in temperature. (D) Average pHT change per each additional C·C+ base pair.
The temperature-dependence of pHT values are presented in Figure 6A for 44L1. Individual curves
for each sequence are given in Figure S4, and raw values are given in Table S3. An excellent g l c l (P ’ > 0.99) w pHT and temperature were found for all
sequences (Figure 6B). Again, this behavior is remarkable, as all sequences exhibit similar temperature dependencies. Linear fitting results of pHT as a function of temperature are given in
Table S2: pHT changed by -0.04 ± 0.003 pH unit for each 1.0 °C temperature increment (Figure
6C).
While the dependency of pHT on temperature was nearly sequence-independent, pHT values at a
given temperature depended on sequence: pHT increased with the number of C·C+ base pairs, and
sequences with longer loops were more stable than those with short loops. pHT increased
monotonically with C-tract length, but, as with T1/2, this growth plateaued for long C-runs, with an
increase of 0.05 pH unit per additional base pair for the longer motifs (Figure 6D).
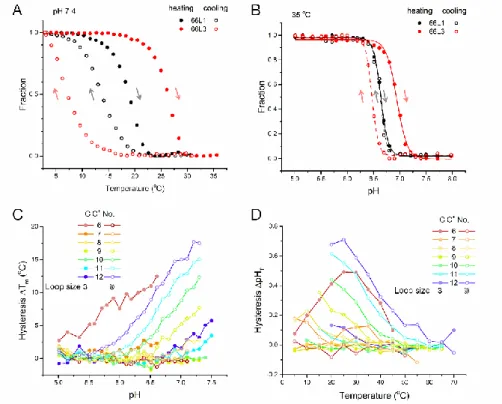
Hysteresis between denaturing and renaturing processes was found for some, but not all, i-DNAs under specific conditions for both thermal and pH transitions. Transitions for 66L1 and 66L3 are presented in Figures 7A and 7B as examples. Several factors influence the degree of hysteresis (Figures 7C and 7D): In measurement of T1/2, hysteresis becomes larger at higher pH; in
measurement of pHT, hysteresis becomes smaller at high temperatures. Additionally, sequences with
longer loops or more C·C+ base pairs had larger hysteresis for both T1/2 and pHT.Finally, sequences
that adopt intermolecular i-DNA structures, such as 33L1 and 34L1, had larger hysteresis (for both
T1/2 and pHT) than sequences that exclusively fold into intramolecular structures. We infer from
these data that longer sequence motifs, higher pHs, and lower temperatures increase hysteresis.
Figure 7 Hysteresis in thermal and pH transitions. Fraction folded as a function of (A) temperature and (B) pH for
heating and cooling processes of 66L1 (black) and 66L3 (red). Effects of C·C+ base pair number, loop size, pH and temperature on extent of (C) thermal h (h ΔTm = T1/2, heating - T1/2, cooling) and (D) pH hysteresis (hysteresis
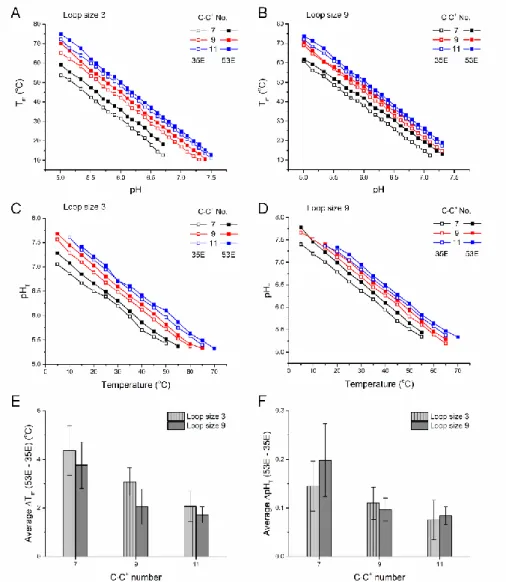
We then analyzed sequences with odd numbers of C·C+ base pairs and with C-tracts and loop of different lengths (Figure 8). A consistent trend was found: Sequences compatible with a 53E conformation, in which the first and third C-tracts are longer, are systematically more stable (both in terms of Tm and pHT) than those with a 35E conformation in which the second and last C-tracts are
longer. This observation is valid for all motifs and all experimental conditions tested here, independently of loop size (3 or 9) or total number of base pairs (7, 9 or 11) or temperature or pH (Figures 8A-D). The differences did tend to decrease when the number of C·C+ base pairs increased: Averaged Tm differences are 4, 3, and 2 °C for 7, 9, and 11 base pairs, respectively (Figure 8E), and
averaged pHT differences are around 0.15, 0.10, and 0.07 pH unit for 7, 9, and 11 base pairs,
respectively (Figure 8F).
Figure 8 Thermal and pH stabilities of 35E and 53E conformations. (A and B) Tm versus pH and (C and D) pHT versus
temperature for sequences with 35E and 53E conformations. (E) Average difference in Tm and (F) average difference in
pHT of 35E and 53E conformations at different pHs as a function of number of C·C+ base pairs. 34L1, 43L1, 34L3,
43L3, 45L1, 54L1, 45L3, 54L3, 56L1, 65L1, 56L3, and 65L3 were included in the analysis.
pHT and Tm values alone do not provide a full view of the thermodynamic properties of i-DNA
sequences. Therefore, we selected four sequences (33L3, 34L3, 43L3, and 44L3) that exclusively form intramolecular structures (Figure 2) and performed thermodynamic analyses at different pHs (Figures S5-S8), to determine model- p G f g (ΔG°) (Figure 9A). For an intramolecular equilibrium, Ka is equal to θ/(1 - θ) and ΔG°is equal to 0 at the Tm (θ = 0.5). Analyses
of ΔG° and Ka values of the four sequences led to several conclusions. First, formation of all i-DNAs
was thermodynamically favorable (ΔG°< 0) at low pH. For the sequences with 6, 7, and 8 C·C+ base pairs at pH 5.5, ΔG° values were -28, -36, and -45 kJ·mol-1 at 20 °C, respectively, and 9, 16, and -23 kJ·mol-1 at 37 °C, respectively. Second, stability decreases rapidly with pH: ΔG° became less negative or even positive at high pH, conditions under which i-DNA formation becomes thermodynamically unfavorable (ΔG°> 0). For example, at pH 7.1, ΔG° values for the sequences with 6, 7, and 8 C·C+ base pairs were +14, +8, and +3 kJ·mol-1 at 20 °C, respectively, and +41, +32, and +30 kJ·mol-1 37 °C, p c l . c ll p l c l (P ’ > 0.97, Table S4) was found between ΔG°and pH for the four tested sequences. Each increase of one pH unit translated into a change in ΔG° of 27.6 ± 1.9 and 31.3 ± 1.9 kJ/mol at 20 °C and 37 °C, respectively. Third, the sequences with more C·C+ base pairs had lower ΔG°values and therefore formation of i-DNA was more thermodynamically favorable for these sequences than for those with the potential to form fewer C·C+ base pairs. Fourth, the differences in ΔG° were relatively larger at low pHs and smaller at high pHs (Figure 9A). Fifth, as shown in Figure 9B, the ΔG° of the 53E conformation is lower than that of the 35E conformation across the entire pH range, but the difference became larger at higher pHs.
Figure 9 Thermodynamic analysis of i-DNA structures. (A) ΔG° versus pH for i-DNAs with 6 (33L3), 7 (average of
34L3 and 43L3), and 8 (44L3) C·C+ base pairs. (B) ΔG° versus pH for 35E (34L3) and 53E (43L3) conformations. (C) ΔH° versus ΔS° for i-DNAs with 6, 7, and 8 C·C+
base pairs in solutions over a pH range from 5.0 to 8.0 reveals a linear enthalpy-entropy compensation correlation.
Finally, even though both changes in enthalpy (∆H°) and entropy (∆S°) were generally less negative at high pH during the denaturing processes, the relative reduction in ∆S° is greater than that ∆H°,leading to an increase in ∆G° with pH. A fair linear correlation between ∆H° and ∆S° was found (Figure 9C), illustrative of an enthalpy-entropy compensation phenomenon. i-DNA folding is exothermic and enthalpy-driven even at neutral pH.
To better understand i-DNA properties, we investigated how parameters other than pH and temperature affect stability. Different K+ concentrations, nature of counterions, and various molecular crowding agents were tested. These factors affect the thermal stability of i-DNA at pH 7.0 (original UV melting and annealing profiles are provided in Figures S9 and S10). Interestingly, and in contrast with most other nucleic acid structures, Tm significantly decreased when the K+
concentration was increased (from 17 to 10 °C for 44L1 and from 23 to 17 °C for 44L3 when K+ concentration increased from 50 to 200 mM) (Figure S11A). In contrast to G-quadruplexes, the nature of the monovalent ion (K+, Li+, or Na+) had little, if any, effect on Tm. For example, at pH 7.0,
the Tm was 13 °C for 44L1 and 20 °C for 44L3 in the presence of each cation (Figure S11A).
The situation was more complex in the presence of molecular crowding agents. The Tm values
increased by 6 °C for both 44L1 and 44L3 in the presence of 40 wt% PEG200 and by 10 °C in the presence of PEG8000. In contrast, Ficoll70 induced very modest changes in stability (change in Tm <
1 °C) for both sequences (Figure S11B).
We then investigated if one could reach the same conclusions with a different method of analysis. To this aim, we recorded the pH-dependent circular dichroism (CD) spectra (rather than UV absorbance spectra) of all 20 sequences at 20 °C (Figure S12). An excellent agreement was found between pHT deduced from 4DUVMA and steady- CD p m (P ’ > 0.99),
indicating that our measurements are robust and independent of the platform used.
Finally, in addition to the 20 model sequences, we also investigated the stabilities of five naturally occurring i-DNA-forming sequences (Table 2) from promoter regions of the following human genes
13, 22-23, 27-28, 55-56
: DAP (chromosome 5), PDGF-A (chromosome 7), KRAS (chromosome 12), HIF-1α (chromosome 12), and BCL2 (chromosome 18). The rationale behind the study of natural sequences was to check if the conclusions reached with model sequences would apply to motifs found in genomes, which can be more complicated, with a variable number of C-tracts, different loop lengths and base compositions. CD analyses showed that all can fold into intramolecular i-DNAs (Figure S13), as confirmed by SE-HPLC analyses (Figure S14). The 4DUVMA analysis allowed to determine the pH and temperature-dependent TDS (Figure S15), fraction folded under different pHs and temperatures (Figure S16), and formation diagrams (Figure S17). We found that even the most stable i-DNAs under low pH conditions, such as those from DAP and PDGF-A promoters, do not form stable i-D ‘cl c l’ h m ph l g c l c (pH 7.0 37 °C; Figure S17). However, partial formation is still observed (<50%: Tm is below 37°C). In addition, pH and temperature are heterogeneous and fluctuate in different organs, which might favor the formation of i-DNA in cells 28, 57.
Table 2 Sequences of human promoter regions with i-DNA-forming potential studied here.
Gene name S q c (5'→3') nt Reference
DAP CCCCCGCCCCCGCCCCCGCCCCCGCCCCC 29 13, 27
KRAS GCCCGGCCCCCGCTCCTCCCCCGCCGGCCCGGCCCGGCCCCCTCCTTCTCCCCG 54 55
HIF-1α CGCGCTCCCGCCCCCTCTCCCCTCCCCGCGC 31 22, 27
BCL2 CAGCCCCGCTCCCGCCCCCTTCCTCCCGCGCCCGCCCCT 39 23, 28, 56
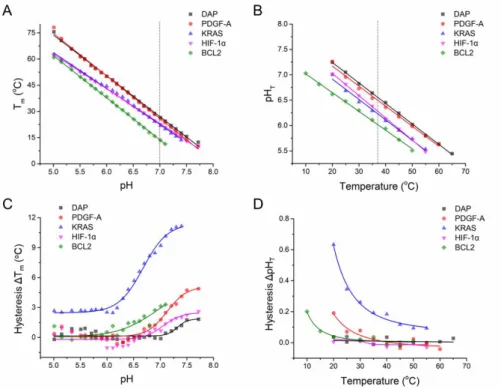
These natural motifs obey the same rules found for model sequences: Linear correlations between
Tm and pH and between pHT and temperature were found (Figures 10A-B). Linear fitting results
( l p , c p , P ’ ) mm z Table S2. The results of individual T1/2 and pHT from both melting and annealing processes, and corresponding standard errors are given in
Tables S5 and S6. These dependencies of Tm on pH and of pHT on temperature are generally within
the range found for model sequences (Table S2); exceptions are the slopes in temperature transitions of i-DNAs from KRAS and HIF-1α promoters, which are -20.60 and -19.86, respectively. The guanines in these i-DNAs may participate in the formation of G:C base pairs that enhance thermal stability of the structures. formed. Hysteresis in temperature and pH transitions were positively and negatively correlated with pH and temperature, respectively (Figures 10C-D) as observed with model sequences. Hysteresis in the transitions of the KRAS i-DNA are larger than other four sequences, likely due to its longer loops.
Figure 10 Thermal and pH stabilities of i-DNAs corresponding to regions of human promoters. (A) Tm and (B) averaged
pHT (vertical dotted line is centered at pH 7.0 in panel A and at 37 °C in panel B); (C) thermal hysteresis and (D) pH
hysteresis.
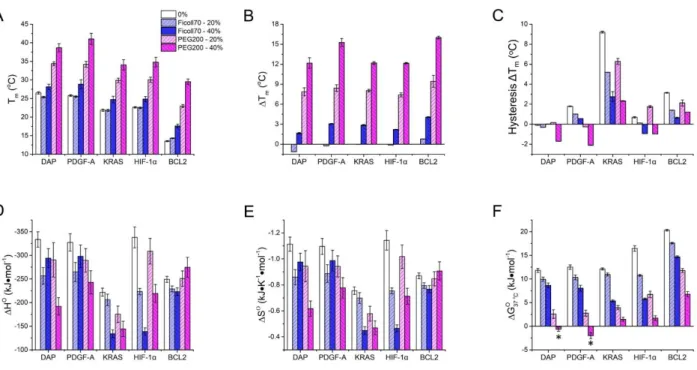
As i-DNA stability in cells has been found to be higher than in vitro 20, 27, we tested thermal stability of promoter i-DNAs in the presence of crowding agents. UV-melting/annealing profiles are given in Figure S18. Thermodynamic parameters are summarized in Tables S7-S8. Thermal stability is slightly affected by Ficoll70 (-1 °C < ΔTm < 4 °C), but greatly enhanced by PEG200, in
agreement with what was observed for the model sequences (Figures 11A and 11B). Interestingly, the thermal hysteresis decreased in the presence of crowding agents (Figure 11C), which means that the folding kinetics are faster. For example, thermal hysteresis for the KRAS i-DNA dropped from 9.2 °C in the absence of crowding agents to 2.7 and 2.3 °C in the presence of 40 wt% Ficoll70 and PEG200, respectively.
Generally, i-DNA formation in the presence of both crowders is less enthalpy driven (∆H° is less negative) than in buffer (Figure 11D). A similar result is found for entropies (∆S°s are less negative, Figure 11E), whereas ∆G°s are more negative at 20 °C and less positive at 37 °C (Figures 11F and S19). However, these crowding effects depend on sequence and nature of crowders (Figure 11, Tables 3, and S7-S8). For example, ∆H°s and ∆S°s became more negative for DAP- and PDGF-A-derived i-DNAs when the Ficoll70 concentration was increased from 20 to 40 wt% and for the
BCL2-derived i-DNA when the PEG200 concentration was increased from 20 to 40 wt%. ∆H°s and ∆S°s for the other sequences became less negative when either Ficoll70 or PEG200 concentration
was increases. Upon addition of Ficoll70, ∆G°s at 20 °C decreased slightly, by -0.8 kJ•m l-1 to -4 kJ•m l-1
) which is consistent with the small changes in Tms induced by Ficoll70. However, the ∆G°s
at 37 °C for i-DNAs derived from KRAS, HIF-1α, and BCL-2 promoters were more affected, with changes ranging from -5 kJ•m l-1 to -11 kJ•m l-1 in the presence of 40 wt% Ficoll70. PEG200 induced a strong decrease in ∆Go for all i-DNAs tested, indicating that formation of i-DNAs derived from promoter occurs under physiologically relevant (neutral pH; 37 °C) crowded conditions is thermodynamically favored (Figure 11F and Table 3).
Figure 11 Thermal stability and thermodynamic of i-DNAs in human promoter genes under neutral pH (7.0) and
crowding environments. The crowders added are indicated in colors of white (0 %, without crowder), light blue (20 wt% Ficoll70), blue (40 wt% Ficoll70), light red (20 wt% PEG200), and red (40 wt% PEG200). (A) Tm; (B) Tm changes
c h c w , wh ΔTm = Tm, crowder - Tm, 0 %; (C) Thermal hysteresis; (D) ΔH°; (E) ΔS°; (F) ΔG° at 37 °C
(the negative ΔG° values are labeled with asterisks).
Table 3 Thermal and pH stability under near physiological condition: pHT at 37 °C, Tm (°C) at pH 7.0, ΔG° (kJ•m l-1) at
pH 7.0 and 20 °C or 37 °C in the absence of and presence of 40 wt% crowding agents. a
Name pHT at 37 °C
Tm at pH 7.0 ΔG° at 20 °C and pH 7.0 ΔG° at 37 °C and pH 7.0
0 wt% Ficoll70 PEG200 0 wt% Ficoll70 PEG200 0 wt% Ficoll70 PEG200
DAP 6.6 26.5 28.2 38.7 -7.1 -8.0 -11.1 11.8 8.6 -0.6
PDGF-A 6.5 25.8 28.8 41.0 -6.1 -8.7 -15.2 12.5 8.1 -2.0
KRAS 6.2 21.8 24.7 34.0 -0.7 -2.3 -6.5 12.1 5.4 1.5
HIF-1α 6.3 22.6 24.8 34.8 -3.0 -2.1 -10.4 16.5 5.8 1.7
a
DISCUSSION
Herein, model pyrimidine oligonucleotides were tested for their ability to form i-DNA under a range of pH and temperature conditions using our 4DUVMA strategy. The sequences with fewer C·C+ base pairs and shorter loops folded into intermolecular species, in agreement with observation Šk lák á et al. 11
, while longer sequences with runs of seven or more cytosines often exhibit dual transitions, described in previous reports 11, 13. We therefore restricted the analysis to model sequences expected to form 6 to 12 C·C+ base pairs (i.e., containing four runs of 3 to 6 cytosines). By systematically exploring effects of large temperature and pH ranges on a diverse set of sequences (25 in total), we are able to quantitatively assess the effect of pH and temperature on i-DNA stability, allowing us to draw general and quantitative rules regarding effects of sequence and conditions on i-DNA stability.
First, as expected, oligonucleotides with longer C-tracts adopted more stable i-DNA structures, as shown by lower ΔG° values and higher Tm. This increase was not linear: each additional C·C+ base
pair induced an increase in Tm of 4.5 to 1.5 °C, whereas pHT increased from ca. 0.15 to 0.05 pH unit.
This non-linear behavior is not surprising, as DNA duplexes actually behave the same way 58-59. A similar explanation may be proposed for both structures: one must first keep in mind that Tm is
l , c l p p l, ∆G°37°C: as the number of base pairs increases, the melting
p f l c m h p h p , ∆H° c ( h m m “c p ”): this means that even if the increase in Tm m ll , h ∆∆G° may be similar. In addition, past a
given length of helix, certain approximations such as two-state melting are no longer usable 59-60. Second, hysteresis between the thermal denaturation and renaturation processes has been observed
5, 10-11, 13, 20, 61
and hysteresis between pH denaturation and renaturation processes has also been found
12, 61
. This is the first report in which hysteresis for both thermal and pH transitions is analyzed simultaneously. Both thermal and pH hystereses were more pronounced for longer sequences, at higher pHs, and at lower temperatures.
Third, and more surprising, was the systematic difference in stability between 53E and 35E motifs. At first glance, the energetic difference between 53E and 35E (or between 5'E and 3'E) should be negligible, given that an identical number of base pairs are formed with identical loops. Our results indicate that this is not the case, and examples in the literature support this conclusion. For example, the tetramolecular i-DNA formed by [d(CCCC)]4 (PDB ID: 190D) is exclusively observed in a 5'E
arrangement in the crystal 62, whereas [d(CC)]4 (PDB ID: 1M6A) mainly adopts a 3'E conformation
in solution 63-64. Stacking interactions from proximal non-cytosine nucleobases 19, 65, unique hydrogen bonding 64, 66, and external factors including pH 8 and cation 32, 64 also affect the conformations adopted.
Fourth, an increase in pH of one unit leads to a decrease in Tm of 23.8 ± 1.1 °C in the pH range
from 5.0 to 8.0. Indeed, a linear correlation of Tm on pH was previously found 5, 9. However, these
results were obtained on a limited set of sequences corresponding to i-DNAs with short C2 or C3
tracts. These motifs are less likely to be physiologically relevant, as their stability is marginal at physiological pH. In this work performed on a large set of sequences, this reduction of Tm varies
between 19.9 oC (for HIF-1α) and 25.0 oC (for 66L1); it extends this conclusion to a larger pH window on physiologically relevant motifs, demonstrated to be formed in cells 20, 27. This linear effect is only weakly dependent on the sequence (-23.8 ± 1.1 °C per pH unit). This dependency is slightly lower for the i-DNA derived from the HIF-1α promoter due to the potential contribution of other pairing schemes (i.e., GC base pairs which are nearly pH-independent under these conditions
67
). The formation of additional Watson-Crick base pairs in i-DNA may therefore play a significant role on stability when approaching neutrality, leading to a relatively lower absolute slope of Tm
Fifth, negative linear correlations were found between pHT and temperature (-0.04 ± 0.003 pH unit
per 1.0 °C temperature increase) for all sequences. Again, this effect, which was never quantified before, is weakly sequence-dependent (maximal and minimal values are -0.038 and -0.043 pH unit, respectively).
These linear correlations between pHT and temperature, as well as between Tm and pH, are very
useful, as they allow to predict stability at pH within a large range, including for physiologically relevant i-DNAs. An impressive finding is that these linear correlations are valid in a wide and physiologically relevant pH range, between 5.0 and 8.0. Below pH 5, the behavior is no longer linear, and a discussion of this phenomenon is presented in 5: at pH >> pKa, the single strand is >99% deprotonated, and there is a net uptake of n protons when forming n C•C+ base pairs. This protonation, which is exothermic, becomes harder and harder at higher pH, as reflected by a more m g ∆S°. One can thus decompose the folding process into three main contributions: cytosine protonation, buffer deprotonation, and proper i-DNA formation.
Sixth, stability was negatively affected by ionic strength, as previously reported 5. This is in contrast with most other nucleic acid structures studied so far 58.
Seventh, the effects of molecular crowding depended on the nature of the compound used to mimic crowding. Whereas PEG induced a significant increase in melting temperature, a nonionic synthetic polymer of sucrose, Ficoll, did not have a notable effect. No consensus has been reached regarding the effect of crowding on i-DNA stability 58. Several groups have noted that PEG may not be appropriate for analysis of the effects of molecular crowding on quadruplex DNAs as its binds to nucleic acid structures 50, 68-70. Hysteresis may also complicate the analysis, as crowding mimics such as PEG and Ficoll accelerate kinetics at neutral pH. A detailed analysis of their effects therefore requires the analysis of both melting and cooling processes. The observation that Ficoll only weakly affected i-DNA stability is in line with a previous finding that i-DNA and the corresponding unfolded single strand have similar volumes 36.
Based on the 4DUVMA approach, we now have the means to compare results obtained under a wide variety of experimental conditions, in terms of pH, temperature, cation nature and concentration, and crowding. This should facilitate the analysis of published data and allow the design of reliable tools to predict i-DNA stability under a given set of conditions. Intracellular environments are much more complex than that in tube buffer solutions. Previous work has indicated that i-DNA is slightly more stable in cells than in vitro 20, 27. Our results indicate that factors such as differences in hydration or dielectric constant or interactions with proteins 56, 71-74 or small metabolites may account for this difference. The intracellular pH, temperature and salt vary from one organism to another, and conditions vary in individual cellular organelles and compartments 75-81. In addition, the environment is dynamic and fluctuates over time 75-76. Considering that i-motif forming sequence may exist in the genomes of many organisms and that the i-motif has potential for use in nano-devices applied in different subcellular compartments 82-84, the 4DUVMA method described here may become a universal approach to evaluate the stability of any specific i-DNA forming sequences.
CONCLUSIONS
The comprehensive 4DUVMA approach was developed to analyze the formation of i-DNA structures by 20 model sequences and 5 human promoter-derived sequences under a variety of conditions. We observed excellent linear correlations between thermal stability and pH and between pH stability and temperature, allowing us to draw general conclusions on i-DNA pH and temperature dependencies. Analysis of the data revealed differences in stability for the i-DNAs with an odd and even numbers of C·C+ base pairs and between the 53E and 35E motifs. Crowding was found to
facilitate the formation of i-DNAs not only from a thermodynamic point of view but also by accelerating kinetics under near physiological conditions. The 4DUVMA approach will facilitate study of natural i-DNA-forming sequences and should help designing pH-sensitive nano-devices.
MATERIALS AND METHODS
Oligonucleotides and buffers
All oligonucleotides were purchased from Integrated DNA Technologies. Oligonucleotides were desalted and used without further purification. Sequence information is provided in Tables 1 and 2. Buffers containing 40 mM cacodylate w j h pH h g f 5.0 8.0 g g KOH (≥99%) HCl (37 w . % H2O) at room
temperature. Cacodylate buffer was chosen as its pKa is nearly independent of temperature 53-54, 85, which is critical for
the thermal analysis of pH-sensitive structures such as the i-DNA. The final potassium concentration in all buffers was adjusted to 100 mM with KCl. For the cacodylate potassium buffers with molecular crowding agents, pH was further adjusted after the addition of all agents. Unless otherwise stated, these cacodylate potassium buffers were used for all p m . S mpl f 1.0 μM l g cl ff w h 95 °C f 5 m , h l wl (2-3 h) cooled to room temperature and stored at 4 °C. Data were processed and analyzed by software MATLAB 2020Rb (The MathWorks, Inc.) and OriginPro 2015 (OriginLab Corp.).
Size-exclusion high-performance liquid chromatography
SE-HPLC experiments were performed as previously described 51 on a Dionex UltiMate 3000 UHPLC system (Thermo Fisher Scientific) equipped with an autosampler, a Thermo Acclaim SEC-300 column (4.6 × 300 mm; 5 µm hydrophilic polymethacrylate resin spherical particles with 300 Å pore size), and a diode array detector. Unless otherwise stated, a solution containing 40 mM cacodylate buffer, pH 6, with 100 mM potassium was used as an elution buffer and to dissolve oligonucleotides. A 30-µL aliquot of oligonucleotide solution was injected onto the column (0.15 mL/min elution flow rate at 20 °C), and elution was monitored by measuring absorbance. Chromatograms were obtained by plotting the normalized absorbance at 260 nm as a function of relative elution volume Ve/Vo, where Ve is the elution
volume calculated using the retention time and flow rate, and Vo is dead volume of the system. The structure index of a
given species, which is equal to (Ve/Vo) x log10 (molecular weight of strand, g·mol -1
), was used to discriminate the molecularity of i-DNAs 51. Fractions corresponding to higher-order and monomer species were determined by integration of their corresponding peaks.
Four dimensional UV melting and annealing experiments
UV absorbance spectra were recorded in the 220-330 nm wavelength range with a 1.0 nm bandwidth on a Uvikon XL Secomam UV-Visible double beam spectrophotometer (AQUALABO ANALYSE) equipped with a thermostatable 12-cell holder and a high-performance Julabo temperature controller (Seelbach). Samples were prepared in 40 mM cacodylate buffers. Spectra were acquired every 6.0 min for each cell in the 5-90 °C temperature range using a fixed temperature gradient of 0.2 °C/min during both heating and cooling processes. Stable dry air was constantly blown through the cell holder during whole acquiring process to minimize water condensation at low temperature. Spectra were recorded at a 1000 nm/s scanning rate and the temperature of a buffer solution in the reference cell was recorded at the same time. Cells were capped tightly to minimize the water evaporation at high temperature. Each oligonucleotide was added at 1.0 µM strand concentration. In order to minimize the error introduced by the possible subtle difference of strand concentration in different wells, sample concentration in each cell was calibrated with the Beer–Lambert law using the absorbance at 260 nm measured at the highest recorded temperature (i-DNAs were completely unfolded at a such high temperature) and the molar extinction coefficient of the oligonucleotide provided by the manufacturer.
Determination of pH-dependent T1/2 or Tm values
Unless otherwise stated, the folded fraction (θ) was determined from the molar absorbance at 295 nm. θ varies between 0 and 1, corresponding to fully unfolded and fully folded species, respectively. By assuming that the transition equilibrium involves only two species (folded and unfolded), the mid-transition temperature (T1/2, θ = 0.5) was fitted
with a Boltzmann sigmoidal equation to determine the fraction folded as a function of temperature at a given pH. When the heating and cooling profiles are superimposable (T1/2, heating ≈ T1/2, cooling), the folding and unfolding process are
reversible, and the melting temperature (Tm) is equal to T1/2 fromeither heating or cooling process. When a hysteresis
between heating and cooling profiles is present (T1/2, heating ≠ T1/2, cooling), both folding and unfolding process are relatively
slow, and we used the average value between T1/2 fromheating and cooling processes as an approximation for the
equilibrium melting temperature, Tm53-54, 85. This averaging method actually gives an excellent estimate of the real Tm, as
illustrated in the reference 10.
From absorbances at different pHs (5.0-8.0 range) and temperatures (5.0-90.0 °C range), one can extract the pH-dependent formation fraction at a specific temperature. The pH of mid-transition (pHT, θ = 0.5) was determined using a
Boltzmann sigmoidal equation to fit the plot of formation fraction as a function of pH in the 5.0-8.0 range at a specific temperature. When the heating and cooling profiles were superimposable (pHT, heating ≈ pHT, cooling), the averaged pHT is
equal to the pHT fromeither heating or cooling process; when a hysteresis between is present (pHT, heating ≠ pHT, cooling), the
averaged pHT is equal to the average value of pHT fromheating and cooling processes.
Circular dichroism measurements
Experiments were conducted on a J-1500 CD spectrophotometer (JASCO) in the 220-330 nm wavelength range with a 1.0 nm bandwidth at 20 °C. The samples used for UV absorbance were used. The corresponding buffer scan was subtracted from each sample scan before data processing. CD profiles were also calibrated by the measured DNA concentration. The signal changes at 288 nm for CD ellipticity were used to calculate pHT of the structure switching from
a stable i-DNA to a random coil, and pHT was obtained by fitting the signals versus pH values with a Boltzmann
sigmoidal function.
ASSOCIATED CONTENT
This Supporting Information is available free of charge via the internet at http://pubs.acs.org/XXX”, cl g Figures
S1-S19, and Tables S1-S8.
AUTHOR INFORMATION
Corresponding Authors
*Mingpan Cheng (m821315457@outlook.com);
*Jun Zhou (jun.zhou@nju.edu.cn);
*Jean-Louis Mergny (jean-louis.mergny@inserm.fr).
ORCID
Mingpan Cheng: orcid.org/0000-0003-1282-0076 Jielin Chen: orcid.org/0000-0003-4930-2870 Huangxian Ju: orcid.org/0000-0002-6741-5302 Jun Zhou: orcid.org/0000-0002-6793-3169
Jean-Louis Mergny: orcid.org/0000-0003-3043-8401
Notes
The authors declare no competing financial interest.
ACKNOWLEDGMENTS
M.C. benefited from a post-doctoral fellowship from Idex Bordeaux. J.Z. acknowledges support from the National Natural Science Foundation of China (21977045), Fundamental Research Funds for the Central Universities (02051430210). J.L.M. acknowledges the funds of Nanjing University (020514912216). This work was also supported by the China Postdoctoral Science Foundation (2019M661793).
REFERENCES
1. Gehring, K.; Leroy, J.-L.; Guéron, M., A tetrameric DNA structure with protonated cytosine·cytosine base pairs.
Nature 1993, 363 (6429), 561-565.
2. Kang, C. H.; Berger, I.; Lockshin, C.; Ratliff, R.; Moyzis, R.; Rich, A., Crystal structure of intercalated four-stranded d(C3T) at 1.4 A resolution. Proc. Natl. Acad. Sci. U. S. A. 1994, 91 (24), 11636-11640.
3. Marsh, R. E.; Bierstedt, R.; Eichhorn, E. L., The crystal structure of cytosine-5-acetic acid. Acta Cryst. 1962, 15 (4), 310-316.
4. Langridge, R.; Rich, A., Molecular structure of helical polycytidylic acid. Nature 1963, 198, 725-728.
5. Mergny, J.-L.; Lacroix, L.; Han, X.; Leroy, J.-L.; Hélène, C., Intramolecular folding of pyrimidine oligodeoxynucleotides into an i-DNA motif. J. Am. Chem. Soc. 1995, 117 (35), 8887-8898.
6. Han, X.; Leroy, J.-L.; Guéron, M., An intramolecular i-motif: the solution structure and base-pair opening kinetics of d(5mCCT3CCT3ACCT3CC). J. Mol. Biol. 1998, 278 (5), 949-965.
7. Phan, A. T.; Guéron, M.; Leroy, J.-L., The solution structure and internal motions of a fragment of the cytidine-rich strand of the human telomere. J. Mol. Biol. 2000, 299 (1), 123-144.
8. Nonin-Lecomte, S.; Leroy, J.-L., Structure of a C-rich strand fragment of the human centromeric satellite III: a pH-dependent intercalation topology. J. Mol. Biol. 2001, 309 (2), 491-506.
9. Leroy, J.-L.; Guéron, M.; Mergny, J.-L.; Hélène, C., Intramolecular folding of a fragment of the cytosine-rich strand of telomeric DNA into an i-motif. Nucleic Acids Res. 1994, 22 (9), 1600-1606.
10. Mergny, J.-L.; Lacroix, L., Kinetics and thermodynamics of i-DNA formation: phosphodiester versus modified
oligodeoxynucleotides. Nucleic Acids Res. 1998, 26 (21), 4797-4803.
11. Školáková, P.; Renčiuk, D.; Palacký, J.; Krafčík, D.; Dvořáková, Z.; Kejnovská, I.; Bednářová, K.; Vorlíčková, M., Systematic investigation of sequence requirements for DNA i-motif formation. Nucleic Acids Res. 2019, 47 (5), 2177-2189.
12. Rogers, R. A.; Fleming, A. M.; Burrows, C. J., Unusual isothermal hysteresis in DNA i-motif pH transitions: a study of the RAD17 promoter sequence. Biophys. J. 2018, 114 (8), 1804-1815.
13. Wright, E. P.; Huppert, J. L.; Waller, Z. A. E., Identification of multiple genomic DNA sequences which form i-motif structures at neutral pH. Nucleic Acids Res. 2017, 45 (6), 2951-2959.
14. Mir, B.; Serrano, I.; Buitrago, D.; Orozco, M.; Escaja, N.; Gonzalez, C., Prevalent sequences in the human genome can form mini i-motif structures at physiological pH. J. Am. Chem. Soc. 2017, 139 (40), 13985-13988.
15. Fleming, A. M.; Ding, Y.; Rogers, R. A.; Zhu, J.; Zhu, J.; Burton, A. D.; Carlisle, C. B.; Burrows, C. J., 4n-1 is a "sweet spot" in DNA i-motif folding of 2'-deoxycytidine homopolymers. J. Am. Chem. Soc. 2017, 139 (13), 4682-4689. 16. Nesterova, I. V.; Nesterov, E. E., Rational design of highly responsive pH sensors based on DNA i-motif. J. Am.
Chem. Soc. 2014, 136 (25), 8843-8846.
17. Choi, J.; Kim, S.; Tachikawa, T.; Fujitsuka, M.; Majima, T., pH-induced intramolecular folding dynamics of i-motif DNA. J. Am. Chem. Soc. 2011, 133 (40), 16146-16153.
18. Zhao, Y.; Zeng, Z. X.; Kan, Z. Y.; Hao, Y. H.; Tan, Z., The folding and unfolding kinetics of the i-motif structure formed by the C-rich strand of human telomere DNA. ChemBioChem 2005, 6 (11), 1957-1960.
19. Canalia, M.; Leroy, J.-L., Structure, internal motions and association-dissociation kinetics of the i-motif dimer of d(5mCCTCACTCC). Nucleic Acids Res. 2005, 33 (17), 5471-5481.
20. Cheng, M.; Qiu, D.; Tamon, L.; Ištvánková, E.; Víšková, P.; Amrane, S.; Guédin, A.; Chen, J.; Lacroix, L.; Ju, H.; Trantírek, L.; Sahakyan, A. B.; Zhou, J.; Mergny, J.-L., Thermal and pH stabilities of i-DNA: Confronting in vitro experiments with models and in-cell NMR data. Angew. Chem., Int. Ed. 2021, doi: 10.1002/anie.202016801.
21. Abdelhamid, M. A. S.; Waller, Z. A. E., Tricky topology: persistence of folded human telomeric i-motif DNA
at ambient temperature and neutral pH. Front. Chem. 2020, 8, 40.
22. Brazier, J. A.; Shah, A.; Brown, G. D., I-motif formation in gene promoters: unusually stable formation in sequences complementary to known G-quadruplexes. Chem. Commun. 2012, 48 (87), 10739-10741.
23. Kendrick, S.; Akiyama, Y.; Hecht, S. M.; Hurley, L. H., The i-motif in the bcl-2 P1 promoter forms an unexpectedly stable structure with a unique 8:5:7 loop folding pattern. J. Am. Chem. Soc. 2009, 131 (48), 17667-17676. 24. Iaccarino, N.; Cheng, M.; Qiu, D.; Pagano, B.; Amato, J.; Porzio, A. D.; Zhou, J.; Randazzo, A.; Mergny, J.-L., Effects of sequence and base composition on the CD and TDS profiles of i-DNA. Angew. Chem., Int. Ed. 2021, doi: 10.1002/anie.202016822.
25. Li, X.; Peng, Y.; Ren, J.; Qu, X., Carboxyl-modified single-walled carbon nanotubes selectively induce human telomeric i-motif formation. Proc. Natl. Acad. Sci. U. S. A. 2006, 103 (52), 19658-19663.
26. Chen, Y.; Qu, K.; Zhao, C.; Wu, L.; Ren, J.; Wang, J.; Qu, X., Insights into the biomedical effects of carboxylated single-wall carbon nanotubes on telomerase and telomeres. Nat. Commun. 2012, 3, 1074.
27. Dzatko, S.; Krafcikova, M.; Hansel-Hertsch, R.; Fessl, T.; Fiala, R.; Loja, T.; Krafcik, D.; Mergny, J.-L.; Foldynova-Trantirkova, S.; Trantirek, L., Evaluation of the stability of DNA i-motifs in the nuclei of living mammalian cells. Angew. Chem., Int. Ed. 2018, 57 (8), 2165-2169.
28. Zeraati, M.; Langley, D. B.; Schofield, P.; Moye, A. L.; Rouet, R.; Hughes, W. E.; Bryan, T. M.; Dinger, M. E.; Christ, D., I-motif DNA structures are formed in the nuclei of human cells. Nat. Chem. 2018, 10 (6), 631-637.
29. Leroy, J.-L.; Guéron, M., Solution structures of the i-motif tetramers of d(TCC), d(5methylCCT) and d(T5methylCC): novel NOE connections between amino protons and sugar protons. Structure 1995, 3 (1), 101-120. 30. Cai, L.; Chen, L.; Raghavan, S.; Ratliff, R.; Moyzis, R.; Rich, A., Intercalated cytosine motif and novel adenine clusters in the crystal structure of the Tetrahymena telomere. Nucleic Acids Res. 1998, 26 (20), 4696-4705.
31. Snoussi, K.; Nonin-Lecomte, S.; Leroy, J.-L., The RNA i-motif. J. Mol. Biol. 2001, 309 (1), 139-153.
32. Esmaili, N.; Leroy, J.-L., i-motif solution structure and dynamics of the d(AACCCC) and d(CCCCAA) tetrahymena telomeric repeats. Nucleic Acids Res. 2005, 33 (1), 213-224.
33. Lieblein, A. L.; Buck, J.; Schlepckow, K.; Fürtig, B.; Schwalbe, H., Time-resolved NMR spectroscopic studies of DNA i-motif folding reveal kinetic partitioning. Angew. Chem., Int. Ed. 2012, 51 (1), 250-253.
34. Lieblein, A. L.; Fürtig, B.; Schwalbe, H., Optimizing the kinetics and thermodynamics of DNA i-motif folding.
ChemBioChem 2013, 14 (10), 1226-1230.
35. Fleming, A. M.; Stewart, K. M.; Eyring, G. M.; Ball, T. E.; Burrows, C. J., Unraveling the 4n - 1 rule for DNA i-motif stability: base pairs vs. loop lengths. Org. Biomol. Chem. 2018, 16 (24), 4537-4546.
36. Liu, L.; Kim, B. G.; Feroze, U.; Macgregor, R. B., Jr.; Chalikian, T. V., Probing the ionic atmosphere and hydration of the c-MYC i-motif. J. Am. Chem. Soc. 2018, 140 (6), 2229-2238.
37. Chu, B.; Zhang, D.; Paukstelis, P. J., A DNA G-quadruplex/i-motif hybrid. Nucleic Acids Res. 2019, 47 (22), 11921-11930.
38. Iaccarino, N.; Di Porzio, A.; Amato, J.; Pagano, B.; Brancaccio, D.; Novellino, E.; Leardi, R.; Randazzo, A., Assessing the influence of pH and cationic strength on i-motif DNA structure. Anal. Bioanal. Chem. 2019, 411 (28), 7473-7479.
39. Volker, J.; Klump, H. H.; Breslauer, K. J., The energetics of i-DNA tetraplex structures formed intermolecularly by d(TC5) and intramolecularly by d[(C5T3)3C5]. Biopolymers 2007, 86 (2), 136-147.
40. Day, H. A.; Wright, E. P.; MacDonald, C. J.; Gates, A. J.; Waller, Z. A. E., Reversible DNA i-motif to hairpin switching induced by copper(II) cations. Chem. Commun. 2015, 51 (74), 14099-14102.
41. Day, H. A.; Huguin, C.; Waller, Z. A. E., Silver cations fold i-motif at neutral pH. Chem. Commun. 2013, 49 (70), 7696-7698.
42. Kohagen, M.; Uhlig, F.; Smiatek, J., On the nature of ion‐stabilized cytosine pairs in DNA i‐motifs: the importance of charge transfer processes. Int. J. Quantum Chem. 2019, 119 (14), e25933.
43. Abdelhamid, M. A.; Fabian, L.; MacDonald, C. J.; Cheesman, M. R.; Gates, A. J.; Waller, Z. A. E., Redox-dependent control of i-motif DNA structure using copper cations. Nucleic Acids Res. 2018, 46 (12), 5886-5893.
44. Gao, J.; Berden, G.; Rodgers, M. T.; Oomens, J., Interaction of Cu+ with cytosine and formation of i-motif-like C-M+-C complexes: alkali versus coinage metals. Phys. Chem. Chem. Phys. 2016, 18 (10), 7269-7277.
45. Miyoshi, D.; Matsumura, S.; Nakano, S.; Sugimoto, N., Duplex dissociation of telomere DNAs induced by molecular crowding. J. Am. Chem. Soc. 2004, 126 (1), 165-169.
46. Rajendran, A.; Nakano, S.; Sugimoto, N., Molecular crowding of the cosolutes induces an intramolecular i-motif structure of triplet repeat DNA oligomers at neutral pH. Chem. Commun. 2010, 46 (8), 1299-1301.
47. Paul, S.; Hossain, S. S.; Samanta, A., Insights into the folding pathway of a c-MYC-promoter-based i-motif DNA in crowded environments at the single-molecule level. J. Phys. Chem. B 2020, 124 (5), 763-770.
48. Reilly, S. M.; Morgan, R. K.; Brooks, T. A.; Wadkins, R. M., Effect of interior loop length on the thermal stability and pKa of i-motif DNA. Biochemistry 2015, 54 (6), 1364-1370.
49. Bhavsar-Jog, Y. P.; Van Dornshuld, E.; Brooks, T. A.; Tschumper, G. S.; Wadkins, R. M., Epigenetic modification, dehydration, and molecular crowding effects on the thermodynamics of i-motif structure formation from C-rich DNA. Biochemistry 2014, 53 (10), 1586-1594.
50. Cui, J.; Waltman, P.; Le, V. H.; Lewis, E. A., The effect of molecular crowding on the stability of human c-MYC promoter sequence i-motif at neutral pH. Molecules 2013, 18 (10), 12751-12767.
51. Largy, E.; Mergny, J.-L., Shape matters: size-exclusion HPLC for the study of nucleic acid structural polymorphism. Nucleic Acids Res. 2014, 42 (19), e149.
52. Dailey, M. M.; Miller, M. C.; Bates, P. J.; Lane, A. N.; Trent, J. O., Resolution and characterization of the structural polymorphism of a single quadruplex-forming sequence. Nucleic Acids Res. 2010, 38 (14), 4877-4888. 53. Mergny, J.-L.; Li, J.; Lacroix, L.; Amrane, S.; Chaires, J. B., Thermal difference spectra: a specific signature for nucleic acid structures. Nucleic Acids Res. 2005, 33 (16), e138.
54. Mergny, J.-L.; Lacroix, L., Analysis of thermal melting curves. Oligonucleotides 2003, 13 (6), 515-537. 55. Kaiser, C. E.; Van Ert, N. A.; Agrawal, P.; Chawla, R.; Yang, D.; Hurley, L. H., Insight into the complexity of the i-motif and G-quadruplex DNA structures formed in the KRAS promoter and subsequent drug-induced gene repression. J. Am. Chem. Soc. 2017, 139 (25), 8522-8536.
56. Kang, H. J.; Kendrick, S.; Hecht, S. M.; Hurley, L. H., The transcriptional complex between the BCL2 i-motif and hnRNP LL is a molecular switch for control of gene expression that can be modulated by small molecules. J. Am.
Chem. Soc. 2014, 136 (11), 4172-4185.
57. Abou Assi, H.; Garavis, M.; Gonzalez, C.; Damha, M. J., i-Motif DNA: structural features and significance to cell biology. Nucleic Acids Res. 2018, 46 (16), 8038-8056.
58. Takahashi, S.; Sugimoto, N., Stability prediction of canonical and non-canonical structures of nucleic acids in various molecular environments and cells. Chem. Soc. Rev. 2020, 49 (23), 8439-8468.
59. SantaLucia, J., Jr.; Allawi, H. T.; Seneviratne, P. A., Improved nearest-neighbor parameters for predicting DNA duplex stability. Biochemistry 1996, 35 (11), 3555-3562.
60. Panjkovich, A.; Melo, F., Comparison of different melting temperature calculation methods for short DNA sequences. Bioinformatics 2005, 21 (6), 711-722.
61. Rogers, R. A.; Meyer, M. R.; Stewart, K. M.; Eyring, G. M.; Fleming, A. M.; Burrows, C. J., Hysteresis in poly-2'-deoxycytidine i-motif folding is impacted by the method of analysis as well as loop and stem lengths.
Biopolymers 2021, 112 (1), e23389.
62. Chen, L.; Cai, L.; Zhang, X.; Rich, A., Crystal structure of a four-stranded intercalated DNA: d(C4).
Biochemistry 1994, 33 (46), 13540-13546.
63. Leroy, J.-L., T·T pair intercalation and duplex interconversion within i-motif tetramers. J. Mol. Biol. 2003, 333 (1), 125-139.
64. Leroy, J.-L.; Snoussi, K.; Gureon, M., Investigation of the energetics of C–H···O hydrogen bonds in the DNA i-motifvia the equilibrium between alternative intercalation topologies. Magn. Reson. Chem. 2001, 39 (S1), S171-S176. 65. Canalia, M.; Leroy, J.-L., [5mCCTCTCTCC]4: an i-m f m w h c l T•T p . J. Am. Chem. Soc. 2009, 131 (36), 12870-12871.
66. Berger, I.; Egli, M.; Rich, A., Inter-strand C-H···O hydrogen bonds stabilizing four-stranded intercalated molecules: stereoelectronic effects of O4' in cytosine-rich DNA. Proc. Natl. Acad. Sci. U. S. A. 1996, 93 (22), 12116-12121.
67. Owczarzy, R.; Moreira, B. G.; You, Y.; Behlke, M. A.; Walder, J. A., Predicting stability of DNA duplexes in solutions containing magnesium and monovalent cations. Biochemistry 2008, 47 (19), 5336-5353.
68. Shkel, I. A.; Knowles, D. B.; Record, M. T., Jr., Separating chemical and excluded volume interactions of polyethylene glycols with native proteins: comparison with PEG effects on DNA helix formation. Biopolymers 2015,
103 (9), 517-527.
69. Buscaglia, R.; Miller, M. C.; Dean, W. L.; Gray, R. D.; Lane, A. N.; Trent, J. O.; Chaires, J. B., Polyethylene glycol binding alters human telomere G-quadruplex structure by conformational selection. Nucleic Acids Res. 2013, 41 (16), 7934-7946.
70. Hänsel, R.; Löhr, F.; Foldynová-Trantírková, S.; Bamberg, E.; Trantírek, L.; Dötsch, V., The parallel G-quadruplex structure of vertebrate telomeric repeat sequences is not the preferred folding topology under physiological conditions. Nucleic Acids Res. 2011, 39 (13), 5768-5775.
71. Niu, K.; Zhang, X.; Deng, H.; Wu, F.; Ren, Y.; Xiang, H.; Zheng, S.; Liu, L.; Huang, L.; Zeng, B.; Li, S.; Xia, Q.; Song, Q.; Palli, S. R.; Feng, Q., BmILF and i-motif structure are involved in transcriptional regulation of BmPOUM2 in Bombyx mori. Nucleic Acids Res. 2018, 46 (4), 1710-1723.
72. Lacroix, L.; Lienard, H.; Labourier, E.; Djavaheri-Mergny, M.; Lacoste, J.; Leffers, H.; Tazi, J.; Helene, C.; Mergny, J.-L., Identification of two human nuclear proteins that recognise the cytosine-rich strand of human telomeres in
vitro. Nucleic Acids Res. 2000, 28 (7), 1564-1575.
73. Marsich, E.; Xodo, L. E.; Manzini, G., Widespread presence in mammals and high binding specificity of a nuclear protein that recognises the single-stranded telomeric motif (CCCTAA)n. Eur. J. Biochem. 1998, 258 (1), 93-99.
74. Marsich, E.; Piccini, A.; Xodo, L. E.; Manzini, G., Evidence for a HeLa nuclear protein that binds specifically to the single-stranded d(CCCTAA)n telomeric motif. Nucleic Acids Res. 1996, 24 (20), 4029-4033.
75. Webb, B. A.; Chimenti, M.; Jacobson, M. P.; Barber, D. L., Dysregulated pH: a perfect storm for cancer progression. Nat. Rev. Cancer 2011, 11 (9), 671-677.
76. Gadsby, D. C., Ion channels versus ion pumps: the principal difference, in principle. Nat. Rev. Mol. Cell Biol.
2009, 10 (5), 344-352.
77. Litan, A.; Langhans, S. A., Cancer as a channelopathy: ion channels and pumps in tumor development and progression. Front. Cell. Neurosci. 2015, 9, 86.
78. Warner, D. A.; Shine, R., The adaptive significance of temperature-dependent sex determination in a reptile.
Nature 2008, 451 (7178), 566-568.
79. Patel, D.; Franklin, K. A., Temperature-regulation of plant architecture. Plant Signaling Behav. 2009, 4 (7), 577-579.
80. Protsiv, M.; Ley, C.; Lankester, J.; Hastie, T.; Parsonnet, J., Decreasing human body temperature in the United States since the industrial revolution. eLife 2020, 9, e49555.
81. Casey, J. R.; Grinstein, S.; Orlowski, J., Sensors and regulators of intracellular pH. Nat. Rev. Mol. Cell Biol.
2010, 11 (1), 50-61.
82. Leung, K.; Chakraborty, K.; Saminathan, A.; Krishnan, Y., A DNA nanomachine chemically resolves
lysosomes in live cells. Nat. Nanotechnol. 2019, 14 (2), 176-183.
83. Mergny, J.-L.; Sen, D., DNA quadruple helices in nanotechnology. Chem. Rev. 2019, 119 (10), 6290-6325.
84. Debnath, M.; Fatma, K.; Dash, J., Chemical regulation of DNA i-motifs for nanobiotechnology and therapeutics.
Angew. Chem., Int. Ed. 2019, 58 (10), 2942-2957.
85. Mergny, J.-L.; Lacroix, L., UV melting of G-quadruplexes. Curr. Protoc. Nucleic Acid Chem. 2009, Chapter 17, Unit 17.1.
Table of Contents (TOC)
A method called 4DUVMA was developed to analyze i-motif formation under a variety of pH and temperature combinations.