Publisher’s version / Version de l'éditeur:
Vous avez des questions? Nous pouvons vous aider. Pour communiquer directement avec un auteur, consultez la première page de la revue dans laquelle son article a été publié afin de trouver ses coordonnées. Si vous n’arrivez pas à les repérer, communiquez avec nous à [email protected].
Questions? Contact the NRC Publications Archive team at
[email protected]. If you wish to email the authors directly, please see the first page of the publication for their contact information.
https://publications-cnrc.canada.ca/fra/droits
L’accès à ce site Web et l’utilisation de son contenu sont assujettis aux conditions présentées dans le site LISEZ CES CONDITIONS ATTENTIVEMENT AVANT D’UTILISER CE SITE WEB.
Technical Paper (National Research Council of Canada. Division of Building
Research), 1965-03
READ THESE TERMS AND CONDITIONS CAREFULLY BEFORE USING THIS WEBSITE. https://nrc-publications.canada.ca/eng/copyright
NRC Publications Archive Record / Notice des Archives des publications du CNRC : https://nrc-publications.canada.ca/eng/view/object/?id=8b45674e-36a4-42c1-9c30-a10320df0fce https://publications-cnrc.canada.ca/fra/voir/objet/?id=8b45674e-36a4-42c1-9c30-a10320df0fce
NRC Publications Archive
Archives des publications du CNRC
For the publisher’s version, please access the DOI link below./ Pour consulter la version de l’éditeur, utilisez le lien DOI ci-dessous.
https://doi.org/10.4224/20378175
Access and use of this website and the material on it are subject to the Terms and Conditions set forth at
Tests of a 100-ft Continuous Prestressed Concrete Beam
Nnrrorunl Resenncn
Couttcrt-D I V I S I O N O F t s U I L Couttcrt-D I N G R E S E A R C HlSu,fiSf
TESTS OF A IOO. FT CONTINUOUS
PRESTRESSED
COI{CRETE
BEAM
tt:! ; "' BY L . J . M A R C O N A N D W . G . P L E W E S T E C H N I C A L P A P E R N O . 1 A 4 O F T H E D I V I S I O N O F B U I L D I N G R E S E A R C H OTTAWA M A R C H T 9 5 5ffiffi,1rfi{i:.-JuL 2S Is65
'u'rr'lli GO$lGlL . l I r r , r r r , F P R I C E 7 5 C E N T S N R C A 1 0 6 C A N , A D AT h i s p u b l i c a t i o n i s o n e o f a s e r i e s b e i n g P r o -d u c e -d b y t h e D i v i s i o n o f B u i l -d i n g R e o e a r c h o f t h e N a t i o n a l R e s e a r c h C o u n c i l a s a c o n t r i b u t i o n t o w a r d s b e t t e r b u i l d i n g i n C a n a d a . I t r n a y t h e r e f o r e b e r e p r o d u c e d , w i t h o u t a r n e n d -rnent provided only that the Division is hdvised in advance and that full and due acknowledgrnent of this original publi-c a t i o n l s a l w a y s m a d e . N o a b r i d g r n e n t o f t h i s r e p o r t m a y b e p u b l i s h e d w i t h o u t t h e w r i t t e n a u t h o r i b y o f t h e D i v i s i o n . E x t r a c t s m a y b e p u b l i s h e d f o r p u r p o s e s o f r e v i e w o n l y . P u b l i c a t i o n s o f t h e D i v i s i o n o f B u i l d i n g R e s e a r c h r n a y b e o b t a i n e d b y r n a i l i n g t h e a p p r o p r i a t e r e r n i t -t a n c e , ( a B a n k , E x p r e s s , o r P o s -t O f f i c e M o n e y O r d e r o r a c h e q u e r n a d e p a y a b l e a , t p a r i n O t t a w a , t o t h e R e c e i v e r G e n e r a I o f C a n a d a , c r e d i t N a t i o n a . l R e s e a r c h C o u n c i l ) t o t h e P u b -l i c a t i o n s S e c t i o n , D i v i s i o n o f B u i -l . d i n g R e s e a r c h , N a t i o n a -l R e s e a r c h C o u n c i l , O t t a w a . S t a r n p s a r e n o t a c c e p t a b l e . A c o u p o n s y s t e r n h a s b e e n i n t r o d u c e d t o r n a k e p a y r n e n t s f o r p u b l i c a t i o n s r e l a t i v e l y s i m p l e . C o u p o n s a r e available in denorninaiions of 5, 25, and 50 cents and rnav b e o b t a i n e d b y r n a k i n g a r e r n i t t a n c e a s i i r d i c a t e d ' a b o v e . T h e s e c o u p o n s r r r a y b e u s e d f o r t h e p u r c h a s e o f a l l N a t i o n a l R e -s e a r c h C o r r n c i l p u b l i c a t i o n -s , i n c l u d i n g -s p e c i f i c a t i o n -s o f r h e C a n a d i a r r G o v e r n r n e n t S p e c i f i c a t i o n s B o a r d .
NATIONAL RESEARCH COUNCII" CANADA
DIVISION OF BUILDING RESEARCI{
TESTS OF A lOO.FT CONTINUOUS PRESTRESSED CONCRETE BEAM by L . J . M a r c o n and W. G. Plewes
A N , q L \ ' g E D
T e c h n i c a l P a p e r N o . 1 8 4 of theDivision of Building Research
OTTAWA M a r c h 1 9 5 5
PREFACE
P r e s t r e s s e d b e a r n s u s e d i n 1 9 5 3 a s t h e r n a i n r o o f s u p p o r t f o r 2 0 0 - b y 5 0 0 - w a r e h o u s e s i n C o b o u r g , O n t a r i o , r e p r e s e n t e d a n e a r l y u s e of prestressed concrete in Canada. It was because of this that the
contract included the requirernent th.at a full-scale load test to destruction of one of the 100 ft long prestressed bearns, continuous over three supports, be rnade. The test was carried out by the Division of Building Research at the request of Central Mortgage and Housing Corporation and Defence Construction(1951)Lirnited, acting for the owners, the Departrnent of National Defence.
Although the load test of the prestressed bearn described in this report was carried out in 1953, the report of the results has not been available for public distribution. The test results rnay have lost sorne of their news value because of the increased use and rnore widespread
knowledge in the art of prestressing today, but the tests have historicaL and engineering value. Because of this the results should be rnade available for general distribution. Furtherrnore, it is thought that continuous prestressed beams over three supports of 100-ft length have seldorn tieen tested anywhere. The one tested showed that it could carry rnore than 5] tirnes the design load before failure. The study included measurements of load-carrying capacity, deflection and strains in concrete and steel under a wide range of load conditions.
The Division of Building Research is grateful to the rnany who assisted in the execution of this project. As the work progressed, the co-operation of the Research Division of the Hydro-Electric Power Cornrnission of Ontario developed to such an extent that the project was regarded as a joint venture. Throughout the work the staff of Central
Mortgage and Housing Corporation, the consulting and designing engineers, the general contractors and the Departrnent of National Defence assisted
greatly and was rnuch appreciated.
Ottawa
M a r c h 1 9 6 5
R o b e r t F . L e g g e t , D i r e c t o r
TABLE 03' CONTENTS
Page
INTRODUGTION
H i s t o r y o f t h e P r o j e c t . . . . . . ' I
D e s c r i p t i o n o f t h e W a r e h o u s e . . . I
Construction and Prestressing of the Main Beams . 2
D e s i g n a n d L o a d R e q u i r e m e n t s . . . . 3 TESTING PROCEDURE G e n e r a l 3 L o a d s . . . 3 D e f l e c t i o l l s ; . . . . 3 S t e e l S t r a i n s . . . o . 4 Concrete Strains . 4 PROPERTIES OF THE TEST SPECIMEN G e n e r a l . . . 4
C o n c r e t e D a t a . . . . 5
Modulus of Elasticity of Bearn Concrete . . . 5
S t e e 1 D a t a . . . 5
PRESTRESSING Or. THE BEAM
G e n e r a l
Deflections During Pre stre ssing
Steel Strains During Tensioning of I00-ft Tendons Concrete Strains During Tensioning of the I00-ft Wires L o s s o f P r e s t r e s s .
TEST PROGRAM AND LOADING SCHEDULE National Building Code
Asymmetric Loadings
T w e n t y - e i g h t D a y S u s t a i n e d L o a d T e s t . . . . . Ultimate Load Test
DEFLECTION BEHAVIOUR DURING TESTING
Syrnrnetrical Loadings .
Comparison of Actual and Theoretical Deflections . . . . .
D e f l e c t i o n s D u r i n g N a t i o n a t B u i l d i n g C o d e T e s t . . . . . Deflections During the Z8-day Test
Deflection of Bearn During Asyrnrnetrical Loadings
8 I I 8
6
6
6
7
7
9
1 0
l l t l 1 1CONCRTTE AND STEEL STRAIN BEHAVIOUR DURING TESTING S y m m e t r i c a l L o a d i n g s . . . . . . . o . . T h e o r e t i c a l s t r e s e € g . . . . . . . . , . . . , . . 'mmetrical Loadingo . . . , . . . . i o n a l B u i l d i n g C o d e T e s t . . . . , . . . . 2 8 - d a y T e s t . . . r . . . . g L o a d i n g . . . , . . . . o . . . .
CONCRTTE CRACKING DURING TESTING
S y m m e t r i c a l L o a d i n g s . . . . . . , . . . .
C r a c k i n g D u r i n g A s y r n m e t r i c a l L o a d i n g ... o . . . . : . . . . .
END AND CENTRE REACTIONS
Page
t z
t z
l 3r 3
l 3 I 4 l 4 l 5r 5
r 6
l 6
l 6
t 7
Symmetrical Loadings Aeymmetrical LoadingsPURLIN BRACKET TESTING
. . . a . . a . . . a a . a a . a a a a a a . a . a a . r . . a a a G R O U T T N S P E C T T O N . . . o . . . . . . CONCLUSTONS a a . a a a a a . o a a . a . a . a a .
\
MISE A L'ESSAI D'UNE POUTRE CONTINUE
t / EN BETON PRE@NTRAINT DE IOO PIEDS Par L. J. Marcon et W. G. Plewes
SOMrv[AIRE
On dGcrit dane ce raPport Ia mise i lteeeai drune poutre continue de I00 pieds (deux trav6es de 50 pieds) en forme d'I et en b€ton pr€contraint au moyen de 56 fils dtacier trbs eouplee ancr€s gelon le eyetbme Magnel-Blaton. Plus de cent Poutree prEcontraintes de ce type ont constitu6 les poutres principales pour la toiture de quatre grands d6p6ts de I'intendance militaire b Cobourg dans I'Ontario.
La charge dressai a 6t€ appliqu6e aux pointe de panne au moyen de onze v6rins hydrauliques de 50 tonnes fonctionnant contfe un cadre de r6action de pont Bailey. On donrre le d6tail des plane et de la construction de Ia poutre, Ia rn6thode dressai, tes instrurnente employ€s, Iee observations enregietr6es et on interprbte les
r6sultats obtenus. Les charges appliqu6es b la poutre 6taient: dee chargernents syrn6triques et asyrn6triques sur les deux trav€es; lressai du Code national du bdtirnent (I94I), un essai de charge b long terrne (28 jours) et une charge finale de chargement statique plus une surcharge de 5,'5.
On a 6tabti que la poutre aurait failli aous etlviron eix fois Ia charge calcul6e . La capacitG de support de charge des crochete de panne de la poutre a 6galernent €t6 d6terrnin6e au lnoyen d'essais.
TESTS OF. A IOO.FT CONTINUOUS PRESTRE SSED CONCRETE BEAM
by
+
L. J. Marcon and W. G. Plewes
SUMIIIARY
This report describes the testing of a I00-ft, continuous ( t w o 5 0 - f t s p a n s ) , r - s h a p e d c o n c r e t e beam, prestressed with 56 high-tensile steel wires anchored by the Magnel-Blaton systern. One hundred and fifty-two such prestressed beams constituted the main roof beams for four large Army ordnance warehouses at cobourg, ontario.
The test load was applied at the purlin points by eleven 50-ton hydraulic jacks operating against a Bailey bridge reaction frarne. The details of the design and construction of the bearn, the method of test, the instrurnents used, the observations recorded and an interpretation of the results are given. The loads applied to the beam were syrnrnetrical and asymmetrical loadings of both spans, the National Building Gode (f941) test, a 28-day long-terrn load test and the final load of dead load plus 5. 5 live load.
The bearn was taken to have failed under about six times the design load. The load-carrying capacity of the bearn's purlin brackets was also deterrnined by testing.
Forrnerly Research Officer, Division of Building Research, National Research Council, Canada
T E S T S O F A I O O - F T C O N T I N U O U S P R E S T R E S S E D C O N C R E T E B E A M
b y L . J . M a r c o n a n d W . G . P l e w e s
. H i s t o r y o f t h e P r o j e c t
I n 1 9 5 3 a 5 0 0 - f t - l o n g , 2 0 0 - f . t - w i d e w a r e h o u s e w a s built for
D e f e n c e C o n s t r u c t i o n ( 1 9 5 I ) L i r n i t e d at Cobourg, Ontario. The roof system involved 100 two-span continuous bearns which had originally been designed to be of ordinary reinforced concrete construction. At the suggestion of t h e c o n t r a c t o r t h e d e s i g n w a s c h a n g e d to prestressed concrete and since, u p t o t h a t t i r n e , p r e s t r e s s e d c o n c r e t e had been little used in Canada, this was sornething of an innovation. Also this conversion to so11e extent dictated the size and shape of the bearns. For these reasons the owners and their inspection representatives, Central Mortgage and Housing Corporation, asked the Division to conduct a full-scale loading test on a typical girder" This the Division undertook as a co-operative project with the Ontario Hydro. (The Research Division of Ontario Hydro had previous e x p e r i e n c e i n t e s t i n g p r e s t r e s s e d girders and were farniliar with the prob-Ierns involved in rigging, load application instrurnentation, and test pro-c e d u r e . T h i s e x p e r i e n pro-c e w a s of pro-considerable value. )
Description of the lMarehouse
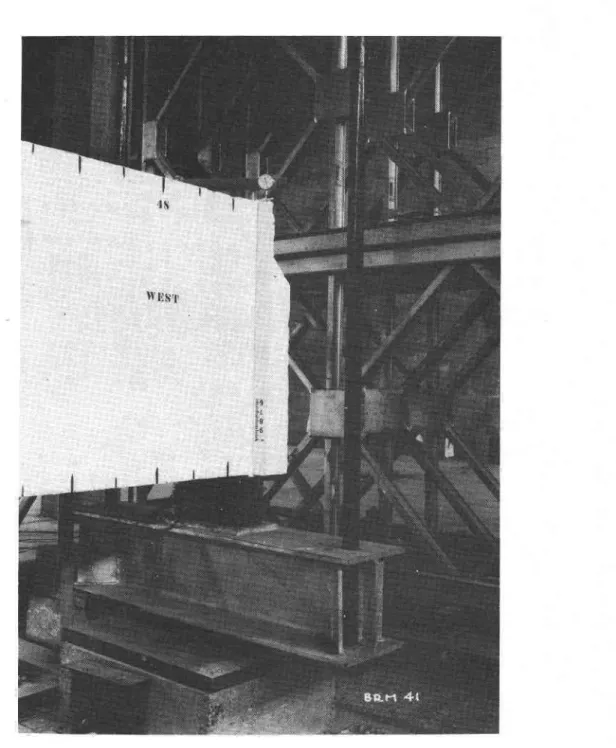
T h e w a r e h o u s e r o o f c o n s t r u c t i o n consisted of precast, prestressed, concrete girders at Zi-ft centres spanning the width of the building, and precast, reinforced concrete purlins running in the longitudinal direction. T h e g i r d e r s w e r e s u p p o r t e d on cast-in-place, r e i n f o r c e d c o n c r e t e c o l u r n n s at 50-ft centres, thus forrning four 50-ft bays across the buildi.ng width. Across the first and second, and across the third and fourth bays two 50-ft u n i t s w e r e p r e s t r e s s e d together to forrn two-span continuous bearns 100-ft l o n g .
T h e g i r d e r s h a d a n I - s h a p e d . cross-section with end blocks at t h e f r e e l y s u p p o r t e d e n d s ( F i g u r e l). Their depth was 3 ft, except for a
l0-ft length over the centre support where haunching increased the depth to 5 ft. The top and bottorn flanges were both 18 in. wide, the web I in. thick. Except on colurnn lines, purlin brackets at 8-ft 4-in. centres were provided to support 25-ft reinforced concrete purlins, which in turn carried the light-w e i g h t c o n c r e t e r o o f slabs.
On the colurnn lines, rectanguLar purlins 9 in. by 32 in. frarned into the continuous prestressed concrete bearns at the column heads. They were seated in concrete pockets forrned. by block-outs at the ends of the prestressed. girders, and to provide longitudinal rigidity negative reinforcernent projecting frorn the ends of the purlins on either side of the girder was welded together and the pocket filled with cast-in-place rnortar. e1l other purlins are sirnply
suPported on the a depth of 23 in,, 3 in. The main
z
-b e a r n -b r a c k e t s a n d w e r e o f a T : s h a p e d c r o s s - s e c t i o n w i t h a width at the top flange of 9 in., and a web thickness of section properties are listed in Table I.
Construction and Prestressing of the Main Bearns
The 50-ft units were cast at a central casting bed acjacent to the warehouses. Cable ducts were forrned by rneans of rubber cores (Figure l)' The placing of concrete and rnoving of bearns at the casting bed was done by travellin g gantry cranes. After the concrete had reached a strength of. 41 000 psi the 50-ft units were partially stressed while still on the casting bed by rneans of eight straight wires (lowest dotted line in the longitudinal section, Figure 1), each being 0.276 in. in diarneter. This partial prestressing was sufficient to overcorne the dead weight, handling and erection stresses.
B e f o r e e r e c t i o n , t w o 2 4 - w i r e c a b l e s 1 0 0 f t l o n g w e r e i n s e r t e d i n the longitudinal ducts in one of the 50-ft bearns. The 50-ft lengths of cable protruding frorn the ducts at the haunched end were looped back and placed on top of the bearn. After a pair of 50-ft units had been lifted to the top of the colurnns, with their haunched ends rneeting over one column, the 4-in. gap between the haunched ends was partially grouted in with a high-strength, quick-setting expanding grout, leaving a U-shaped gap to forrn a duct for the prestressing wires. This duct was continuous with sirnilar U-shaped slots in the ends of the 50-ft bearn sections.
AJter setting of the grout, the cables on top of the one bearn were doubled back and inserted in the vertical slot in the haunch of the other bearn and pulled through the appropriate duct. The bearn was then ready to be tensioned. When the concrete had reached its specified 5000-psi strength, the cables were tensioned in pairs frorn one end and anchored by the Magnel-Blaton systern. The required tension in the wires was checked by a
pressure gauge on the jack and by rneasuring the elongation of the wires. To obtain in each cross-section the desired line of action of the prestressing force the lower 100-ft cable was raised at the centre suppbrt. Four l -in. diarneter pins were placed through the web of the beam to hold the cable in this deflected position (Figure 1).
The cable ducts, which extend to the top of the bearn near the centre, were then filled by gravity flow with a liquid grout to protect the wires frorn corrosion and to obtain bond between the wires and the bearn. Initially a sand cernent grout containing about l cuft of cernent, l cuft of
sand and 5 gal of water was used; but it was unsatisfactory because it did not always fill the full length of the ducts by gravity, probably as a result of sand particles in the ducts. The rernaining spaces were later filled by pressure grouting with a liquid grout without sand.
In subsequent bearns a water-cernent grout proved satisfactory. T h e m i x t u r e w a s 5 b a g s o f c e m e n t t o Z 7 g a l o f w a t e r . F o r t h e c o r n p l e t e
3
-g r o u t i n -g o f t h e 1 0 0 - f t . b e a m about 30 ba-gs of cement were required. I n s p e c t i o n h o l e s w e r e provided arong the cable ducts both to check grouting and to act as air vents.
D e s i g n a n d L o a d Requirements
T h e b e a m s w e r e d e s i g n e d to carry a roof life load of. 4O lb/sq tt. T h e l i v e l o a d p e r purlin amounts to 8, 320 lb, and the dead load of the roof s t r u c t u r e p e r p u r l i n i s ? , 2 8 0 l b . T h e 1 0 0 - f t m a i n girders weigh approx_ i m a t e l y 2 6 t o n s e a c h ( T a b l e II).
TESTING PROCEDURE G e n e r a l
In view of the fact that the test beam was rnade under normal field conditions and not under conditions that could be called ncontrolledrl f r o m a r e s e a r c h point of view, it was not considered that the project warranted the extensive instrurnentation required for a co*pllt. strain
i n v e s t i g a t i o n . A l i m i t e d n u m b e r o f strain nleasurements were, however, rnade the beam consiste.d of hydraulic jacks b r i d g e u n i t 6 ( F i g u r e Z ) . The metirod )eam and the reaction beam is shown rpport was fixed, whereas both end s u p p o r t s w e r e o n s t e e l r o l l e r s .
L o a d s
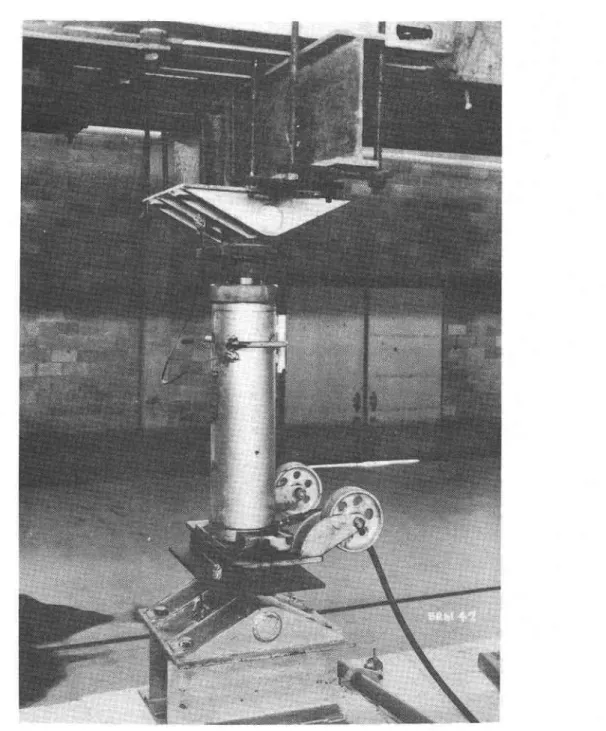
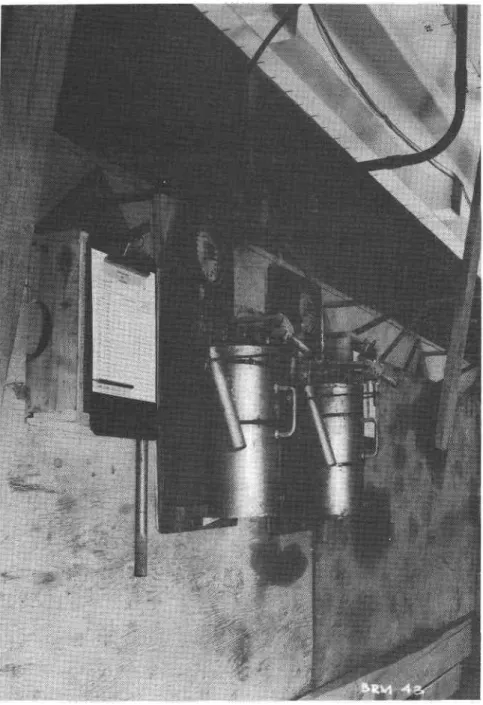
T e s t l o a d s w e r e applied by means of eleven 50-ton hydraulic jacks w i t h c a p a c i t i e s approximately 75 per cent greater than the estimated required c a p a c i t y a t f a i l u r e . The chosen type of jack has a lock-nut arrangement that w a s h e l p f u l f o r applying sustained loads (Figure 3). All pump units were e q u i p p e d w i t h p r e s s u r e gauges calibrated aglinst jack toaa in a testing
m a c h i n e ( F i g u r e 5). Load cells using electrical resistance strain gauges wef e p l a c e d u n d e r the ends and centre of the beam to measure the reactions a n d t o s e r v e a s a check of the over -all applied load. The load cells also were c a l i b r a t e d b e f o r e the test (Figure 4).
F u l l - s c a l e r e a d i n g on the oil pressure gauges on the pumps was 1 0 , 0 0 0 p s i , a n d difficulty wa1 experienced in applying small loads as low a s 4 , 0 0 0 l b p e r j a c k t* oll because of the ...ury low pressures to be used on t h e l a r g e j a c k s . v e r y g o o d a g r e e m e n t between the jack loads and the re-actions was, however' obtained at loads equal to and greater than DL + LL. Deflections
Deflections were reco_rded at- each purlin point and at both ends, t h u s g i v i n g a total of I3 points (Figure 6); thiee methods of measuring d e f l e c t i o n . w e r e used.
. 4
-The smaller deflections of the beam under relatively light loads w e r e m e a s u r e d b y d i a l i n d i c a t o r s r e a d i n g t o 0 . 0 0 1 i n . a n d w i t h a r a n g e o f
I i n . G a u g e b l o c k s w e r e u s e d t o e x t e n d t h e r a n g e o f i n d i c a t o r s .
Very fine wires attached to the under side of the beam and passed over a system of pulleys to a system of weights and a marking board at a central location provided a means for measuring the larger deflections under higher loads. This method has important advantages in that any progressive
deflection under load can be detected immediately and remote measurernent i s p o s s i b l e .
Further deflection readings to measure ar.y settlement were made with a precise optical levelling instrument at the ends and centre support of t h e b e a m . T o c h e c k a n y p o s s i b l e l a t e r a l r o t a t i o n , d i a l g a u g e s w e r e p l a c e d at the outer edges of the flanges at the ends and centre of the girder. In addition, two spirit levels were placed at the mid-span locations to indicate tipping. S t e e l S t r a i n s
S t r a i n s i n t h e p r e s t r e s s i n g w i r e s w e r e m e a s u r e d b y e l e c t r i c a l resistance strain gauges. In order to minimize the danger of damaging the gauges as the cable was drawn through the ducts, it was decided to place them a shgrt distance from one end. The wires on which gauges were I o c a t e d a r e s h o w n i n F i g u r e 7 .
C o n c r e t e S t r a i n s
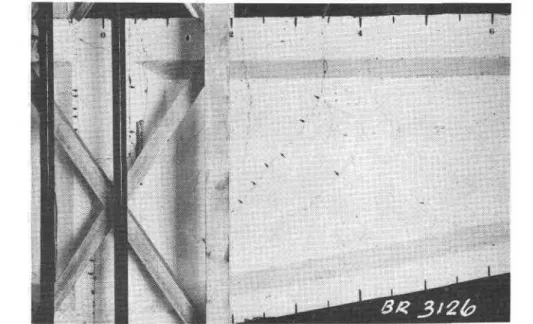
D u r i n g c a s t i n g , m o r e c o n c r e t e t e s t c y l i n d e r s w e r e t a k e n f r o m span B than frorn span A, so that it was decided to take the majority of the strain readings on this half of the beam. Strains in the concrete were m e a s u r e d b y e l e c t r i c a l r e s i s t a n c e s t r a i n g a u g e s , and, as a check on the s t r a i n r e a d i n g s , b y a n 8 - i n . m e c h a n i c a l e x t e n s o m e t e r s t r a d d l i n g t h e g a u g e points (Metzger gauge). The positions of the gauges are shown in Figure 6"
PROPERTIES OF THE TEST SPECIMEN
G e n e r a l
The two 50-ft units that made up the 100-ft continuous test beam w e r e c a s t a n d t e n s i o n e d o n t h e f o l l o w i n g d a t e s :
r 6
z
r 6
zr
l lz 5
3 0 6 F e b r u a r y 1953 M a r c h 1 9 5 3 M a r c h 1 9 5 3 M a r c h 1 9 5 3 M a y 1 9 5 3 M a y 1 9 5 3 J u n e 1 9 5 3 A u g u s t 1 9 5 3 Span B castSpan B initially tensioned Span A cast
Span A initially tensioned
First atternpt at final prestressing Final tensioning of beam completed Beginning of test period
5
-C o n c r e t e D a t a
The concrete rnix contained four bags of high early-strength
c e r n e n t , 5 9 Z L b o f s a n d a n d 9 Z B l b o f g r a v e l , o r a w e i g h t r a t i o o f l : 1 . 6 7 2 ? . 6 5 .
The average slump was 1.8 in. specifications reguired a rninirnum
c o r n p r e s s i v e s t r e n g t h o f 5 , 0 0 0 p s i a t s e v e n d a y s . A t t h e tirne of test the cylinder strengths were:
Span A Span B
The concrete than that in span A, but
Age of Cylinders at S t a r t o f B e a r n T e s t s
1 0 6
r 3 4
in span B had a slightly the average strength for
Cornpre s sive Strength 6 , 7 0 0 p s i 7 , 2 0 0 p s i
higher cornpressive strength b o t h s p a n s w a s 7 , 0 0 0 p s i .
Modulus of Elasticity of Bearn Concrete
The conversion of the concrete strain data to equivalent stresses requires a knowledge of the value of the rnodulus of elasticity of the concrete. This value is not constant, but varies depending on several factors, chiefly the rnagnitude and sign of the stress , a1e of concrete, and previous loading
history of the concrete. A series of colnpression cylinders and concrete
core sarnples taken frorn the bearn were tested under different loads. Three concrete cylinders tested at the conclusion of the bearn test gave an average E " o f 5 . 4 x 1 0 6 p s i . C o n c r e t e c o r e s a r n p l e s ( 2 . 8 i n . i n d i a r n e t e r , 5 . 6 i n . high, ^gg Ll rnonths) taken frorn a section of span B gave an average E. of 5 . 0 x l 0 b p s i . F r o r n t h i s e v i d e n c e 5 . ? x 7 O 6 p " i w a s taken as a representative value.
Steel Data
The specifications for the prestressing wire were as follows:
( i ) m i n i r n u r n y i e l d strength (0. Z per cent offset) 160,000 psi, (ii) rninirnurn ultirnate tensile strength ZI5,0O0 psi, and, ( i i i ) w o r k i n g s t r e s s e s not to exceed 128, 000 psi,
The wire actually used for construction exceeded these minirnum
reqrirernents. The actual 0.,2 per cent yield strength was in the neighbourhood
of 203,500 psi and the ultirnate strength approxirnately z?9,40o psi. The
rnodulus of elasticity was obtained by testing eight specirnens of wire. Both
electrical resistance strain gauges and the autornatic strain recorder on the
testing rnachine were used to obtain the strains. Both systerns gave an
6 -PRESTRESSING OF' TFIE BEAM General
No strain and deflection rneasurernents could be rnade during the initial partial prestressing of the 50-ft units because the bearns were received for testing after this operation had been cornpleted. It was reported that the tensioning of the lower eight 50-ft wires required an elongation of 3 in. and that the average slip occurring during the wedging operation was I e in.
The bearn was ready for cornplete tensioning of the 100-ft wires on ll May. Upon tensioning the wires, however, it was found that abnorrnally high pressures were necessary to obtain the required 6-in. elongation. The condition becarne so serious that it was decided to replace cornpletely the 100-ft cables. The cause of the irregularity was probably the twisting of the cable in the ducts. The test bearn, apparently, was the only one of the
152 bearns tensioned that showed such an irregularity. A new pair of cables was insgrted and new electrical resistance gauges had to be installed.
On 25 May the new wires were tensioned without difficulty; I'igure 7 shows the sequence in whichthis was done. The sarne daythe
lower cable was raised by a jack and sling arrarlgerrlent and the location pins w e r e i n s e r t e d .
Defle ctigns During Pre strej sigg
The .upward deflections of the bearn during tensioning are shown in Figure 8; the rnaxirnurn recorded is 0. 15 in.
During the tensioning operation span A always showed a greater upward deflection than span B. As the stressing was done frorn the free end of span A, this condition was probably caused by the loss of prestress due to friction along the cable duct that resulted in a srnaller prestressing force in span B. The differdnce in deflection could also be attributed to difference in age, because span B was the older span. During prestressing there was very little movernent at the ends and centre support, which lifted about 0.004 in. The carnber behaviour ivith tirne could only be followed for one day, because erection of Bailey test structure rnade the rernoval of the dial gauges irnperative. Figure 9 shows the tirne deflection curve for two sirnilar points on the beams.
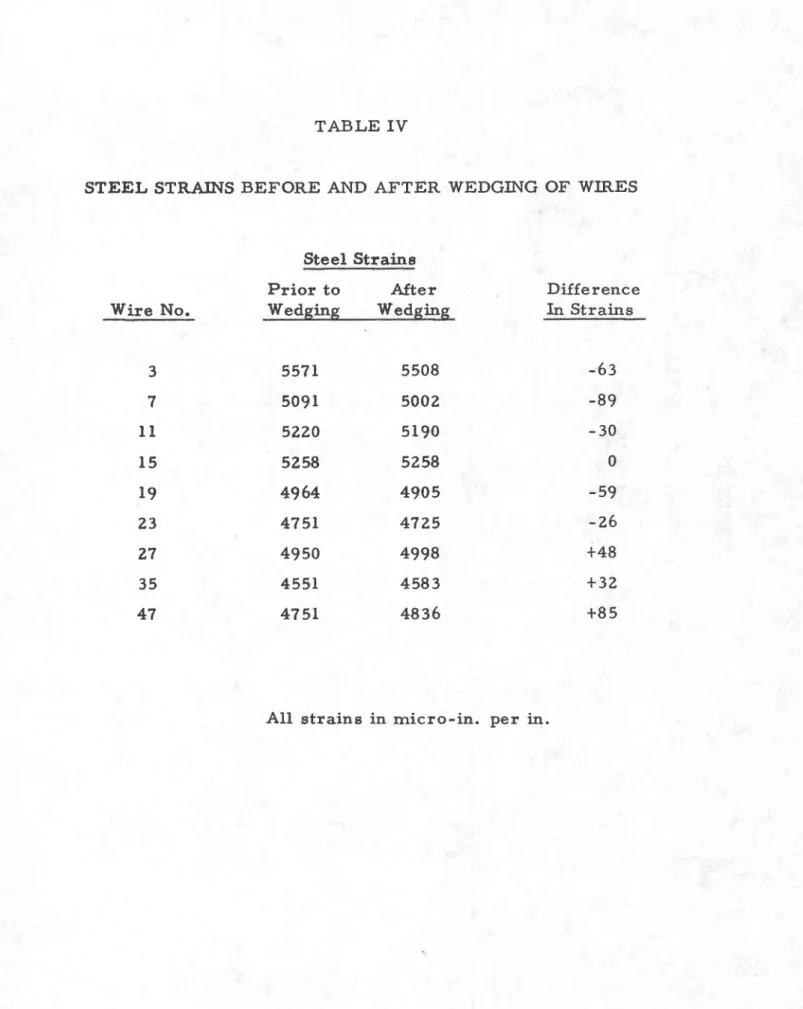
SteeL Strains During Tensioning of lQ0-ft Tendons
During tensioning of the 100-ft wire tendons the difference in their elongations before and after wedging was rneasured with a steel rule. The results are shown in Table III. The slip varied frorn t/t6 to t/Z in., with an average of l/8 in. Sirnilarly, strains in the wires carrying electric resistance gauges were recorded before and after wedging and the results are tabulated,.n Table IV.
7
-In addition, readings were taken on all gauged wires after each sandwich plate or eight wires had been cornpletely tensioned. The adjustrnent of steel tension among the wires can be seen in Table V.
Strains in the wires during the first 4f days are also shown in Figure 10, which indicates the effects of lifting of cables, as well. Eight of the eleven gauged wires were tensioned higher than the 128,000 psi
stipulated in the specifications. The rnaximunr stress recorded was 156,000 psi, o r 7 ? I . 5 p e r c e n t g r e a t e r t h a n 1 2 8 , 0 0 0 p s i . T h i s rnaximurn stress is 77 per cent of the average lneasured yield strength of. ?03,000 psi, and 68 per cent of the average ultirnate tensile strength ot 229,400 psi. The average steel s t r a i n a f t e r f i n a l p r e s t r e s s i n g w a s 5 , 0 0 0 r n i c r o - i n . p e r in., or 139r 000 psi. T h i s a v e r a g e m e a s u r e d s t r e s s o f 1 3 9 , 0 0 0 p s i is 68.5 per cent of the yield point stress and 60.7 per cent of the ultirnate tensile stress.
Unfortunately, the grouting of the cable ducts made the gauges unstable for a period of two weeks and it was not possible to follow directly the loss of stress in the steel following prestressing. After a two-week period the gauges again stabilized and new zeros were taken before the load test prograrr!.
Concrete Strains During Tensioning of the 100-ft Wires
Concrete strain readings were taken before, during, and after the tensioning of the 100-ft wires. The concrete strain history of the beam is shown in graphical forrn in Figure 11. Because of temporary rnalfunction of the electric resistance gauge instrurnentation at this stage only the rnechanical extensometer readings were used.
The strain patterns for the sarne sections of spans A and B (28-ft rnark) are very sirnilar and serve as a good check on the readings.
The bottorn row of strain diagrarns in Figure I I also shows theoretical strains obtained using an E. of 5. z x 106 psi. The rargest variation occurred at the l0-ft 10-in. section.
The dotted Line, C, in Figure lt is the total of the theoretical design figures for the dead weight of the bearn and 100 per cent prestress of the eight 50-ft wires, plus the rneasured strains due to prestressing of the forty-eight 100-ft wires. This last total will be used for the discussion of the final strain conditions in this report.
L o s s o f P r e s t r e s s
Frorn the day of prestressing to the day of the first load application (37 days) the average concrete cornpression strain increase in the top and bottom flange was l1? rnicro-in. per in. This increase in strain from creep and shrinkage represents a loss of. 2.3 per cent of the average steel wire strain of 5,000 micro-in. per in. at the tirne of firlal prestressing.
8
-The total average increase in concrete strains up to the final d a y o f t e s t i n g w a s 1 6 6 r n i c r o - i n . p e r i n . , w h i c h r e p r e s e n t s a l o s s o f 3 ' 3 per cent of the initial steel wire strain. This increase in strain is due to
continuing shrinkage and creep plus the residual plastic flow of the bearn produced by the ?8-day test.
TEST PROGRAM AND LOADING SCHEDULE
In order to study the behaviour of the bearn under various loading conditions the loading progranr in Table VI was carried out. In this report dead load (DL) always represents the weight,of the roof structure, exclardinE
at is, the weight of lhe Pu{lins, igof-slabs ""d t""fi"g t-at"rtal* Lnstrurnent readings were taken before and after the application of all load incrernents.
Natiogel Building Code
As there were no provisions in the National Building Code (1941 edition) for tests on prestressed concrete structures, the criteria for loading tests on reinforced concrete bearns were used. The Code specified that a load equal to dead load plus t| tive load be left on the bearn for 24 hours a"nd that the bearn have at least a'15 per cent deflection recovery in the ?4-}:oru.r period following rernoval of the load. Deflection, and steel and concrete
strain readings were taken at regular intervals during and after load was applied.
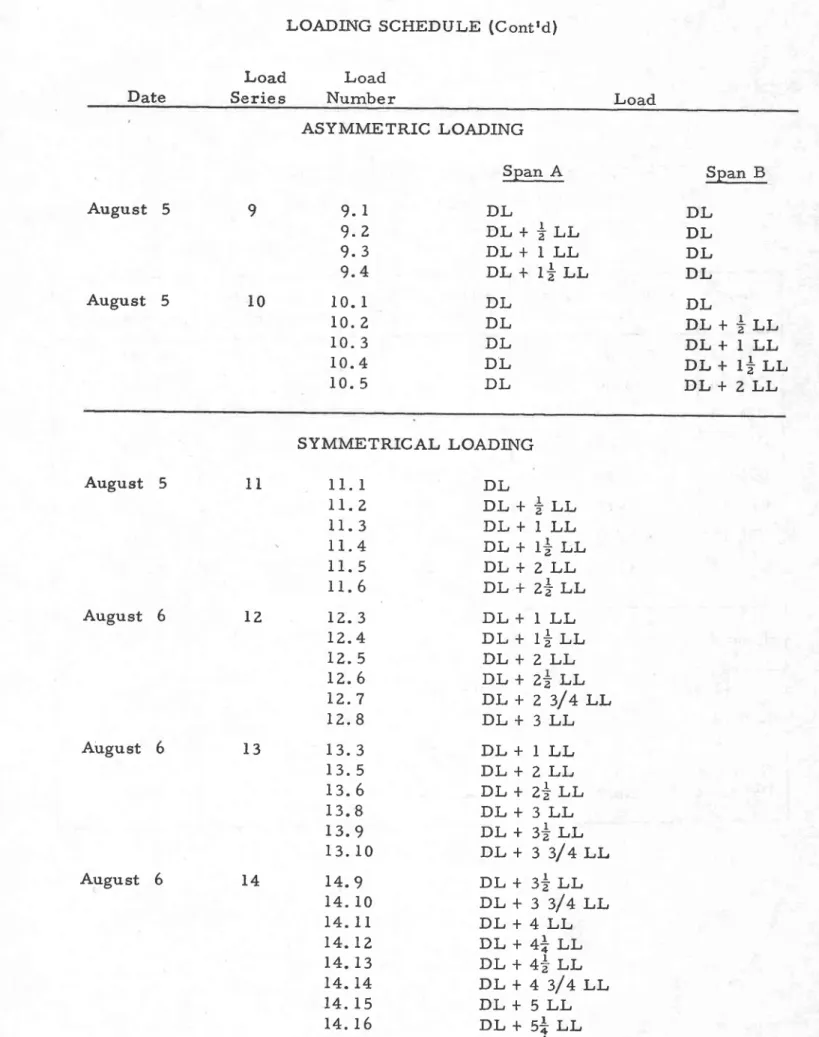
Asyrnrnetric Loadings
It was the purpose of this test to check the behaviour of the bearn under various cornbinations of asyrnrnetrical loading, and it served also as an additional rneans of cornparing the behaviour of each individual span under load. The first series of asyrnrnetrical loadings were increased to an
unbalanced load of DL + l LL only so as not to cause any permanent darnage to the bearn. In the second series of asyrnrnetric loadings the load was increased to DL + ZLL which resulted in cracking of concrete.
Twenty-eight Dav Sustained Load Test
The purpose of this test was to check the creep of the bearn under long-terrn loading. A load of DL + l+LL was used. Strains and deflections were read at regular intervals during the 28-day test and for several days
after the rernoval of load.
Ultirnate Load Test
In the ultirnate load test the bearn was subjected to a load of DL + SLI-[ without cornplete failure. At this point one of the jacks becarne
9
-displaced because of a broken shackle bolt. This displaced the entire test get-up. The bearn sprang back and regained its original position, again without corrplete failure. The slipping of the jack actually subjected the bearn to a severe irnpact test, for it resulted in the alrnost instantaneous
unloading frorn DL + St t-t-. There was no serious structural failure apparent, although cracks appeared in the top flange at mid-span. These cracks were probably the result of the upward springing of the bearn.
After consideration of all factors it was decided not to rearrange the entire test set-up for the purpose of breaking the darnaged bearn. Tests were conducted on the strength of the purlin seats before the bearn was finally broken up and rernoved.
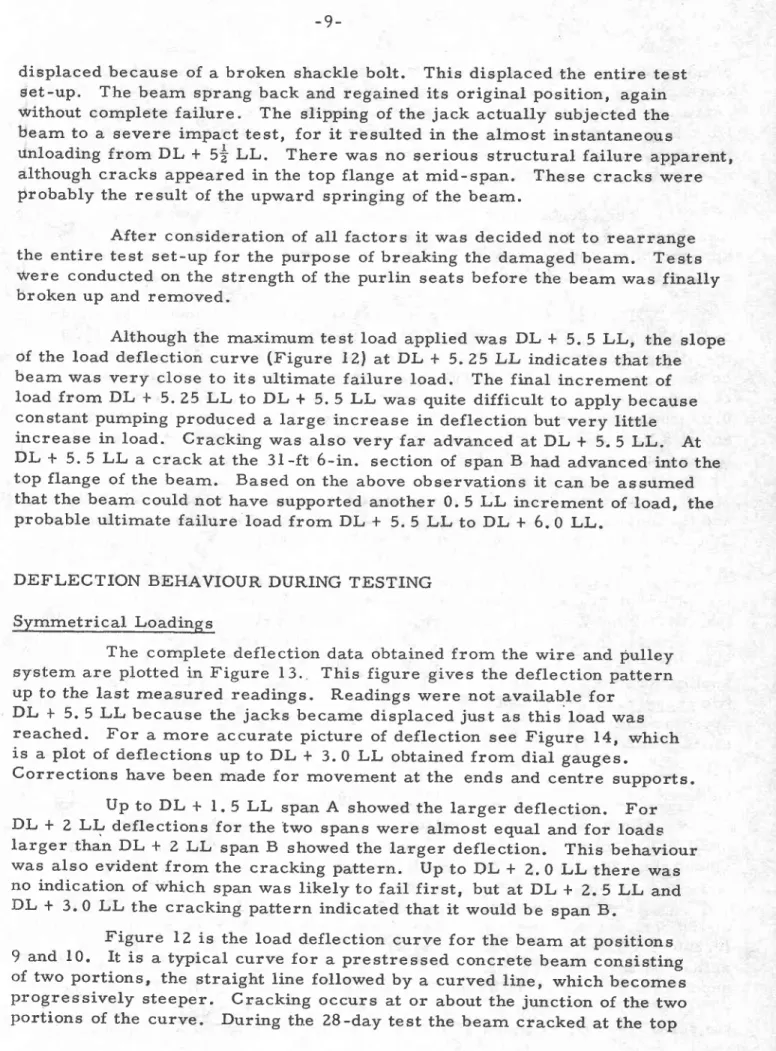
Although the rnaximurn test load applied was DL + 5. 5 LL, the slope of the load deflection curve (Figure 7Zl at DL + 5.25 LL indicates tlnat the bearn was very close to its ultirnate failure load. The final incrernent of load frorn DL + 5.25 LL to DL + 5.5 LL was quite difficult to apply because constant purnping produced a large increase in deflection but very little increase in load. Cracking was also very far advanced at DL + 5.5 LL. At DL + 5.5 LL a crack at the 3l-tt 6-in. section of span B had advanced into the top flange of the bearn. Based on the above observations it can be assurned that the bearn could not have supported another 0.5 LL incrernent of load, the probable ultirnate failure load frorn DL + 5. 5 LL to DL + 6.0 LL.
DEF'LECTION BEHAVIOUR DURING TESTING
Svmrnetrical Loadings
The cornplete deflection data obtained frorn the wire and pulley systern are plotted in Figure 13. This figure gives the deflection pattern up to the last rneasured readings. Readings were not available for
D L + 5 . 5 L L b e c a u s e t h e j a c k s b e c a r n e displaced just as this load was reached. For a rnore accurate picture of deflection see Figure 14, which is a plot of deflections up to DL + 3.0 LL obtained frorn dial gauges.
Corrections have been rnade for rnovernent at the ends and centre supports. up to DL + l. 5 LL span A showed the larger deflection. For DL + Z LL deflections for the two spans were almost equal and for loads larger than DL + Z LL span B showed the larger deflection. This behaviour w a s a l s o e v i d e n t f r o r n t h e c r a c k i n g p a t t e r n . U p t o D L + ? . 0 L L t h e r e w a s no indication of which span was likelyto fail first, but at DL + 2.5 LL and, DL + 3.0 LL the cracking pattern indicated that it wourd be span B.
Figure 12 is the load deflection curve for the bearn at positions 9 and 10. It is a typical curve for a prestressed. concrete bearn consisting of two portions, the straight line followed by a curved line, which becornes progressively steeper. Cracking occurs at or about the junction of the two portions of the curve. During th.e 28-day test the bearn cracked at the top
_ t 0
-of the centre support under a load -of DL + t+LL. This crack opened up
on reapplying DL + 1LL. The straight line portion of the curve starts to
c u r v e i n t h e D L + 1 . 0 t o 1 . 5 L L r a n g e . T h e s t e e p s l o p e o f t h e c u r v e a t
DL + 5.25LL indicates that the bearn was near its ultirnate load. The
r n a x i r n u m d e f l e c t i o n r e c o r d e d f o r D L + 5 . Z 5 L L w a s 3 . 2 9 i n . a t g a u g e l 0 o n s p a n B . ( i . e . a b o u t 1 / 1 8 0 )
The arnount of rnovernent at the ends and centre support was
rneasured by dial gauges. The centre support always settled during
a p p l i c a t i o n o f l o a d b y , a b o u t 0 . 2 0 i n f o r l o a d s u p t o D L + 3 L L , i n c r e a s i n g
t o 0 . 3 4 i n . a t D L + 4 i L L .
The end of span A had a downward rnovernent of about 0.06 i4. .tp
to DL + 3.0 LL and then started to lift with increasing load. At DL + 3+LL
the lifting had increased to 0.76 irr. and had to be corrected by adjusting the nuts
on the tie rods. With increased loading the upward deflection rernained at
about 0.30 in. The end of span B had a constant upward deflection of about
0 . 0 3 i n . u p t o D L + ? , L L , i n c r e a s e d t o 0 . 0 9 i n . f o r l o a d s u p t o D L + 4 L L , and at a load of DL + 4+LL increased to 0.30 in. and remained there until the end of test.
The deflection readings obtained frorn the wire and pulley system
and the dial gauge systern agreed quite closely, the rnaxifirurrr variation being
5 per cent, with rnost readings closer to 2 per cent.
The deflections of the bearn for the sarne load increased after
the bearn had cracked. This is clearly shown in Figure 15. For loads less
than DL the curves are actually reversed, but this is probably due to
inaccuracies in applying the low loads resulting frorn ternperature and
hurnidity effects. The increase in deflection with the nurnber of load
applications becornes obvious for loads greater than DL + 1LL. For the
two gauge positions shown on the graph, the increase in deflection is
a p p r o x i r n a t e l y 0 . 0 3 i n . f o r l o a d s u p t o D L + Z L y L L a n d i n c r e a s e s t o 0 . 1 0 i n .
at DL + 3+ LL.
Cornparison of Actual and Theoretical Deflections
, In Figure 16 the calculated and rneasured deflections for a load
of DL + l LL have been plotted" The values were obtained frorn the design
c a l c u l a t i o n s f o r 1 0 0 p e r c e n t a n d B 5 p e r c e n t p r e s t r e s s .
The rnaxirnurn calculated deflection at t]ne 3Z-ft mark (0. 155 in.) at 100 per cent prestress was 75 per cent of the actual rneasured deflection (0. 206 in. ) (average of spans A and B) and 84 per cent for the calculated d e f l e c t i o n a t B 5 p e r c e n t p r e s t r e s s ( 0 . 1 7 3 i n . ) . S e v e n f t f r o m t h e c e n t r e s u p p o r t t h e c a l c u l a t e d d e f l e c t i o n a t 1 0 0 p e r c e n t p r e s t r e s s ( 0 . 0 0 5 i n . ) w a s 2 0 p e r c e n t o f t h e a c t u a l r n e a s u r e d d e f l e c t i o n ( 0 . 0 2 5 i n . ) a n d 3 2 p e r c e n t o f t h e c a l c u l a t e d d e f l e c t i o n s a t 8 5 p e r c e n t p r e s t r e s s ( 0 . 0 0 8 i n . ) . T h e s e
11
-'differences
appear to be due to an overestirnate of the stiffness of the haunched section.
Deflections During National Building Gode Test
The deflections of two identical points on spans A and B are plctted in Figure 1? for the National Building Code test. IrreguLarities in the deflection curve are due to stress redistributions in the steel cables and the effect of changing ternperature and hurnidity. The increase in deflection during ttre } -hour load period was l? per cent for span A and 9 per cent for span B. The irnmediate deflection recovery for span A on removing load w a s 8 8 . 8 p e r c e n t a n d i n c r e a s e d t o 9 3 p e r c e n t i n 1 . 5 h o u r s ; t h e r e s p e c t i v e percentages for span B are 93.5 and 98. 5 per cent. The bearn, therefore, passed the required rninirnum deflection recovery of 75 pet cent.
Deflections During the 28-dav Test
The deflection history of gauges 9 and 10 on sPan B during the 28-day test is shown in Figures 18 and 19.
The irregularities in the deflection curve are the result of ternperature and hurnidity changes at the test site, strain redistributions in the bearn, and the adjusting of the hydraulic jack pressures due to creep in the beam. The instantaneous deflection upon applying DL + 1| t L was
0.258 in. and increased to 0.384 in. or 49 per cent in 28 days. The irnmediatd deflection on rernoving load was 0. 128 in. or a recovery of.66.6 per cent. During the 5-day recovery period the deflection decreased to 0. 095 in. giving a total recovery of. 75.2 pet cent. Sirnilar deflection patterns were obtained for all other deflection gauges. The tirne and sequence of rise and fall in the curve are the sarne as those of the concrete strains during t}:.e 28-day test (Figures Z0 - 231.
Deflection of Bearn During Asvrnrnetrical Loadings
The deflections of the bearn under asyrnrnetrical loadings are pJ-otted in Figure 24. The graph shows that the deflection behaviour of the two spans was very sirnilar. Deflections of the bearn under asyrnrnetrical Loadings,of DL and DL + I LL are alrnost exactly the sarne. The rnaxirnurn difference occurred in the span loaded with DL during the asyrnrnetrical loadings of DL and DL + f . 5 LL. This difference rnay be due to difficulty in stabilizingtll.e hydraulic jacks as a result of uplift of the span.
During the asymrnetrical loading of DL and DL + 2,.O LL the rnaxirnurn downward and upward deflections were 0.511 and 0. I76 in.,
respectively. The rnaxirnurn deflection under a syrnrnetrical load of D L + 2 . O L L w a s 0 . 3 3 0 i n .
_ t 7 , _
CONCRETE AND STEEL STRAIN BEHAVIOUR DURING TESTING
Syrnrnetrical Loading s
The concrete strains recorded during t}re syrnrnetrical loadings are plotted in Figure 25. These values represent averages of all readings obtained frorn the particular points.
Strain diagrarns at the 10-ft l0-in. section and 39-ft eection are plotted up to DL + Zt t'l- and DL + 4LL, respectively. Readings were discontinued at this point because strains had exceeded the range of the rnechanical extensorneter. The incrernents in concrete strain at the 10-ft
l0-in. section are quite srnall because of small bending rnornent atthat section near the point of inflection.
The strain diagrarns at the Z8-ft section of span B (4 ft from location of rnaxirnurn bending rnolnent in span) show the effect of cracking. AtDL + 2LL the lower flange had a compressive strain of l0 rnicro-in./tr,. At DL + Z+ LL the bearn had cracked at this location and gave an extrernely large strain teading as shown. Sirnilar behaviour was recorded at the Z9-ft
section of span A.
At the I -ft 6-in section the cracking occurred at DL + 3. 0 LL, a loading condition at which (according to the strain diagrarn, Figure 1l) there should sti1l be conrpression in the extrerne top fibre" The reason for this discrepancy is probably the rnagnitude of calculated stress due to prestressing of the eight 50-ft wires. Theory assurned uniforrn stress across the l-ft 6-in. section, which was only I ft 4 in. frorn the end
anchorages of the 50-ft wires. To rnake the strain diagrarn agtee with the tensile strain in the top fibre that rnust have been present to produce cracking, the cornpressive strain in the top flange (dotted line) would have to be
r e d u c e d c o n s i d e r a b l y s o t h a t D L + 3 . 0 L L c r e a t e s t e n s i o n .
A11 strain diagrarns up to a load of DL + 2.0 LL were in cornpression, DL + 2.5 LL being the first load to produce tension at the two 28-ft sestions. A cornparison of strains rneasured by extensorneter and electrical resistance
strain gauges is rnade in Figure 26. T h e o r e t i c a l S t r e s s e s
T h e t h e o r e t i c a l s t r e s s e s o f t h e b e a r n f o r v a r i o u s l o a d c o n d i t i o n s a r e p l o t t e d i n F i g u r e ? 3 . D u e t o t h e s r n a l l l o s s i n p r e s t r e s s ( 2 . 3 p e r c e n t ) the theoretical stress diagrarns with 100 per cent prestress should be used for comparison with rneasured strains. As the initial concrete strains in the bearn were unknown, the best means of cornparison is the strain and stress diagrarns due to DL + I LL (Figures 25 and 271. This cornparison again leads to the difficult problern of the rnodulus of elasticity of concrete. The E. necessary to rnake theoretical stresses agree with the experirnental
1 3
-s t r a i n -s v a r i e -s f r o r n 9 . 0 t o 3 . 8 x 1 0 6 p -s i , w i t h a n a v e r a g e E " o f 6 . 3 x 1 0 6 p -s i . This degree of variation rnakes difficult an accurate cornparison of stresses and strains.
C on cr ete Str ain s Due t o jls vrnrnetric al _Lo ading s
In Figures 28 and 29 th.e concrete strains due to asyrnrnetrical
loadings are plotted. In Figure 28 t}re concrete strains of span B loaded with constant DL are shown for DL plus various incrernents of LL on span A. In Figure 29 the concrete strains frorn span B loaded with DL plus incrernents
of. LL (with DL only on sparl A) are plotted.
In the span loaded with DL plus incrernents of LL the first crack due to asyrnrnetrical loading occurred at DL + Z LL at the 28-ft section of
span B, as is shown in the strain diagrarn. A syrnrnetrical load of DL + 2.5 LL later reopened this crack. As expected, the asyrnrnetrical loading produced larger concrete strains than the equivalent syrnrnetrical loadings at t}:.e 39-and
28-ft sections. At the Z8-ft section the asyrnrnetrical loading up to DL + 2.0 LL produced a change in cornpressive strain of.32O rnicro-in./ir, . in the top fibre, whereas the change due to the syrnrnetrical loading of DL + 2.0 LL was
?L5 rnicro-in./in. At the l-ft 6-in. section the change in concrete tensile s t r a i n d u e t o D L + Z . O L L w a s 2 3 5 a n d 1 9 0 r n i c r o - i n . / i n . , r e s p e c t i v e l y , for syrnrnetrical and asyrnrnetrical loadings.
In the span with a constant load of DL no cracks were observed. The larger changes in strain in this span occurred at the 10-ft l0-in. section, which under syrnrnetrical loading was the location of the Least concrete strain c h a n g e s . T h e c o n c r e t e s t r a i n c h a n g e s , A , a t t h e 1 - f t 6 - i n . a n d l 0 - f t I 0 - i n . sections increased with loading on the opposite span, whereas the concrete strains at the 28- and 39-ft sections decreased. The concrete strain changes due to increasing load at t}re 39-ft section were too srnall and irregular to pick up with the strain gauges. A11 strain diagrarns A and B in the dead load
span were coffrpressive at the rnaxirnurn recorded asyrnrnetrical loading of D L a n d D L + l . 5 L L .
Concrete Strains During National Building Code Test
The tirne-strain curves obtained for the National Building Code test follow a pattern sirnilar to the tirne-deflection curve shown in Figure l?.
The avepage increase in concrete strain after application of the full load was 12.5 per cent whereas the average increase in deflection was l3 per cent The arnount of concrete strain recovery was sirnilar to the deflection behaviour.
Concrete Strains During the 28-dav Test
For the 28-day test, only the rnechanical extensorneter readings were used in order to avoid possible zero drift with tirne in electrical
t 4
-Typical histories of the concrete strains during the 28-day
test are shown in Figures Z0 - ?3. The figures present strains at the 28- and 1-ft 6-in. sections of span B, the sections closest to the rnaxirnurn positive a n d n e g a t i v e b e n d i n g r n o r n e n t s . S t r a i n g a u g e s C M 3 , 4 , I 1 a n d l Z a r e i n r e g i o n s o f i n c r e a s i n g c o r n p r e s s i o n w i t h l o a d , w h e r e a s C M 5 , 6 r 9 a n d l 0 a r e in regions of decornpression with load. Table Vl[ shows the percentage changee in concrete strains during and after the 28-day test. The concrete stresses calculated frorr: the strain diagrarns in Figure ?5 are 'also tabulated. T h e s t r e s s e s a t C M 9 a n d G M l 0 a r e p r o b a b l y r n u c h c l o s e r t o z e r o s t r e s s , as explained previously.
The cornparison of strain and deflection percentage changes in T a b l e V I I s h o w s t h a t s t r a i n g a u g e s C M 3 , 4 , 1 1 a n d l 2 r e p r e s e n t t h e d e f l e c t i o n b e h a v i o u r m o r e c l o s e l y t h a n t h o s e a t C M 5 r 6 , 9 a n d 1 0 . T h e r e a s o n f o r t h i s b e h a v i o u r w a s p r o b a b l y t h e h i g h e r s t r e s s e s a t C M 3 1 4 , l l a n d 1 2 , w h i c h i n t u r n w o u l d s h o w l a r g e r c h a n g e s . T h e s t r a i n r e c o v e r y a t C M 5 , 6 , 9 a n d l 0 was higher, due probably to srnall stresses present at the gauges"
Steel Strains in Wi.res During Loading
The actual initial strain in the steel wires during the loading schedule was not known due to the effect of the grouting operation on the gauges. Zero readings were taken on each wire prior to each loading and were repeated after application of each load. The differences between these readings for six typical wires are plotted in Figure 30 for the last three l o a d s e r i e s .
Wires 3, l5 and l9 showed a very irregular strain pattern because of their position above or close to the centroid of the bearnts section. Wires 31, 35 and 47 followed a linear strain pattern, as can be seen in Figure 30.
The rnaxirnuln recorded increase in steel strain (in wire 4?) was 9 2 x 1 0 - 6 i r . . / i n . a t a l o a d o f D L + 4 . 5 L L . T h i s i n c r e a s e r e p r e s e n t e d o n l y 1.9 Per cent of the initial steel strain irnrnediately after cornplete tensioning. Larger increase, however, would have been obtained if steel strain gauges had been located at the position of rnaxirnurn rnornent.
CONCRETE CRACKING DURING TESTING
Syrnrnetrical Loading s
The first visible crack was noticed on the 5th day of t1ne Zg-day sustained load test. A hairline crack appeared in the upper part of the vertical joint at the centre support. This crack increased in length frorn
l3 in. (when first noticed) t9 2l in. at the end of the Z8-d.ay test. It reopened on applying qL + I LL. The first crack in the zone of positive mornent occurred at DL + Z+ LL at the 3l-ft 6-in. rnark on span B, and had already appeared during asyrnmetrical loading of DL + Z LL. Cracks also occurred on span B in the lower flange at the 25- and 34-ft rnarks. No cracking was noticed in span A.
t 5
-At DL + Z 3/ 4 LL the lower flange of span A started to crack at 32 ft. The load of DL + 3 LL increased the length of existing cracks
and produced an additional crack at the Z8-ft rnark in the lower flange of span A. This load also produced further cracking in the top flange near the centre
support. Span A had a crack 15 in. deep at the 3-tt 6-in. rnark, while the crack in span B occurred at the 3-ft rnark and was 20 in. deep. Further loadings increased the extent of existing cracks and produced the crack pattern shown in Figure 31. The largest crack observed before the jacks were displaced was at the 31-ft 6-in. rnark on span B and would probably have been the location of ultirnate failure. No visible cracks were noticed near either end of the bearn. At the rnaxirnurn applied'load of DL + 5.5 LL the beam had almost reached its carrying capacity; continuous purnping of the jacks produced very little increase in load and cracking was very advanced.
The sudden unloading of DL + 5.5 LL caused the bearn to spring up with such force that cracking occurred in the top flange at tlne 24-, Z8-, 3f .5-and 35-ft positions of span B. This sudden unloading also caused. cracks to extend the full depth of the bearn at the centre support, as is shown in
F i g u r e s 3 2 a n d 3 3 .
These cracks occurred at the joints forrned between the precast bearns and the grout used to fill the 4-in. gap at the centre. Their presence was one of the reasons for not continuing the test after the jacks kicked out. Further d.etails of cracks are shown in Figure 34.
Cracking During Asvrnrnetrical Loading
An asyrnrnetrical load of DL and DL + Z.O LL produced cracking in the span loaded with DL + z.o LL (span B). The concrete could be
heard cracking during the application of this load. The first crack occurred at 28 ft, followed by two other s at 25 and 3l ft 6 in. The crack at zg ft occurred between the two strain gauge points at t]nat location"
No cracking occurred in span A during the asyrnrnetrical loadings, but the above cracks reopened on applying a syrrrrnettical load of DL + 2.5 Ll-. END AND CENTRE REACTIONS
Syrnrnetrical Loading s
The total applied load calculated frorn the hydraulic jack pressures and the load calculated frorn the eight load cells varied by about 3 per cent. Greater variations were obtained for loads lower than and including DL because of the difficulty of reading low pressures on a high-pressure gauge. Greater variations also occurred at the final load of DL + Sf, Lt , which rnay be due to bending in the end load cells.
The centre support carried an average of 70 per cent of the total load, with the rernaining 30 per cent divided evenly between the two end reactions. The percentage of total load carried by the centre support was
1 6
-constant throughout syrnrnetrical loadings, the rnaxirnurn variation being about I per cent. Knowing the end reaction and centre support, it was possible to calculate the accurate bending rnoment diagrarn for the bearn ( F i g u r e 3 5 ) .
Asvmrnetrical Loading s
Larger differences occurred between loads calculated frorn load cells and hydraulic jack pressures during the aqyrnrnetrical loadings than during the syrnrnetrical loadings. The reason was probably the effect of the rotation of the bearn at the centre support upon the load cells where there v/as no roller. Table lfrTT slr6q7s the average load and percentages of total load at each reaction for the various load cornbinations.
During the various load cornbinations the percentage of total
load at the centre support rernains roughly constant, with the greatest changes occurring at the end reactions. Percentage increase and decrease of the end reactions are not uniforrn with increase in 1oad. At the asyrnrnetrical loading of DL and DL + ZLL the reaction at the end of the dead load span was only l. 6 per cent of total load. Under this load all deflection points in the dead load span showed an upward displacernent. It was this Load that produced cracking in the span loaded with DL + Z LL.
PURLIN BRACKET TESTING
Initially it was planned that the bearn would be loaded through the purlin brackets rather than on the top flange, as this would represent the actual loading conditions in service. It was later reasoned that if the brackets had failed before the bearn itself, the darnage rnight have been sufficient to prevent further loading of the bearn. This would ha.ve been undesirable, since the rnain purpose of the test was to check the behaviour of the bearn under load, not the behaviour of the purlins.
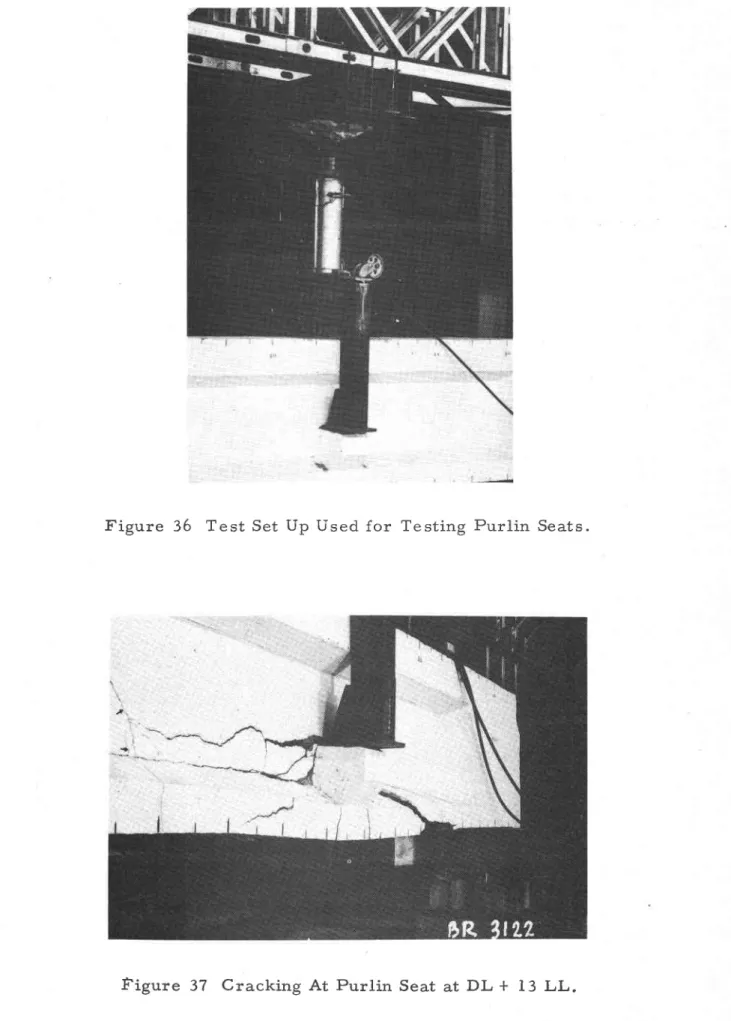
The purlin seats were loaded with the yoke arrangerrlent shown i n F i g u r e 3 6 . T w o p a i r s o f s e a t s i n s p a n A w e r e t e s t e d . T h e f i r s t p a i r , f 6 ft 8 in. frorn the centre support, carried a load equivalent to DL + 4.0 LL before any cracking occurred. The concrete in this area had been cracked due to pr:evious test loads.
The purlin brackets at the 3T-f.t 8-in. section were in a region of uncracked concrete and showed no signs of weakness due to previou.s test loads. The first crack occurred at DL + 9. B LL, which resulted in a drop in the jack hydraulic pressure" The purlin brackets were loaded to the capacity of the jack, 58 tons or DL + 13 LL producing the cracking shown in Figure 37. Further purlin bracket testing was considered unnecessary. GROUT INSPECTION
1 7
-several short sections by a pneurnatic chipper and a cutting torch.
No visible slipping of the wires and no visible drop in the b arn occurred when the anchor plates at the end of span A were burnt off. This indicates that the bond was sufficient to transfer the cornplete tensioning force. Exarnination of the ducts at the ends of the cut sections revealed that all the wires were surrounded by grout. There was, however, a srnall narrow sPace between the grouted cable rnass and the concrete edges of the ducts as a result of grout shrinkage. The rnaximurn width of this space was about t/ t6 in.
CONCLUSIONS
l. Although the loading systern failed before the ultirnate failure load of the bearn was reached, the indications were that it would have failed cornpletely at a load approaching DL + 6.0 LL.
2. The load factor at the
Bearn wejlght * DL * 5.5 LL. _ B e a m w e i g h t + D L + l L L
rnaxirnurn load reached 2 9 4 . 5 ^ 7 r L 4 . 6 - u ' J
in the test was
3. The factor of safety at first crack over the centre support was l . 5 a n d i n t h e s p a n , 2 . 5 .
ACKNOWLEDGEMENTS
Much assistance was received by the Division during this work, and it would be irnpossible to list all those who gave a helpful hand either in the work itself or in the forrn of suggestions during discussions. Special rnention, however, rnust be rnade of the co-operation of the Hydro-EIectric Power Cornmission of Ontario and, particularly, the staff of the Structural Research Departrnent, without whose help the work could not have been
carried out" The entire test project was rnade a co-operative venture between the Division of Building Research and the Structural Research Departrnent of the Hydro-Electric Power Cornrnission of Ontario.
' The co-oPeration of the following is also gratefully acknowledged: Defence Construction Lirnited; Central Mortgage and Housing Corporation; Richard and B.A. Ryan cornpany, general contractors; Mr. p.A. Benn, Manager, PrecomPression Cornpany Lirnited of Montreal; and the Structures Section of the Division of Mechanical Engineering, National Research Council of Canada.
This paper is based largly on a private report prepared by the first author after the test for the Central Mortgage and Housing Corporation and Defence Construction Lirnited, and has now been adapted for publication in this forrn by the second author. The first author is a forrner, the second a
- 1 8 _
present, rnernber of the Building Structures Section of the Divieton of
Building Research. The paper ie published with the approval of the Director of the Division.
o @ F-O o F-@ o cfl <) (f) eo a N (\I ca
€l "n
o l P . o l o d ( n l F :1 O o cO F-o o f'-\o o rO (f) o F-lO (Yl o \o rO co tH ot.$c
O F r F o d H d H o i q v O o N \o N N O d) o. cr) c\l o' $ o\ tr) O o \o o @ f-O \oF E
O Omx
.r-r G o o ^s u i
H d l { I H -j 5 o O t { B t + o. N rO ({) @ (\l eO o. F-o. o oF. @E ' 6
s+
m 6 ^
. * O . i O - r l&F-r &F-r t
(rl rO o o cr) F-\o d er) co \o o Fl f-d lH o F s d * o db"tr 5
n
\oo $ @ rO o \o eA o \o cr) o \o cf)5r
'iHH
I o .o o I O o t @ N o ! o. crl (')z
o
H F{o
o
"lrE
u
D
U
z
H&
F{ a f,l F{ f,l do
H Zo
f'J O J ; H2
F{ H € ho
q f,l H F{&
f,l n FIo
&
Az
o
H F{o
f,l aTABLE II
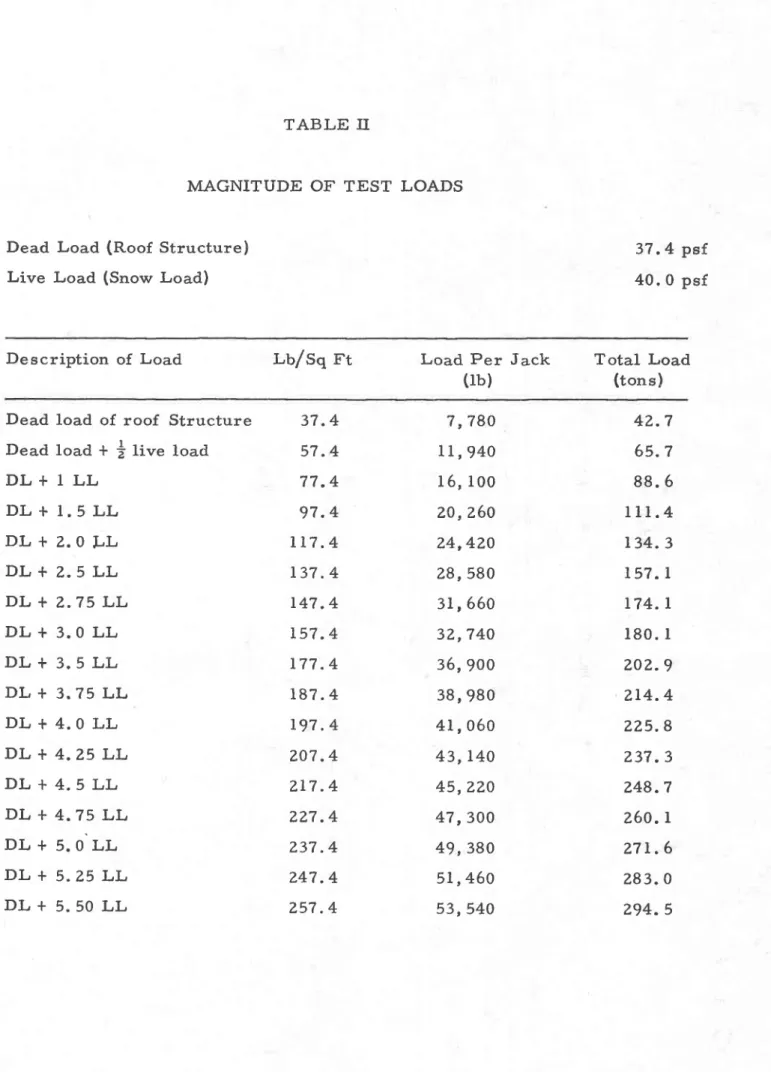
MAGNITUDE OF TEST LOADS
Dead Load (Roof Structure) Live Load (Snow Load)
3 7 .4 p s f . 4 0 . 0 p s f
Description of Load
Lu/sq Ft
L o a d P e r J a c k (lb)Total Load ( t o n s )
Dead load of roof Structure Dead load * j live load D L + 1 L L D L + I . 5 L L D L + Z . O L L D L + 2 . 5 L L D L + 2 . 7 5 L L D L + 3 . 0 L L D L + 3 . 5 L L D L + 3 . ? 5 L L D L + 4 . 0 L L D L + 4 . 2 5 L L D I , + 4 . 5 L L D L + 4 . 7 5 L L D L + 5 . O L L D L + 5 . 2 5 L L D L + 5 . 5 0 L L 3 7 . 4 5 7 . 4 7 7 .4 9 7 .4 t t 7 . 4 1 3 7 . 4 r 4 7 .4 1 5 7 . 4 r 7 7 .4 1 8 7 . 4 r 9 7 . 4
z o 7
. 4
z r 7 .4
? 2 7 . 4 2 3 7 .4 2 4 7 . 4 2 5 7 . 4 7 , 7 8 0 I 1 , 9 4 0 1 6 , 1 0 0 z 0 ,2 6 0 2 4 , 4 Z O 2 8 , 5 8 0 3 t , 6 6 0 3 2 , 7 4 0 3 6 , 9 0 0 3 8 , 9 8 0 4 1 ,0 6 0 4 3 , 1 4 0 4 5 , 2 2 0 4 7 ,3 0 0 4 9 , 3 8 0 5 l , 4 6 0 5 3 , 5 4 0 4 2 . 7 6 5 . 7 8 8 . 6 1 1 1 . 4 r 3 4 . 3 t 5 7 . I 1 7 4 . 1 1 8 0 . I 2 0 2 . 9 2 1 4 . 4 2 2 5 . 8 2 3 7 . 3 2 4 8 . 7 2 6 0 . L 2 7 t . 6 2 8 3 . O 2 9 4 . 5\O \O \O \O \O d $ @ \ \ N @ \ \ ( \ l \ ( \ r @ \ \ \ . ( r ) c q \ \ H t o \ \( n C - r r ) l r t l t t t t l l t l ro ro l.n to rn ro u) ro ro ro t.n Ln \o d $ r @ \ t r \ S \ | r ) \ . (f) r- (f) (f) t t t t l \O \O \O \O tn rO \O LO \O \O tO tO r d r c r , o € d ' d d d € E r d , c ' H H d H E g d g g d g H d d d d d d d d d d d d r o F o ( f t l . n D o F { ( f ) r r ) F -N N N (f) (f) (f) (fi (f) $ { <{ {t o ('} o J 0) Ir o 0) ${
F
+) lH I O o +t .c bo a) I>.
+) H rH (l) € (H o b0 rl = . Y q ) U ) t s d . 5 o t + * c d 9 * t d h o 9 t 5 . d . $ h - { € # ' q ) E Og ' d
- { g 6 c ) d + ' o o ) F t { H 0 ) o F c.e3
t.t
PF
o o (n O - t q ) d . { O + r ( ) o p k a d ( ) H b P . ; . - l v = O U . o t ?d .d x ' o i'r C) J r d 5 l + . o o d O H O ) - h q) h (d a () hF
h0 o b o5 T
mF
u
z
t{u
a
HF
o
E{ f.l Da
qz
o
H F.t HF t u
q6
H l l_{ 2 \ f"l F{ F'l il FIF
,lr4
f,l F{ 0z
H t ) t'l a ao
,l \ 0 6 O N < r \ O o o c ) N . f \ O @ N N c f ) c q c o ( f t ( f ) $ $ $ + +d
z
c) lrF
(r) o "1 \O \O \O \O \O \O \O \O .il F{ d| ,-{ \ cfl \ \ . \ (f) Ft I \ \ \ \ . \ - \(n cq' f) co-r t t t t l l t l co-r \O \O \O \O \O \O \O \O \O \O \O \O \O \O \O \O \O + $ o o < r $\ \ . \ > \
\ \ \ \ \ \
l l l l t t r l t t r \O \O \O \O \O \O \O \O \O \O \O bo t { C3 ' 6 0
N S \ O O c l N d t \ O @ O N $z
o kF
! r d q € € r d r d € € t r d dq q q q q E ( H H H d n ( d d ( d d d d d d d d d d( f ) r o F - o . = : : 5 g f t R
STEEL STRAINS
TABLE IV
BEFORE AND AFTER WEDGING OF WIRES
Wire No. 3 7 t l 1 5