Publisher’s version / Version de l'éditeur:
Vous avez des questions? Nous pouvons vous aider. Pour communiquer directement avec un auteur, consultez la première page de la revue dans laquelle son article a été publié afin de trouver ses coordonnées. Si vous n’arrivez pas à les repérer, communiquez avec nous à PublicationsArchive-ArchivesPublications@nrc-cnrc.gc.ca.
Questions? Contact the NRC Publications Archive team at
PublicationsArchive-ArchivesPublications@nrc-cnrc.gc.ca. If you wish to email the authors directly, please see the first page of the publication for their contact information.
https://publications-cnrc.canada.ca/fra/droits
L’accès à ce site Web et l’utilisation de son contenu sont assujettis aux conditions présentées dans le site
LISEZ CES CONDITIONS ATTENTIVEMENT AVANT D’UTILISER CE SITE WEB.
3rd Canadian Solar Buildings Conference [Proceedings], pp. 1-8, 2008-08-20
READ THESE TERMS AND CONDITIONS CAREFULLY BEFORE USING THIS WEBSITE.
https://nrc-publications.canada.ca/eng/copyright
NRC Publications Archive Record / Notice des Archives des publications du CNRC :
https://nrc-publications.canada.ca/eng/view/object/?id=0ead7f57-4e99-4412-8c95-de06b4e9d3cb https://publications-cnrc.canada.ca/fra/voir/objet/?id=0ead7f57-4e99-4412-8c95-de06b4e9d3cb
NRC Publications Archive
Archives des publications du CNRC
This publication could be one of several versions: author’s original, accepted manuscript or the publisher’s version. / La version de cette publication peut être l’une des suivantes : la version prépublication de l’auteur, la version acceptée du manuscrit ou la version de l’éditeur.
Access and use of this website and the material on it are subject to the Terms and Conditions set forth at
Simulation of a desiccant-evaporative cooling system for residential
buildings
http://irc.nrc-cnrc.gc.ca
S i m u l a t i o n o f a d e s i c c a n t - e v a p o r a t i v e c o o l i n g
s y s t e m f o r r e s i d e n t i a l b u i l d i n g s
N R C C - 5 0 5 9 1
H a d d a d , K . ; O u a z i a , B . ; B a r h o u n , H .
A version of this document is published in / Une version de ce document se trouve dans: 3rd Canadian Solar Buildings Conference, Fredericton, N.B., Aug. 20-22, 2008, pp. 1-8
The material in this document is covered by the provisions of the Copyright Act, by Canadian laws, policies, regulations and international agreements. Such provisions serve to identify the information source and, in specific instances, to prohibit reproduction of materials without written permission. For more information visit http://laws.justice.gc.ca/en/showtdm/cs/C-42
Les renseignements dans ce document sont protégés par la Loi sur le droit d'auteur, par les lois, les politiques et les règlements du Canada et des accords internationaux. Ces dispositions permettent d'identifier la source de l'information et, dans certains cas, d'interdire la copie de documents sans permission écrite. Pour obtenir de plus amples renseignements : http://lois.justice.gc.ca/fr/showtdm/cs/C-42
SIMULATION OF A DESICCANT-EVAPORATIVE COOLING SYSTEM FOR
RESIDENTIAL BUILDINGS
Kamel Haddad
1, Boualem Ouazia
2, and Hayssam Barhoun
21
CANMET Energy Technology Centre, Ottawa, Canada
2
National Research Council, Ottawa, Canada
ABSTRACT
One technology that can help reduce the electricity consumption of conventional air-conditioning technology is the coupling of active dehumidification with evaporative cooling. In this case sensible cooling and moisture removal from indoor and outside ventilation air are decoupled. In this study simulation models are developed for a conventional vapor compression based cooling system and a desiccant evaporative cooling system installed in an R-2000 house. Electricity consumption and comfort indices are then predicted for the two systems for three regions of the country with varying sensible heat ratios. It is found that, compared to a conventional system, the desiccant evaporative cooling system can lead to significant electricity consumption reductions and also reduce the number of hours when conditions inside the space are uncomfortable.
INTRODUCTION
According to the Energy Use Data Handbook (Office of Energy Efficiency, 2006), the total electricity consumption for space cooling of residential buildings in Canada has increased from 19.7 PJ in 1998 to 36.5 PJ in 2005. The relative increase in cooling electricity consumption during this period is especially significant for Ontario (82%) and Quebec (186%). In the year 2005 about 86% of the Canadian residential buildings with a cooling system installed use a central conditioning system while the rest use a room air-conditioner instead. This rapid increase in electricity consumption for space cooling is putting an even greater burden on electric power plants in some provinces. In Ontario summer air-conditioning has to be met using fuel sources with high Green House Gas emissions such as coal. There is then a need for air-conditioning technology that can help reduce electricity consumption for the purpose of energy conservation, electric peak shaving, and GHG emissions reduction. Conventional central air-conditioning systems based on the vapor compression cycle have a rated Sensible Heat
Ratio (SHR) of around 75%. The operation of these systems is controlled using only a thermostat and any moisture removed from the space is a by product of the temperature control. In humid climates the required design latent load of the space to maintain comfortable conditions can be high with a space design Sensible Heat Ratio significantly less than 75%. In this case using a conventional air-conditioning system leads to uncomfortable conditions with high indoor humidity levels. In addition, if the air-conditioning system is oversized and the supply fan is in continuous mode, part of the condensate in the drain pan of the cooling coil will evaporate back into the air stream and finds its way back inside the conditioned space (Henderson and Rengarajan, 1996).
A technology that can help address the previous shortcomings of conventional vapor compression technology is based on coupling active desiccant dehumidification with direct evaporative cooling. There is no need for a compressor in this case and the electricity used in this system is for pumping water through the evaporative cooler and for pushing the air around the system. The desiccant wheel can be controlled independently using a humidistat that senses the wet-bulb temperature of the space. A thermostat is used to activate the evaporative cooler when there is a need for space sensible cooling. In addition to the potential energy savings and peak reductions, this technology decouples the latent and sensible loads making it possible to condition spaces with a wide range of design Sensible Heat Ratios for better comfort conditions.
Nelson et al. (1978) developed a simulation model using TRNSYS software for a recirculation mode desiccant evaporative system. The second system they studied based on ventilation mode where the regeneration side of the desiccant wheel uses 100% return air and the process side draws in 100% outside air. Results are generated for Miami Florida for the system based on ventilation mode to supply the cooling load for a house. It is reported that up to 95% of the regeneration heat of the desiccant wheel can be met
from solar energy with 45 m2 collector area. The study does not deal with electricity consumption of the system.
Another noteworthy study is by Smith et al. (1993) who developed a simulation model for a ventilation mode Munters Environmental Control Cycle (MEC). Simulation results were generated for three different locations: Pittsburgh (Pennsylvania), Macon (Georgia), and Albuquerque (New Mexico). The results from this study indicate that the desiccant system is able to meet the cooling loads in all three locations. However, the paper does not present specific data for electricity and other energy consumption for the system. There is also no specific information on the comfort level achieved within the space associated with the use of the proposed system. It is reported that in Pittsburgh about 73% of the regeneration heat needed for the desiccant wheel comes from solar. This fraction falls to 18% for Albuquerque. The authors indicate that the simulation models used in their study can be improved by using product specific performance data. This study does not also provide any specific information on the electricity consumption associated of the system
In the present study, simulations models are developed for a conventional central vapor compression system and a recirculation mode desiccant evaporative cooling system. The house model connected to the two HVAC systems is based on the characteristics of the test house at the Canadian Centre for Housing Technology (CCHT). Results are then generated for the electricity and auxiliary energy consumption, and for comfort indices for the two types of systems for three locations in Canada. The results show that the proposed desiccant evaporative cooling system can be effectively used for electrical peak shaving and to improve comfort conditions inside residential buildings. In addition, solar energy can be used to provide a substantial portion of the auxiliary thermal energy needed to regenerate the active desiccant wheel.
SIMULATION TEST HOUSE
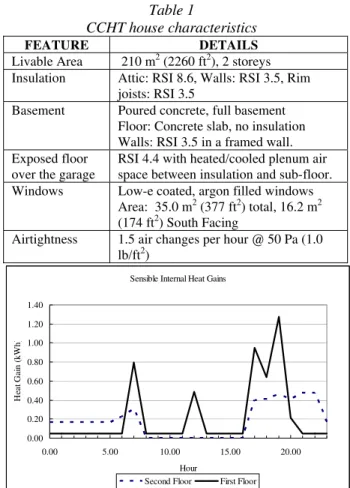
The results generated in the present study are obtained using simulation model for the Canadian Centre for Housing Technology (CCHT) test house shown in Figure 1. This house is built to the R2000 standard with several of its characteristics listed in Table 1. Internal sensible heat gains to the first floor zone from occupants, lighting, refrigerator, stove, dishwater, and other kitchen appliances add up to 5.3 kWh/day. For the second floor the internal sensible heat gains from occupants, lighting, and clothes washer and dryer add up to 4.3 kWh/day. The two load profiles for these gains are shown in Figure 2. It is assumed that these gains are 50% radiative and 50% convective.
Figure 1. CCHT Test and Reference Houses Table 1
CCHT house characteristics
FEATURE DETAILS
Livable Area 210 m2 (2260 ft2), 2 storeys Insulation Attic: RSI 8.6, Walls: RSI 3.5, Rim
joists: RSI 3.5
Basement Poured concrete, full basement Floor: Concrete slab, no insulation Walls: RSI 3.5 in a framed wall. Exposed floor
over the garage
RSI 4.4 with heated/cooled plenum air space between insulation and sub-floor. Windows Low-e coated, argon filled windows
Area: 35.0 m2 (377 ft2) total, 16.2 m2 (174 ft2) South Facing
Airtightness 1.5 air changes per hour @ 50 Pa (1.0 lb/ft2)
Sensible Internal Heat Gains
0.00 0.20 0.40 0.60 0.80 1.00 1.20 1.40 0.00 5.00 10.00 15.00 20.00 Hour H eat G ai n ( k Wh )
Second Floor First Floor
Figure 2. First and second floors internal sensible heat gains
The simulated occupancy is for two adults and two children with a total latent internal heat gain for the first and second floors of 0.47 and 0.66 kWh/day, respectively. The latent heat gain from the stove is assumed to be 40% of the total heat gain from this appliance at 0.66 kWh/day. In addition to these internal latent heat gains, there is a latent load associated with the introduction of outside ventilation air.
The house simulation model has zones for the basement, first floor, second floor, garage, and attic space. It is assumed that 40% of the total infiltration is attributed to the basement, 20% to the first floor, 20% to the second floor, and 20% to the attic. The house HVAC system responds to a thermostat on the first floor to maintain the dry-bulb temperature at 25±0.5 °C. But it is assumed that the first and second floors are fully mixed through the use of a high ventilation flow rate between the two zones representing these two floors. The basement, attic, and garage are not cooled by the HVAC system.
REFERENCE CONVENTIONAL
CENTRAL VAPOR COMPRESSION
AIR-CONDITIONING SYSTEM
Description
Figure 3 shows the layout for a conventional residential unitary-split air-conditioning system consisting of an outdoor condenser, condenser fan, indoor evaporator, compressor, and expansion valve. Electricity consumption in this system is due to the operation of the outdoor fan, indoor fan, and compressor. The outdoor air fraction of the total supply air is 10%.
Figure 3. Conventional unitary split air-conditioning system
Table 2 shows the various parameters that characterize this system using performance data for a commercial product documented by Neymark and Judkoff (2002). The data in Table 2 is at A.R.I. rating temperatures of
To,db = 35 °C, Ti,db = 26.7 °C, and Tin,wb = 19.4 °C. The system total supply flow rate is 425 L/s which are equally split between the first and second floor. The supply fan cycles on and off to maintain the house at 25±0.5 °C. All the power input to the fan motor goes toward heating the air flow.
Table 2
Characteristics of conventional vapor compression system
VARIABLE VALUE
Total Cooling Capacity 8174 W Compressor Power 1860 W Condenser Fan Power 108 W Indoor Fan Power 154 W
C.O.P. 4.15 Sensible Heat Ratio 0.75
Simulation Model
The simulation model used accounts for the variation of the total cooling capacity and the compressor power input of the air-conditioner with the inlet evaporator coil temperature and outdoor dry-bulb temperature. In addition, the sensible heat ratio of the direct expansion coil is a function of the inlet wet-bulb and inlet dry-bulb temperatures to the coil. The model predicted electricity consumption is corrected for part-load degradation of the system.
SOLAR ASSISTED
DESICCANT-EVAPORATIVE COOLING SYSTEM
Description
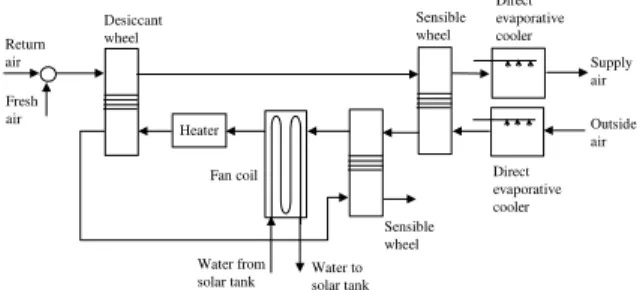
The proposed recirculation cycle desiccant-evaporative cooling system is shown in Figure 4. Return air is mixed with outside air and then dehumidified in an n active rotary desiccant wheel. Warm supply air from this wheel is then cooled through a sensible heat exchanger before entering a direct evaporative cooler and then delivered to the conditioned zones. On the regeneration side outside air is first cooled through a direct evaporative cooler and then used to cool the supply air in the sensible heat exchanger. This air is then heated to regenerate the desiccant wheel.
Figure 4. Recirculation cycle desiccant evaporative cooling system using solar energy
The exhaust regeneration air from the desiccant wheel is used to preheat the regeneration air at the inlet of the wheel. This air can be further heated through a fan coil using warm water from a solar storage tank. An inline heater is used to provide any additional heat needed to get the desired air temperature at the inlet of the
Direct evaporative cooler Outside air Supply air Direct evaporative cooler Sensible wheel Heater Desiccant wheel Return air Fresh air Fan coil Sensible wheel Water from
solar tank Water tosolar tank
Ambient air inlet Ambient air exhaust Compressor fan Condenser coil Supply air Indoor space Return air Supply air duct
Fresh air Evaporator coil
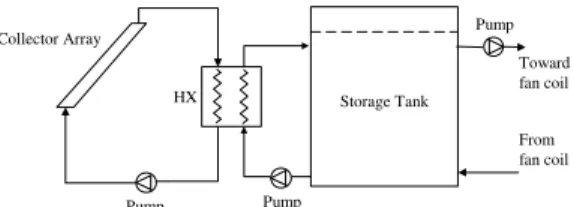
desiccant wheel on the regeneration side. A schematic of the solar system is shown in Figure 5. The collector performance data used in the simulation model is based on actual performance data for a commercially available solar collector.
Figure 5. Solar collector and storage tank system
All the desiccant system components are cycled on and off to maintain the space wet-bulb temperature at 18±0.5 °C. In addition, the process side fan and evaporative cooler are also cycled on and off to keep the space dry-bulb temperature at 25 °C. In effect, this control strategy decouples the sensible and latent cooling functions of the system.
Simulation Models
The heat exchangers of the system (sensible wheels and fan coil) are modeled using a constant effectiveness approach where the total heat transfer is given by:
(
inhot incoldp T T
c m
Q& =ε×(&× )min× , − ,
)
(1) Similarly a constant effectiveness is assumed for the direct evaporative cooler:in wb in in out T T T T , − − = ε (2)
An empirical model is used for the desiccant wheel based on actual performance data for a commercially available component. The model is based on two correlations for the outlet regeneration temperature and outlet regeneration humidity ratio:
in r in r T in r T in r T in p in p T in p T in p T T out r T w a w a T a T w a w a T a a T , , 7 , 6 , 5 , , 4 , 3 , 2 1 , = + + + + + + (3) in r in r w in r w in r w in p in p w in p w in p w w out r T w a w a T a T w a w a T a a w , , 7 , 6 , 5 , , 4 , 3 , 2 1 , = + + + + + + (4) It is found that these correlations fit the actual performance data of the desiccant wheel very well with R2 > 97%. Once the humidity ratio at the exit of the regeneration side is determined from Equation 4 using inlet conditions to the wheel, a moisture mass balance is used to find the humidity ratio at the exit of the process side. The enthalpy at the regeneration side outlet is based on temperature and humidity ratio values from Equations 3 and 4, respectively. An energy
balance on the wheel is then used to find the enthalpy at the outlet of the process side. As a result, two properties are now known for moist air at the exit of the process side.
A stratified tank model is used for the solar system storage tank with a total of 15 stratified layers. Hot water from the solar collector enters at the top of the tank while cold water from the fan coil enters at the bottom of the tank. At the same time cold water from the bottom of the tank is delivered to the solar collectors and hot water from the top of the tank is delivered to the fan coil. The tank sits in the basement and skin losses are accounted for as internal gains to this zone.
The solar collector model predicts the thermal performance of a flat plate solar collector. The model is based on the collector thermal efficiency equation:
t o in coll G T T − + = , 1 0 η η η (5)
The model corrects the efficiency for non-normal incident solar radiation and for any difference between actual operating flow rate and that used at rating conditions.
A summary of the parameters used in the simulations of the desiccant evaporative cooling system is shown in Table 3.
ASHRAE COOLING COMFORT ZONE
The ASHRAE comfort zone for cooling, as specified in the ASHRAE Handbook of Fundamentals (1997), is bounded at the top by the constant wet-bulb temperature line Twb of 20 °C and the bottom with the
constant dew-point temperature line Tdp of 2 °C. The
maximum allowable operative temperature on the x-axis is 27 °C at Tdp = 2 °C and 26 °C at Twb = 20 °C.
The operative temperature of 25 °C and a relative humidity of 50% (Twb = 18 °C) are right at the centre of
the summer comfort zone. In this study it is assumed that discomfort inside the occupied space occurs when either of the following conditions is true:
• Tdb > 26.5 °C • (Twb > 18.5 °C) and (Top > 23 °C) • (Tdp < 2 °C) and (Top > 23 °C) Storage Tank Collector Array Pump Pump HX Pump Toward fan coil From fan coil
Table 3
Characteristic parameters for desiccant evaporative cooling system
COMPONENT VARIABLE VALUE
Direct evaporative cooler Saturation efficiency 0.9 Circulation fans Motor efficiency 0.8 Air-to-air sensible HX Effectiveness 0.7
Effectiveness 0.6 Flow rate (kg/s) 0.227 Fan coil Pump power (W) 75 η0 0.694 η1 -4.85 Slope 45° Flow rate (kg/s-m2) 0.0066 Area (m2) 14.4 Solar collector Pump ΔTon; ΔToff (°C) 5.5; 1.0 Volume (Liters/m2 collector area) 75 Solar tank Blanket U-value (W/m2 -K) 0.83
Collector side pump power (W)
50
Tank side pump power (W)
25
Flow rate (kg/s-m2) 0.0066
Collector and solar tank pumps
Fraction of power transferred as heat
1.
Desiccant wheel Motor power (W) 10 Solar system
liquid-to-liquid HX
Effectiveness 0.8
SYSTEM PRESSURE DROPS
A detailed comparison of the performance of the conventional vapor compression system to the desiccant evaporative cooling system requires a good estimate of the pressure drops of the two systems. Tables 4 and 5 list pressure drop data used in the simulations for various components on the regeneration and process sides, respectively, of the desiccant evaporative cooling system. All of the pressure drop data, except for the house pressure drop, reported in the Tables is based on actual performance data of commercially available products. The house pressure drop is based on actual measurements taken at the CCHT. The fan power required to overcome the pressure drop is based on the following equation:
fan P V Power η Δ × = & (6)
Where a fan efficiency of 80% is assumed.
For the conventional system, the supply fan has to overcome flow resistances from the existing house and duct system (144 Pa), a filter (83 Pa), and DX coil (62 Pa) for a total fan power requirement of 154 W.
Table 4
Component pressure drops on regeneration side of desiccant evaporative cooling system
COMPONENT PRESSURE DROP (Pa)
POWER (W) Direct evaporative cooler 53 28 Sensible air-to-air HX 52 28 Sensible air-to-air HX 52 28 Fan coil 67 36 Desiccant wheel WSG550x200 350 186 Sensible air-to-air HX 52 28 Total: 626 334 Table 5
Component pressure drops on process side of desiccant evaporative cooling system
COMPONENT PRESSURE DROP (Pa) POWER (W) Filter 83 44 Desiccant wheel 350 186 Sensible air-to-air HX 52 28 Direct evaporative cooler 53 28 Existing duct and house
pressure drop
144 76
Total: 682 362
RESULTS AND DISCUSSION
The simulation models are used to generate results for Halifax, Ottawa, and Calgary using actual weather data files for the year 2001 for the period June 1st – August 31st. These locations are chosen because they represent a good diversity in the fraction of the total load that is sensible. All the results are generated using a 5-minute time step.
Total Cooling Demand using Ideal Controller
Table 6 shows the sensible, latent, and total cooling demands predicted for the three cities using an ideal controller to maintain the first and second floor dry-bulb temperature below 25 °C and relative humidity below 50%. These cooling demands do not include the contribution of the ventilation air and circulation fan heat toward the space cooling requirements. As expected, for a location such as Halifax, the latent loads represent a larger portion of the total cooling load. This trend is reversed in the dryer climate of Calgary.
Table 6
Cooling demand using ideal controller for CCHT house CITY Qs (kWh) l Q (kWh) t Q (kWh) SHR Halifax 695.4 226.9 922.3 0.754 Ottawa 1202.5 232.3 1434.8 0.838 Calgary 620.2 39.3 659.5 0.94
Conventional System Results
Figure 6 shows the variation of the second floor temperature (Operative, Dew-point, and Wet-bulb) for Ottawa when the house is cooled using a conventional air-conditioning system. In this case the wet-bulb temperature of the floor is continuously changing with the control of the dry-bulb temperature. The three temperatures in Figure 6 for the second floor are very close to those of the first floor due to the high mixing simulated between the two floors. The mean radiant temperature of the second floor is higher because of the high solar gains of this floor.
CCHT Second Floor Temperatures (Ottawa June-August 2001)
0 5 10 15 20 25 30 3624 3792 3960 4128 4296 4464 4632 4800 4968 5136 5304 5472 5640 5808 Hour T em p era tu re (D eg C )
Operative Dew-Point Wet-Bulb
Figure 6. Second floor temperature variation with conventional system for Ottawa
Table 7 lists the electricity consumption of the compressor, outdoor fan, and indoor circulation fan of the cooling system. Table 8 shows the predicted total hours of discomfort for the second floor of the house. The number of hours of discomfort for the first floor is lower because of the lower solar gains and the cooling effect from the basement. As the total cooling demand (sensible and latent) increases, the number of hours with uncomfortable conditions inside the space increases as expected.
Table 7
Electricity consumption of vapor compression system
Location Ec (kWh) Efan,i (kWh) Efan,o (kWh) Et (kWh) Ottawa 331 22 30 383 Halifax 173 12 16 201 Calgary 143 10 13 166 Table 8
Total hours of discomfort for second floor using vapor compression system Locatio n Nhours Tdb > 26.5 °C Nhours Twb > 18.5 °C and Top > 23 °C Total Hours of Discomfort Ottawa 18 137 155 Halifax 4 165 169 Calgary 3 0 3
Desiccant-Evaporative Cooling System Results
Figure 7 shows the variation of the second floor temperature when conditioned with a desiccant cooling system. In this case the controlled wet-bulb temperature is maintained around the set point of 18 °C. In contrast to the conventional system, in the case of the desiccant cooling system, active dehumidification is activated only when the wet-bulb temperature reaches a maximum threshold.
CCHT First Floor Temperatures (Ottawa June-August 2001)
0 5 10 15 20 25 30 3624 3792 3960 4128 4296 4464 4632 4800 4968 5136 5304 5472 5640 5808 Hour T em p era tu re ( D eg C )
Operative Dew-Point Wet-Bulb
Figure 7. Second floor temperature variation for Ottawa with desiccant evaporative cooling system for
Ottawa
Table 9 shows the electricity consumptions of the process side and regeneration side fans. The Table also shows the total electricity and electric auxiliary energy consumptions. These results are obtained with an inlet regeneration temperature of 70 °C. The results show that the total electricity consumption Et for Ottawa, Halifax, and Calgary decrease by 22.7, 30.8, and 53.6%, respectively, compared to the conventional cooling system. These results show that the desiccant evaporative cooling system has very good potential in reducing the peak electrical load of residential air-conditioning compared to a conventional system. The relative reduction in the electricity consumption of the desiccant system improves in locations with either high or low latent loads such as Halifax and Calgary, respectively.
Table 9
Electricity consumption of desiccant evaporative cooling system without solar energy (Tr,in=70 °C)
City Efan,p (kWh) Efan,r (kWh) Ewheel (kWh) Et (kWh) Qother (kWh) Ottawa 165 127 4.3 296 5305 Halifax 80 57 1.9 139 2371 Calgary 53 23 0.8 77 974
A high latent load degrades the performance of a DX coil of a conventional system, which then consumes even more electricity to achieve a certain sensible cooling load. While a low latent load indicates that most of the cooling load of the space can be met by
using mostly the evaporative cooler of the desiccant system, which operates on much less electricity than a compressor-based system.
The downside of the desiccant system is that auxiliary thermal energy has to be supplied to heat the air at the inlet of the regeneration side of the desiccant wheel. Ideally this auxiliary energy would come from a free source such as waste heat. Alternatively, a solar system using solar collectors and a water storage tank (Figure 5) can be used to provide most of the thermal energy needed to heat the regeneration air of the desiccant wheel.
Table 10 shows the electricity and auxiliary energy consumptions of the desiccant system using a 14.4 m2 solar collector system. In this case the total electricity consumption of the system Et increases significantly due to the operation of the circulation pumps of the solar system. In the case of Ottawa and Halifax there is now a slight increase in electricity consumption compared to a conventional system. A modest decrease in electricity consumption is predicted for Calgary. These results indicate then that the use of a solar system, of a similar size to the one simulated in this study, can potentially wipe out any benefit of the desiccant cooling system as a peak shaving or energy saving technology. Under such circumstances it can not be justified to operate the desiccant system using the solar system.
Table 10
Electricity and auxiliary energy consumption of desiccant evaporative cooling system with solar energy
(Tr,in=70 °C) City Efan,p (kWh) Efan,r (kWh) Epumps (kWh) Et (kWh) Qother (kWh) Ottawa 178 153 94 429 3287 Halifax 91 71 68 232 997 Calgary 62 31 53 147 95
However, it is important to keep in mind that the COP of the reference vapor compression cycle is previously assumed to be 4.15, which is more typical of highly efficient air-conditioners. If we assume a more moderate COP for the conventional system, the electricity reduction potential of the desiccant system will be even greater.
If a solar assisted desiccant cooling system is installed in a house, it is expected that it will be used to satisfy part of the energy input needed for space heating, domestic hot water, and space cooling. So a complete life cycle cost analysis of the desiccant evaporative cooling system using solar energy has to account for all the functions that the solar system can be used for in the home.
Table 11 shows the predicted total number of hours of discomfort for the second floor with the desiccant system installed. For Ottawa and Halifax the desiccant system has less number of hours of discomfort compared to the conventional system. Most importantly the results for Halifax show a very large decrease in the number of hours of discomfort from 169 to 32. For Calgary there is actually an increase in the number of hours but the total number is still very small relative to the duration of the cooling season. It is evident that the desiccant system is especially suited for areas where the latent loads are high.
Table 11
Total hours of discomfort for second floor using desiccant evaporative cooling system
Locatio n Nhours Tdb > 26.5 °C Nhours Twb > 18.5 °C and Top > 23 °C Total Hours of Discomfort Ottawa 10 129 129 Halifax 2 31 32 Calgary 5 8 13
One potential promising improvement to the desiccant system in Figure 4 is the replacement of direct evaporative coolers with indirect ones instead. This modification to the system can help minimize the moisture gain through the system and improve energy and comfort performance. Such a system is currently being tested at the Canadian Centre for Housing Technology. Preliminary results from experimental and simulation work on the desiccant system with indirect evaporative cooling show an even greater potential for electricity peak shaving and improving comfort level.
CONCLUSIONS
Detailed component based simulation models are generated for a conventional system and a desiccant evaporative cooling system, with and without solar energy, are developed and then used to assess the potential of the desiccant system for electric peak shaving and improved indoor comfort. Based on the results generated in this study it possible to make the following conclusions:
When the desiccant evaporative cooling system is used without solar energy, there is a significant reduction in electricity consumption associated with residential space cooling (30% for Halifax and 53% for Calgary). The relative reduction in electricity usage, compared to a conventional system, increases for areas with either a high or low Sensible Heat Ratio.
The desiccant evaporative cooling system has significant potential in reducing the occurrence of uncomfortable high indoor humidity levels that tend
to occur in humid parts of the country such as Halifax.
The use of solar energy for regeneration of the desiccant wheel can provide a significant portion of the auxiliary thermal energy needed. However, the operation of the solar system increases the electricity consumption of the cooling system, which can significantly reduce or completely eliminate the potential of the desiccant system as a peak shaving technology.
The desiccant system presented in this study can be further enhanced through the use of indirect evaporative coolers, which reduces the moisture gain to the supply air. Such system is currently being tested at the Canadian Centre for Housing Technology. Preliminary experimental and simulation results show that this system has an even greater potential for peak shaving and improved indoor comfort.
NOMENCLATURE
a Correlation coefficient
cp Fluid specific heat (J/kg-°C)
E Electricity consumption (kWh) ΔP Component pressure drop (Pa)
ε Effectiveness
η Collector efficiency
ηfan Fan motor efficiency
Gt Total solar radiation reaching collector (W/m2)
m& Fluid mass flow rate (kg/s)
Nhours Number of hours
Q& Heat transfer rate (W)
Q Cooling demand (kWh)
SHR Sensible heat ratio
T Temperature (°C)
V& Volume flow rate (m3/s)
w Humidity ratio (kg/kg)
Subscripts
c Compressor
coll Solar collector
cold Cold side of heat exchanger
db Dry-bulb dp Dew-point
hot Warm side of heat exchanger
l Latent i Inside in Inlet
o Outdoors (ambient)
op Operative
other Non electric
out Outlet p Process side r Regeneration side s Sensible t Total T Temperature w Humidity ratio wb Wet-bulb
wheel Desiccant wheel
REFERENCES
ASHRAE Handbook, Fundamentals Volume, American Society of Heating Refrigerating and Air-Conditioning Engineers Inc., Atlanta, GA., 1997
Henderson, H.I., Rengarajan, K. 1996. A Model to Predict the Latent Capaciy of Air-Conditioners and Heat Pumps at Part-Load Conditions with Constant Fan Operation. ASHRAE Transactions 102(1): 266:274.
Nelson, J., Beckman, W.A., Mitchel, J.W., Close, D.J. 1978. Simulation of the Performance of Open Cycle Desiccant Systems Using Solar Energy. Solar Energy, Vol. 21, pp. 273:278.
Neymark, J., Judkoff, R. 2002. International Energy Agency Building Energy Simulation Test and Diagnosis Method for Heating, Ventilating, and Air-Conditioning Equipment Models (HVAC BESTEST), Volume 1: Cases E100-E200.
Office of Energy Efficiency, 2006. Energy Use Handbook. Natural Resources Canada.
Smith, R.R., Hwang, C.C., and Dougall. R.S. 1993. Modeling of a Solar-Assisted Desiccant Air-Conditioner for a Residential Building. Thermodynamics and the Design, Analysis, and Improvement of Energy Systems, ASME.