HAL Id: hal-00713992
https://hal-brgm.archives-ouvertes.fr/hal-00713992
Submitted on 3 Jul 2012HAL is a multi-disciplinary open access archive for the deposit and dissemination of sci-entific research documents, whether they are pub-lished or not. The documents may come from teaching and research institutions in France or abroad, or from public or private research centers.
L’archive ouverte pluridisciplinaire HAL, est destinée au dépôt et à la diffusion de documents scientifiques de niveau recherche, publiés ou non, émanant des établissements d’enseignement et de recherche français ou étrangers, des laboratoires publics ou privés.
Suhadolc, Giovanni Costa, Donat Faeh, Eva Spühler, Andrej Gosar, Enrico
Priolo, et al.
To cite this version:
John Douglas, Philippe Guéguen, Emmanuel Chaljub, Fabrice Cotton, Peter Suhadolc, et al.. Dis-semination of Alpine Accelerometric Data. Third International Symposium on the Effects of Surface Geology on Seismic Motion, Aug 2006, Grenoble, France. Paper Number: 31. �hal-00713992�
Third International Symposium on the Effects of Surface Geology on Seismic Motion Grenoble, France, 30 August - 1 September 2006
Paper Number: 31
DISSEMINATION OF ALPINE ACCELEROMETRIC DATA
John DOUGLAS1, Philippe GUEGUEN2, Emmanuel CHALJUB2, Fabrice COTTON2, Peter
SUHADOLC3, Giovanni COSTA3, Donat FAEH4, Eva SPÜHLER4, Andrej GOSAR5, Enrico PRIOLO6, Carla BARNABA6, Roberto PAOLUCCI7, Carlo CAUZZI7, Claudio EVA8
1 BRGM – ARN/RIS, Orléans, France
2 LGIT, University Joseph Fourier, Grenoble, France. 3 Department of Earth Sciences, University of Trieste, Italy.
4 Swiss Seismological Service, Zurich, Switzerland.
5 Environmental Agency of the Republic of Slovenia, Ljubljana, Slovenia. 6 Seismic Research Centre, OGS, Sgonico, Italy.
7 Politecnico of Milan, Italy. 8 University of Genoa, Italy.
ABSTRACT - A new CD ROM of strong-motion data from 1976 to 2005 recording in the Alpine region, an area of significant seismic hazard, has just been released. This data was collected, processed and the CD ROM created within the framework of the Interreg IIIB Alpine Space project SISMOVALP (Seismic hazard and alpine valley response analysis). Records have been collected from seismic networks in France (Réseau Accélérometrique Permanent), Italy (networks of Politecnico of Milano and University of Genoa, Friuli Venezia Giulia Accelerometric Network, ENEL network now operated by Servizio Sismico Nazionale and temporary stations of ENEA), Switzerland (Swiss Seismological Service) and Slovenia (the network of Environmental Agency). These data provide a consistent and the most complete set of strong-motion data currently available for the Alpine region and provides a valuable basis for future seismic hazard assessment studies for the region, in particularly for studying the complex three-dimensional site effects that can occur in Alpine valleys. These data were then incorporated into a slightly modified version of the Strong-Motion Datascape Navigator (SMDN) developed by Ambraseys et al. (2004).
for elaboration of alpine geotechnical profiles which could be used in calculations and the ‘alpine records’ can be used to define specific seismic motions.
In the framework of the SISMOVALP project , the compilation of the available accelerometric data was planned, as well as the collection of new data from temporarily seismic experiments planed in selected alpine valleys. This data collection, in the form of a CD ROM has just been released. This short article summarises how the data was selected, processed, the contents of the CD ROM and also introduces the browser software provided alongside the data.
2. Data selection
The purpose of this new CD ROM is to present earthquake engineers and seismologists with a large set of accelerometric data for which the parameters (source, path and site) required for most analyses are complete. This CD ROM only contains data from the Alpine region (France, Italy, Slovenia and Switzerland) collected by permanent and/or national networks or by temporarily networks deployed for the SISMOVALP project. Additional European data from other regions can be downloaded from ISESD and imported into SMDN for analysis, if required.
The same strict selection criteria imposed by Ambraseys et al. (2004) for selecting records for the CD ROM of strong-motion data from the European and Middle East was not applied here since data from the Alpine region is sparse and their selection criteria would significantly reduce the quantity of data on the CD ROM.
The following criteria have been adopted to select records for this CD ROM: 1. ML≥4.0 if record from RAF.
2. ML≥3.0 if record from RAP.
3. Uncorrected acceleration time-history is available.
4. Natural frequency and damping are available if analogue instrument. 5. All three (two horizontal and one vertical) components are available. 6. Acceleration time-histories are of high-quality.
Figure 1shows the distribution of records in the selected set in terms of Mw, if
available, or local magnitude (ML), if Mw not available, and distance to surface projection
of rupture, if available, or epicentral distance otherwise. In total, the CD ROM contains 434 triaxial strong-motion records from 140 earthquakes and 77 stations in Alpine valleys in Europe.
Figure 1. Distribution of selected records in terms of moment magnitude (Mw), if available, or local magnitude (ML), if Mwnot available, and distance to surface projection of rupture
(df ), if available, or epicentral distance (de) otherwise.
2.1. Correction technique
In order to provide corrected acceleration, velocity and displacement time-histories that are reliable a correction procedure was adopted that used individual filter cut-off frequencies for each record. The correction technique implemented in the Basic Strong-Motion Accelerogram Processing (BAP) software (Converse & Brady, 1992) was used for the correction of all of time-histories contained on this CD ROM. This method consists of: interpolation to 200 samples a second; a correction for the instrument response, when the required characteristics are known, and high-cut filtering, with a cosine transition from the roll-off frequency to the cut-off frequency; followed by low-cut bidirectional Butterworth filtering of the acceleration after padding the time-history with zeros. The main problem
trace did not look realistic. The cut-off frequencies often did not need changing. The vast majority of time-histories on this CD ROM are from digital instruments.
It is more difficult to choose cut-offs for records from analogue instruments because often estimates of the noise do not exist. Most films from analogue instruments feature a fixed trace, which record the position of light beams reflected from mirrors attached to the instrument case (Hudson, 1979). Since these traces do not record the ground motions, if they were digitized in the same way as the ground motion traces they would provide the best estimate of the recording and digitization noise. Unfortunately, however, they are not often digitized or disseminated. For those time-histories that have such a digitized fixed trace they were used to select the low cut-off frequency in the same way as was done with
the records with pre-event portions.
For those records from analogue instruments with no available fixed trace, the upper edge of the average hand digitization noise estimate from Figure 8 of Trifunac & Todorovska (2001) was used as an estimate of the noise. This estimated noise spectrum may be too high for many records that were digitized on automatic or semi-automatic digitizing tables but because the digitization procedure is unknown for most records it was thought to be a conservative estimate. This signal-to-noise ratio spectrum and the signal’s Fourier amplitude spectrum were used to estimate the low cut-off frequency. The Fourier amplitude spectrum was examined following the suggestion of Zarè & Bard (2002) that Fourier amplitudes that do not tend to zero at low- and high-frequencies are evidence for noise. The estimated cut-off frequency were often varied if it was found that the displacement traces were not realistic or if it was found that a less strict cut-off frequency could be used and still obtain a realistic displacement trace. Even with the techniques adopted here for the selection of cut-off frequencies for records from analogue instruments with no digitized fixed traces there is still some subjectivity in the process.
After choosing the appropriate cut-off frequency for each component (two horizontal and one vertical) of a strong-motion record a single cut-off frequency was chosen for all three components for consistency. The choice of this single cut-off was difficult for some records because the generally lower amplitude vertical ground motions imply that often the appropriate low-frequency cut-off for vertical components is higher than for the corresponding horizontal components. The high-frequency filtering was accomplished using the commonly-chosen roll-off frequency of 23 Hz and a cut-off of 25 Hz for records from analogue instruments and a roll-off of 50 Hz and a cut-off of 100 Hz for records from digital instruments (e.g. Converse & Brady, 1992). Since most digital instruments have natural frequencies of about 50 Hz, and some of those with lower natural frequencies correct for the instrument response automatically, the effect of instrument correction is not large and therefore the requirement to apply a high-cut filter is less than for records from analogue instruments.
This procedure is the same as followed by Ambraseys et al. (2004).
3. Strong-Motion Datascape Navigator version 1.1
For their strong-motion data dissemination project Ambraseys et al. (2004) developed a new piece of software called Strong-Motion Datascape Navigator (SMDN) to select, view and analyze the data contained on the CD ROM produced. In addition, it allowed the user to import and analyze data from the Internet Site for European Strong-motion Data (ISESD, http://www.isesd.cv.ic.ac.uk). The program was written using Matlab 6.5.1 from
Mathworks and then compiled (using Matlab Compiler 3.0.1) to create a stand-along program that can be run on PCs with or without Matlab installed.
To create the CD ROM of the SISMOVALP project it was decided to use the same browser software although slightly modified to allow the user to access extra information on the site conditions at strong-motion stations within Alpine valleys. To complete the information on ground motion in Alpine valleys, the browser also allows the user to view a list of references (with an electronic copy, when available) dealing with the geotechnical description of the valley and the seismic response. The new software is called Strong-Motion Datascape Navigator version 1.1.
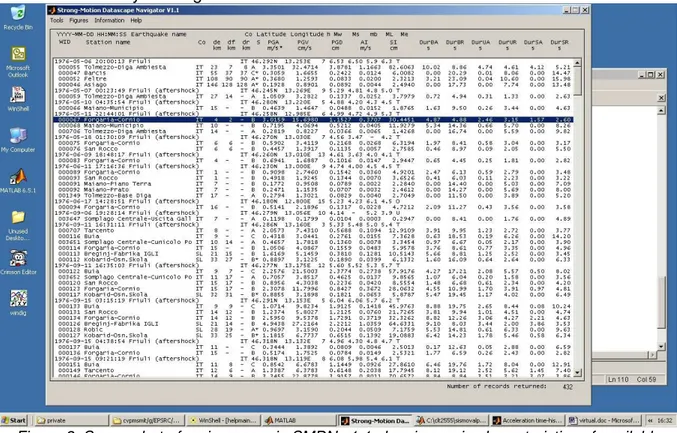
Figure 2 shows a screenshot of the main window in SMDN v1.1. This window lists all the currently selected records grouped by earthquake in ascending date order. Under a header line for each earthquake giving the main parameters for the earthquake (name, date, time, location, magnitude and mechanism), the associated waveforms for this earthquake are listed along with their main parameters (station, source-to-site distances, local site category and a selection of strong-motion parameters). Earthquakes and records
can be selected by clicking on their entries in this list.
5. pseudo-spectral acceleration versus spectral displacement; 6. inelastic ductility demand spectra;
7. inelastic strength demand and inelastic spectral velocity spectra;
8. strength demand versus ductility demand for a given natural period and damping; 9. Husid plot, i.e. Arias intensity versus time;
10. normalized energy density versus time;
11. absolute Fourier amplitude spectra (these can be smoothed);
12. horizontal to vertical ratio of the Fourier amplitude spectra (including user-defined smoothing).
All of these graphs (except number 1) can be plotted for a number of records simultaneously, thereby aiding comparison of different records. Graphs displaying linear elastic response spectra can be plotted to also display a chosen design spectra.
Maps showing the locations of the strong-motion stations that recorded accelerograms during a particular earthquake can be drawn using SMDN v1.1. These maps also show the epicentre and if known the location of the causative fault. On these maps the recorded acceleration, velocity and displacement time-histories can be plotted to aid understanding of the spatial variability of the strong ground motions.
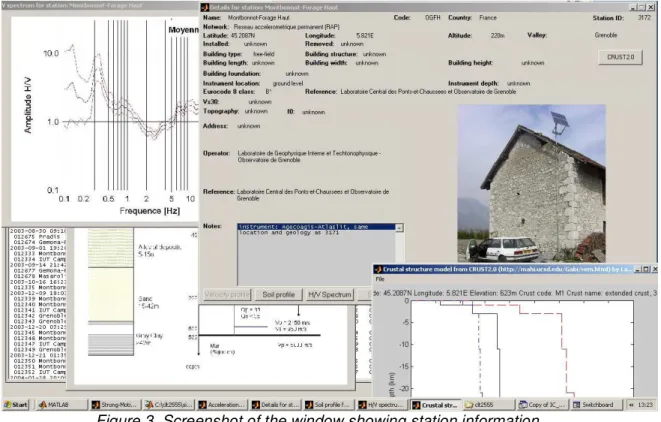
Like in the original SMDN, if there is a photograph of a recording station and/or a shear-wave velocity profile then these are displayed when the station information is viewed. In SMDN additional information on site conditions is also displayed, if available. This information includes the horizontal-to-vertical spectrum from microtremor measurements and the estimated natural frequency of the valley. Figure 3 shows an example of the window showing station information.
Figure 3. Screenshot of the window showing station information.
Like in the original SMDN, SMDN v1.1 allows the user to import data from ISESD and use the data in a similar way. Since ISESD does not provide all the associated
parameters as provided for the inbuilt data, nor does it provide constant strength or constant ductility inelastic spectra some features are disabled when SMDN is used with ISESD data.
3.1 Searching
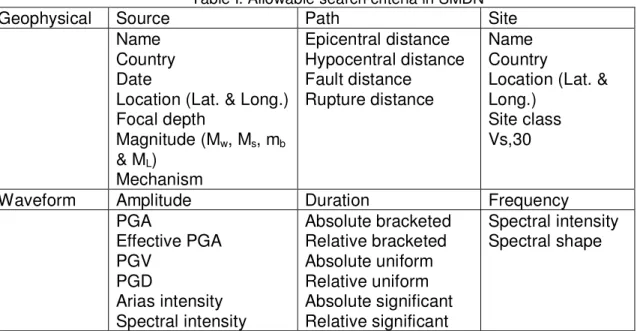
In previous CD ROM strong-motion data collections and on Internet sites providing strong-motion data (e.g. ISESD and COSMOS, http://db.cosmos-eq.org/) the search criteria that can be used are limited to geophysical parameters such as earthquake magnitude, source-to-site distance and local site category and possibly a handful of simple strong-motion parameters, such as peak ground acceleration. Such criteria, although useful, do not allow the user to find records that match criteria defined in terms of strong-motion parameters, which are often the only parameters researchers or designers know. For example, if a user wants a selection of time-histories to use to test a structure with a given natural period and damping subjected to shaking specified by a seismic design code then the spectral ordinate for that given period and damping is known and not the magnitude and distance of the target event. Therefore, SMDN allows the geophysical and strong-motion parameters specified in Table I to be used as search criteria.
Table I. Allowable search criteria in SMDN
Geophysical Source Path Site
Name Country Date
Location (Lat. & Long.) Focal depth Magnitude (Mw, Ms, mb & ML) Mechanism Epicentral distance Hypocentral distance Fault distance Rupture distance Name Country
Location (Lat. & Long.)
Site class Vs,30
Waveform Amplitude Duration Frequency
PGA Effective PGA PGV PGD Arias intensity Spectral intensity Absolute bracketed Relative bracketed Absolute uniform Relative uniform Absolute significant Relative significant Spectral intensity Spectral shape
earthquake was associated with an epicentral EMS-98 intensity of V. This earthquake clearly shows the importance and benefit of collection and dissemination of data from a variety of networks in the Alpine region since it occurred close to the France-Italy-Switzerland borders and valuable data was recorded by at least three accelerometric networks in these three countries. This section briefly discusses the available data from this earthquake.
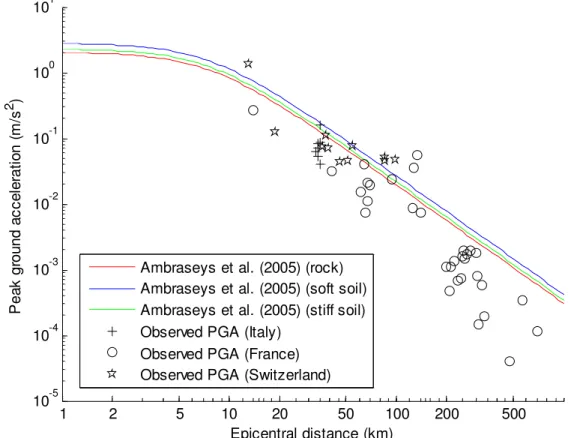
4.1. Comparison between observed and predicted peak ground acceleration
Figure 4 shows a comparison between the peak ground accelerations recorded during the Vallorcine earthquake at all stations that triggered (and not just those included on the SISMOVALP CD ROM) and the values predicted by the empirical ground motion estimation equation of Ambraseys et al. (2005). It can be seen that, on average, PGA is well predicted by the model of Ambraseys et al. (2005) up to a distance of about 150km even though Ambraseys et al. (2005) used only data from earthquakes larger than Mw 5.0 (the magnitude of the Vallorcine earthquake is 4.5) and also all data used by Ambraseys et al. (2005) came from more seismically active parts of Europe and the Middle East than the western Alps. For distances greater than about 200km the observed ground motions are of lower amplitude than predicted. This could be due to anelastic attenuation, which is not explicitly included in the model of Ambraseys et al. (2005). Also note, as expected, ground motions at sites in different countries at similar distances are of comparable amplitudes. 1 2 5 10 20 50 100 200 500 10-5 10-4 10-3 10-2 10-1 100 101 Epicentral distance (km) P ea k gr ou nd a cc el er at io n (m /s 2 )
Ambraseys et al. (2005) (rock) Ambraseys et al. (2005) (soft soil) Ambraseys et al. (2005) (stiff soil) Observed PGA (Italy)
Observed PGA (France) Observed PGA (Switzerland)
Figure 4. Comparison between the peak ground accelerations recorded during the Vallorcine earthquake (Mw 4.5, strike-slip mechanism) and the values predicted by the ground-motion
5. Acknowledgements
The CD ROM was created with the support of the Alpine Space Program of the European Community. It is a deliverable of the project: ’Seismic hazard and alpine valley response analysis -SISMOVALP’ (F/1-2/3.3/25) supported by the CIP INTERREG III B Alpine Space Program. For details of this project see http://www-lgit.obs.ujf-grenoble.fr/sismovalp. We would like to thank the organizations and agencies members of this project, which generously contributed strong-motion records to the SISMOVALP project: Observatoire de Grenoble, Grenoble, France; Université Joseph Fourier, LGIT, France; Centro Ricerche Casaccia, Ente per le Nuove Tecnologie, l’Energia e l’Ambiente (ENEA), Rome, Italy; Dipartimento di Scienze della Terra, Universita degli Studi di Trieste, Trieste, Italy; Dipartimento per lo studio del territorio e delle sue risorse, Universita degli Studi di Genova, Italy; Instituto Nazionale di Oceanografia e Geofisica Sperimental, Trieste, Italy; Politecnico di Milano, Italy; Servizio Sismico Nazionale (SSN), Ufficio Sistemi di Monitoraggio, Rome, Italy; Societa Gestione Impianti Nucleari (SOGIN), Rome, Italy; Environmental Agency of the Republic of Slovenia, Slovenia; Swiss Seismological Service, Swiss Federal Institute of Technology, Zurich, Switzerland.
The partners of this project are interested in using the browser written for this project for the dissemination of other strong-motion data. Because the data and program are kept separate the use of the browser for the analysis of other strong-motion data is straightforward. Therefore any organisations that are keen to use this software should contact John Douglas ([email protected]).
6. References
Ambraseys, N. N., J. Douglas, S. K. Sarma, P. M. Smit (2005), Equations for the estimation of strong ground motions from shallow crustal earthquakes using data from Europe and the Middle East : Horizontal peak ground acceleration and spectral acceleration, Bulletin of Earthquake Engineering, 3(1), 1-53.
Ambraseys, N. N., J. Douglas, R. Sigbjörnsson, C. Berge-Thierry, P. Suhadolc, G. Costa, and P. M. Smit. (2004) Dissemination of European Strong-Motion Data, vol. 2 using Strong-Motion Datascape Navigator. CD-ROM collection, Engineering and Physical Sciences Research Council, United Kingdom.
Converse, A. M. and A.G. Brady (1992), BAP Basic Strong-Motion Accelerogram Processing Software, version 1.0”, U.S. Geological Survey Open-File Report 92-296A.
Hudson, D. E. (1979) Reading and interpreting strong motion accelerograms, Earthquake Engineering Research Institute, Berkeley, USA.