Annals of Oncology 25: 1650–1656, 2014 doi:10.1093/annonc/mdu138 Published online 23 April 2014
European cancer mortality predictions for the year 2014
M. Malvezzi
1,2, P. Bertuccio
1, F. Levi
3, C. La Vecchia
2* & E. Negri
11
Department of Epidemiology, IRCCS-Istituto di Ricerche Farmacologiche‘Mario Negri’, Milan;2
Department of Clinical Sciences and Community Health, Universitá Degli Studi di Milano, Milan, Italy;3
Cancer Epidemiology Unit, Institute of Social and Preventive Medicine (IUMSP), Lausanne University Hospital, Lausanne, Switzerland
Received 10 December 2013; revised 10 March 2014; accepted 26 March 2014
Background:
From most recent available data, we projected cancer mortality statistics for 2014, for the European Union (EU) and its six more populous countries. Specific attention was given to pancreatic cancer, the only major neo-plasm showing unfavorable trends in both sexes.Patients and methods:
Population and death certification data from stomach, colorectum, pancreas, lung, breast, uterus, prostate, leukemias and total cancers were obtained from the World Health Organisation database and Eurostat. Figures were derived for the EU, France, Germany, Italy, Poland, Spain and the UK. Projected 2014 numbers of deaths by age group were obtained by linear regression on estimated numbers of deaths over the most recent time period iden-tified by a joinpoint regression model.Results:
In the EU in 2014, 1 323 600 deaths from cancer are predicted (742 500 men and 581 100 women), corresponding to standardized death rates of 138.1/100 000 men and 84.7/100 000 women, falling by 7% and 5%, respectively, since 2009. In men, predicted rates for the three major cancers (lung, colorectum and prostate cancer) are lower than in 2009, falling by 8%, 4% and 10%, respectively. In women, breast and colorectal cancers had favorable trends (−9% and −7%), but female lung cancer rates are predicted to rise 8%. Pancreatic cancer is the only neoplasm with a negative outlook in both sexes. Only in the young (25–49 years), EU trends become more favorable in men, while women keep registering slight predicted rises.Conclusions:
Cancer mortality predictions for 2014 confirm the overall favorable cancer mortality trend in the EU, translating to an overall 26% fall in men since its peak in 1988, and 20% in women, and the avoidance of over 250 000 deaths in 2014 compared with the peak rate. Notable exceptions are female lung cancer and pancreatic cancer in both sexes.Key words:pancreatic cancer, cancer, Europe, mortality, projections, time trends
introduction
Estimates of cancer mortality statistics for the current year,
extra-polated from officially available data from a few years earlier, have
long been available for the United States, and have been published
over the last few years for the European Union (EU) as a whole,
as well as its six more populous countries, based on the World
Health Organisation (WHO) mortality database [
1
–
3
].
Here, we provide corresponding
figures for the year 2014 using
the same methodology and WHO mortality database updated in
May 2013. This report also focuses speci
fically on pancreatic
cancer, the only major neoplasm not showing favorable mortality
trends in both sexes over the last few decades in the EU as well as
the USA [
4
–
7
].
materials and methods
This work is an update to the previous articles on predicted European cancer mortality, hence the methods are similar [3,8,9].
Official death certification data for stomach, colorectum, pancreas, lung, breast, uterus (cervix and corpus), prostate, leukemias and total cancer mor-tality were obtained from the WHO database (WHOSIS) [1]. Figures were derived for the EU in the period 1970–2009 and up to the most recent avail-able year for six major European countries: France (2009), Germany (2011), Italy (2010), Poland (2011), Spain (2011) and the UK (2010). Details of the data sources and preparation can be found in the supplementary Appendix, available at Annals of Oncology online.
From the matrices of certified deaths and resident populations, we computed age-specific numbers of deaths and rates for each 5-year age group (from 0–4 to 80+ years) and calendar year. Age-standardized rates per 100 000 men and women, at all ages, were computed using the direct method, on the basis of the world standard population for all the studied cancers and countries [10].
We fit a logarithmic Poisson count data joinpoint regression model to each 5-year age-specific number of certified deaths in order to identify the most recent trend segment [11]. The joinpoint regression model was set to a maximum of six identifiable segments (five joinpoints) and to have at least five datapoints from the last available calendar year. Age-standardized rates for all countries and neoplasms were also analyzed with joinpoint regression models with up to four trend segments (three joinpoints). Joinpoint Regression Program, Version 4.0.4 from the National Cancer Institute was used.
A linear regression was carried out on mortality data from each age group over the time period identified by the joinpoint model, in order to compute the predicted age-specific certified number of deaths and the corresponding *Correspondence to: Prof. C. La Vecchia, Department of Clinical Sciences and
Community Health, Universitá degli Studi di Milano, Via Augusto Vanzetti 5, 20122 Milan, Italy. Tel: +39-02-39-01-4527; Fax: +39-02-33-200-231; E-mail: [email protected]
© The Author 2014. Published by Oxford University Press on behalf of the European Society for Medical Oncology. All rights reserved. For permissions, please email: [email protected].
95% prediction intervals (PI) [12]. Predicted age-specific numbers of deaths
and the predicted population data from Eurostat [13] were used to compute the predicted standardized death rates with 95% PI.
results
Table
1
shows the total numbers of predicted deaths (rounded
to the nearest hundred) and the predicted age-standardized
death rates for the analyzed neoplasms with 95% PI, in the EU
as a whole in 2014, as well as corresponding
figures for 2009. In
the EU in 2014, 1 323 600 deaths from cancer are predicted
(742 500 men and 581 100 women), compared with the 1 281 773
cancer deaths recorded in 2009 (718 355 men and 563 418
women). These numbers correspond to standardized death rates
of 138.1/100 000 men and 84.7/100 000 women predicted for
2014, compared with 148.3 men and 89.1 women recorded in
2009, a 7% and 5% fall in men and women, respectively. The
rise in certified deaths in spite of the fall in rates highlights the
effect of population growth and ageing. Lung cancer is
respon-sible for the largest number of predicted deaths in men with
over 187 000 deaths (25% of total cancer deaths), followed by
colorectal and prostatic cancer (92 900 and 70 100 deaths,
re-spectively). Predicted death rates were 36.5/100 000 for lung,
16.5/100 000 for colorectum and 10.2/100 000 for prostate.
These
figures are lower than those recorded in 2009, falling by
8%, 4% and 10%, respectively. In women, breast cancer was
re-sponsible for the largest number of deaths with 89 300 predicted
deaths (15%, 14.5/100 000), followed by lung cancer (84 500
deaths, 14.1/100 000) and colorectal cancer with 75 500 deaths
(9.5/100 000). Female breast and colorectal cancers had
favor-able rates (
−9% and −7%, respectively), but differently from
men, female lung cancer rates are predicted to rise 8%.
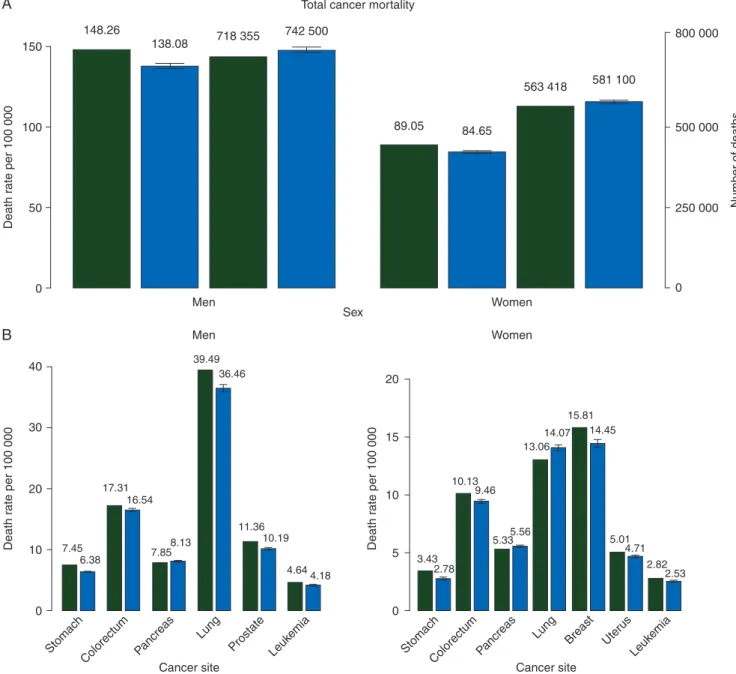
Figure
1
A shows bar plots of standardized death rates per
100 000 population and certified deaths from all cancers for the
year 2009, and the predicted rates and number of deaths for 2014,
with the corresponding 95% PIs in men and women. Figure
1
B
shows bar plots of standardized death rates per 100 000 population
for the year 2009, and the predicted rates for 2014 with 95% PIs
for the speci
fic sites considered for the EU (in men and women).
Figure
2
gives trends in all-age-standardized (world
popula-tion) cancer mortality rates for men and women in quinquennia
centered from 1972 to 2007, and the predicted rates for 2014 for
all cancers.
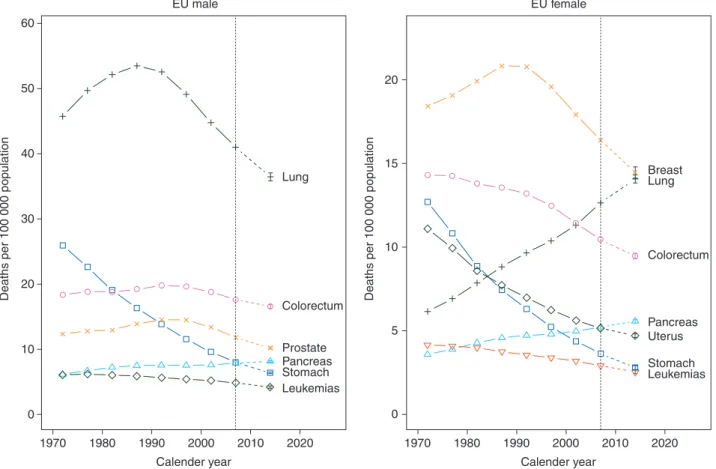
Figure
3
gives corresponding trends and predictions for
stomach, colorectum, pancreas, lung, breast, uterus, prostate
and leukemias for EU men and women.
Overall cancer mortality trends are projected to continue
their favorable trends into 2014 as they have in men since the
late 1980s, and in women earlier still. Supplementary Appendix,
with individual country data and analyses, is available at Annals
of Oncology online.
Table
2
gives age-standardized pancreatic cancer death rates
in 2000–2004 and 2005–2009, in the all ages, 25–49 and 50–64
age groups, and predictions for 2014 in men and women for the
EU as a whole and its six largest countries. At all ages, the
change between 2000
–2004 and 2005–2009 is unfavorable for all
countries in both men and women. Only Italian and Polish men
predicted a modest fall for 2014. In the middle aged (50–64
Table 1. Number of predicted cancer deaths and mortality rates for the year 2014 and comparison figures for most recent data for the EU as a whole, with 95% prediction and confidence intervals
Sex Cancer Observed
number of deaths 2009 Predicted number of deaths 2014 Lower prediction limit (95%) Upper prediction limit (95%) Observed ASRa2009 Predicted ASRa2014 Lower prediction limit (95%) Upper prediction limit (95%) Men Stomach 36 562 34 300 33 741 34 950 7.45 6.38 6.27 6.49 Colorectum 87 864 92 900 91 648 94 091 17.31 16.54 16.27 16.82 Pancreas 36 714 41 300 40 693 41 969 7.85 8.13 8.00 8.27 Lung 183 480 187 300 184 450 190 152 39.49 36.46 35.86 37.06 Prostate 69 036 70 100 68 945 71 350 11.36 10.19 10.03 10.36 Leukemias 22 048 23 100 22 494 23 621 4.64 4.18 4.03 4.33 All cancers (malignant and benign) 718 355 742 500 734 307 750 601 148.26 138.08 136.35 139.82 Women Stomach 23 977 20 800 20 117 21 429 3.43 2.78 2.67 2.89 Colorectum 75 063 75 500 74 549 76 503 10.13 9.46 9.31 9.62 Pancreas 36 725 41 000 40 296 41 755 5.33 5.56 5.47 5.66 Lung 73 727 84 500 83 192 85 739 13.06 14.07 13.82 14.32 Breast 89 514 89 300 87 786 90 867 15.81 14.45 14.12 14.79 Uterus (cervix and corpus) 27 590 27 800 27 291 28 340 5.01 4.71 4.60 4.82 Leukemias 17 995 18 600 18 193 18 986 2.82 2.53 2.43 2.63 All cancers (malignant and benign) 563 418 581 100 576 440 585 805 89.05 84.65 83.81 85.49
aASR, age-standardized mortality rate, standardized using the world standard population.
years), only German men and Italian women registered a fall in
rates between 2000
–2004 and 2005–2009. In the young (25–49
years), the outlook is favorable for men, with all the projected
rates being lower than those recorded for 2005–2009. Conversely,
in women rates are projected to continue rising, with the
excep-tions of Poland, Spain and Italy.
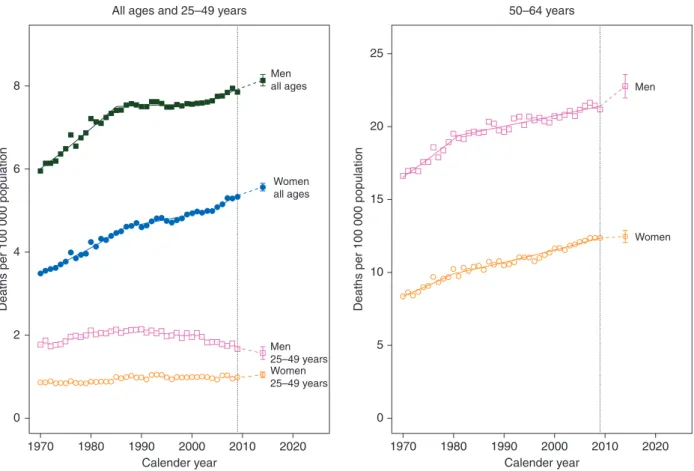
Figure
4
shows joinpoint analysis of EU pancreatic cancer
age-standardized mortality rates in the three age groups
consid-ered for men and women, with projections to 2014 and
corre-sponding PIs. Pancreatic cancer in the all ages and middle aged
has had a steady rise in women since the 1970s and is projected
to continue while, in men, it seemed to have reached a slowly
rising plateau in the late 1980s, but rises are projected until
2014. In the young, there is a stable trend in women that is
projected to rise, but the PIs show the projection is in the range
of stability while, in young men, the falls recorded from the
early 1980s onward are projected to continue up to 2014.
discussion
Due to their short-term nature and the large numbers involved
in their computation, the EU cancer mortality predictions
should not be affected by major unexpected events or
oscilla-tions. However, if a change or even a trend reversal were to have
occurred within the last few years, it is unlikely that this model
would totally account for it. Even though a more recent world
standard population that better re
flects the global aging
150 800 000 500 000 Number of deaths 250 000 0 148.26 138.08 718 355 742 500 89.05 84.65 563 418 581 100 Total cancer mortality
A
B
100 Death r ate per 100 000 40 30 20 10 7.45 6.38 17.31 16.54 39.49 36.46 7.858.13 11.36 3.43 2.78 10.13 9.46 5.335.56 13.06 14.07 15.81 14.45 5.01 4.71 2.82 2.53 10.19 4.644.18 0 Cancer site Stomach Colorectum Pancreas Lung Prostate Leuk emia Cancer site Stomach Lung ColorectumPancreas Breast Uter us Leuk emia Death r a te per 100 000 20 15 10 5 0 Death r a te per 100 000 50 0 Men Women Men Women SexFigure 1. (A) Bar plots of age-standardized (world population) death rates per 100 000 and certified deaths for the year 2009 (green) and predicted rates and number of deaths ( predicted numbers of deaths are rounded to the nearest hundred) for 2014 (blue) with 95% prediction intervals (PIs) for total cancer mortal-ity in the EU in men and women. (B) Bar plots of age-standardized death rates per 100 000 population for year 2009 (green) and predicted rates for 2014 with 95% PIs (blue) in the EU in men and women for selected cancer sites.
population has been published [
14
], we chose to keep using the
1982 version to maintain comparability with previous work
[
10
].
Total male cancer mortality rate is 63% higher than the
female rate, but is falling faster. This difference is mainly
attrib-utable to the different smoking pattern history in the two sexes.
In fact, incidence of lung- and other tobacco-related cancer sites
have been growing over the last two decades in EU women [
15
–
17
]. Lung cancer in men peaked in the late 1980s, with a rate
over 50 and has since fallen by about a third to about 36/
100 000 men. This is still higher than the US rate, now about 30/
100 000 [
2
,
16
]. Conversely, in women, rates have been rising
throughout the studied period reaching a predicted rate of 14.1/
100 000 women. Meanwhile, EU overall female breast cancer
mortality rates fell over 8% in 5 years to 14.5/100 000,
confi-rming that lung cancer will become the
first cause of cancer
death in women over the next few years [
3
,
15
]. Similarity, the
US breast cancer mortality rate was 14.0/100 000 in 2010 [
1
]. All
the countries that have a lung cancer mortality rate higher than
that of the EU as a whole also have a higher total cancer rate.
This indicates that smoking habits remain the single strongest
determinant of cancer mortality in the EU.
Stomach cancer has been one of the main drivers for the
fa-vorable overall cancer trends in both sexes. An age-period
cohort analysis of stomach cancer showed a tendency to reach
an asymptote in the effects of the most recent cohorts in
coun-tries with low mortality rates [
18
–
20
].
In the EU, cancer of the colorectum was the second cause of
cancer mortality in men and overall, after lung cancer. Examining
the major EU countries, the situation remains heterogeneous,
with an over 70% difference in men between France and Poland.
In spite of these differences, compared with the 1970s, rates have
been converging, particularly for women, across Europe. The
earlier favorable trend in women may be attributable to better
life-style habits and the use of oral contraceptives and other
exogen-ous female hormone preparations [
21
].
Steady falls in mortality rates are also predicted for major
cancers amenable to treatment, including leukemias in both sexes,
breast and uterine cancers and prostate cancer. Early diagnosis
and screening, in addition to improved therapies and disease
man-agement are the key contributors to the falling trends predicted
for these cancers [
22
,
23
]. In breast cancer, in particular, falls in
mortality have reached 30%
–50% in several countries over the last
three decades [
24
].
2011 Mortality data for Germany, Poland and Spain have
now been published in the WHOSIS; hence, we can compare
our previous predictions. The predictions for Poland were over a
short (2008
–2011) period and carried out within the 95% PIs,
with the exceptions of male lung cancer and total female cancer
mortality that were slightly overestimated, but still within a 5%
margin. However, German and Spanish mortality projections
were over longer periods (2006
–2011 and 2005–2011,
respect-ively) and overestimated falls in mortality for most cancers;
nonetheless, it should be noted that, in many cancers, changes
in trends occurred within the projected period and were
there-fore unpredictable by this model.
Pancreatic cancer is the only examined neoplasm with a
nega-tive outlook in both sexes at all-ages in the EU as a whole. In the
young, the situation in the EU becomes more favorable in men,
while women keep registering slight predicted rises, likely
reflecting trends in smoking in recent generations of European
men and women [
25
]. Tobacco is in fact the main recognized
risk factor for pancreatic cancer and is the probable factor behind
the fall in male pancreatic cancer rates in the UK between the late
1970s and late 1990s [
26
]. Obesity and diabetes are other
recog-nized risk factors, together with high alcohol intake, and a family
history of pancreatic cancer [
27
–
31
]. However, tobacco accounts
for less than a third of all cases of pancreatic cancer, and all the
known causes together account for <40% [
32
]. Some of the
un-favorable trends in pancreatic cancer mortality are likely due to
improved diagnosis and certi
fication following widespread
imaging utilization over recent calendar years. In the United States,
trends in pancreatic cancer mortality were inconsistent across
sexes and races over the last two decades, however, in the absence
of any clear downward trend in either sex, despite the major fall in
tobacco consumption in men [
5
,
6
]. This may be partly related to
the rise in obesity in the United States. The prognosis from this
tumor is bleak with 5-year survival being <5%, making mortality
from this cancer a close proxy of its incidence [
4
]. This makes
pan-creatic cancer a priority in research and control.
Cancer mortality predictions for the year 2014 confirm the
overall favorable trend in total cancer mortality in the EU, as
reported in the United States [
2
,
33
]. The fall in cancer mortality
rates since their peak in 1988 corresponds to more than 250 000
All cancer EU 200 150 Men Women 100
Deaths per 100 000 population
50
0
1970 1980 1990
Calender year
2000 2010 2020
Figure 2. Age-standardized (world population) total cancer mortality trends in quinquennia from 1970–1974 to 2005–2009 and predicted rates for 2014, for men (squares) and women (circles) in the EU.
Table 2. Age-standardized pancreatic cancer mortality death rates for all ages, 25–49 and 50–64 years in the quinquennia 2000–2004 and 2005–2009 with predicted rate for the year 2014 in the EU and selected countries
All ages 25–49 years 50–64 years
ASRa 2000–2004 ASR a 2005–2009 PredictedASRa2014 ASRa 2000–2004 ASR a 2005–2009 PredictedASRa2014 ASRa 2000–2004 ASR a 2005–2009 PredictedASRa2014 Men France 7.57 7.96 8.76 1.88 1.80 1.64 20.59 21.68 26.85 Germany 8.20 8.35 8.55 1.73 1.65 1.64 22.20 22.08 20.95 Italy 7.39 7.60 7.47 1.55 1.57 1.39 19.72 19.88 19.54 Poland 8.03 8.16 8.11 2.61 2.21 1.42 23.94 24.74 25.99 Spain 6.43 6.59 6.64 1.82 1.70 1.61 18.16 18.65 18.64 The UK 6.35 6.47 6.56 1.36 1.17 1.15 16.06 16.19 17.26 European Union (27) 7.60 7.83 8.13 1.92 1.76 1.57 20.78 21.36 22.77 Women France 4.44 4.80 5.35 0.91 0.96 1.12 10.00 11.14 13.40 Germany 5.56 5.88 6.13 0.99 0.96 1.07 12.85 13.65 12.31 Italy 5.06 5.15 5.33 0.89 0.94 0.89 11.52 11.31 11.49 Poland 5.01 5.16 5.20 1.14 1.09 1.09 13.09 13.33 15.10 Spain 3.74 3.99 4.08 0.86 1.00 0.99 8.65 9.13 9.92 The UK 4.75 5.02 5.22 0.81 0.81 0.93 11.13 11.31 10.99 European Union (27) 4.97 5.23 5.56 0.98 0.99 1.05 11.72 12.29 12.47
aASR, age-standardized mortality rate, standardized using the world standard population.
EU male 60 50 20 15 10 5 0 40 30
Deaths per 100 000 population Deaths per 100 000 population
20 10 0 1970 1980 1990 Calender year 2000 2010 2020 1970 1980 1990 Calender year 2000 2010 2020 EU female
Lung LungBreast
Colorectum Prostate Pancreas Stomach Leukemias Colorectum Uterus Pancreas Stomach Leukemias
Figure 3. Age-standardized (world population) EU male and female cancer mortality in quinquennia from 1970–1974 to 2005–2009 and predicted rates for 2014. Men: stomach (squares), colorectum (circles), pancreas (triangles), lung (crosses), prostate (x’s) and leukemias (diamonds). Women: stomach (squares), colorectum (circles), pancreas (triangles), lung (crosses), breast (x’s), uterus (diamonds) and leukemias (inverted triangles).
avoided deaths in 2014. A substantial differential in cancer
mor-tality between western countries and the former nonmarket
economy ones of Central and Eastern Europe remains. This is at
least partly due to inadequate cancer management and therapy
in those areas of the continent [
23
,
34
], which require urgent
attention.
funding
This work was conducted with the contribution of the Swiss
League against Cancer, the Swiss Foundation for Research
against Cancer ( project No. 2437-08-2009) and the Italian
Association for Cancer Research (AIRC), project No. 10264.
This project was conducted within the COST Action (BM1214)
EU-Pancreas.
disclosure
The authors have declared no conflicts of interest.
references
1. World Health Organization Statistical Information System. WHO mortality database Available at: http://www.who.int/healthinfo/statistics/mortality_rawdata/en/index. html(30 May 2013, date last accessed).
2. Siegel R, Naishadham D, Jemal A. Cancer statistics, 2013. CA Cancer J Clin 2013; 63: 11–30.
3. Malvezzi M, Bertuccio P, Levi F et al. European cancer mortality predictions for the year 2013. Ann Oncol 2013; 24: 792–800.
4. Petersen GM, Boffetta P. Carcinogenesis of pancreatic cancer: challenges, collaborations, progress. Mol Carcinog 2012; 51: 1–2.
5. Ma J, Siegel R, Jemal A. Pancreatic cancer death rates by race among US men and women, 1970–2009. J Natl Cancer Inst 2013; 105: 1694–1700. 6. Cardin DB, Berlin JD. Pancreas cancer on the rise: are we up to the challenge? J
Natl Cancer Inst 2013; 105: 1675–1676.
7. Bosetti C, Bertuccio P, Negri E et al. Pancreatic cancer: overview of descriptive epidemiology. Mol Carcinog 2012; 51: 3–13.
8. Malvezzi M, Arfe A, Bertuccio P et al. European cancer mortality predictions for the year 2011. Ann Oncol 2011; 22: 947–956.
9. Malvezzi M, Bertuccio P, Levi F et al. European cancer mortality predictions for the year 2012. Ann Oncol 2012; 23: 1044–1052.
10. Doll R, Smith PG, Waterhouse JAH et al. Cancer incidence infive continents. Comparison between registries: age-standardized rates. IARC Sci Publ No. 42. 1982;IV:671–675.
11. Kim HJ, Fay MP, Feuer EJ et al. Permutation tests for joinpoint regression with applications to cancer rates. (Erratum in: Stat Med 2001;20: 655). Stat Med 2000; 19: 335–351.
12. Julian J Faraway. Linear Models with R. Texts in Statistical Science. Vol. 63. Boca Raton: Chapman & Hall/CRC. 2005.
13. European Commission. Eurostat population database. http://epp.eurostat.ec. europa.eu/portal/page/portal/population/data/database (19 October 2010, date last accessed). Pancreas EU 8 Men Women 6 4 2 0
Deaths per 100 000 population Deaths per 100 000 population
1970 1980 1990 2000 Calender year Men 25–49 years Men all ages
All ages and 25–49 years 50–64 years
Women 25–49 years Women all ages 25 20 15 10 5 0 2010 2020 1970 1980 1990 2000 Calender year 2010 2020
Figure 4. Annual pancreatic cancer age-standardized (world population) death rates in the EU per 100 000 for all ages, 25–49 and 50–64 years age groups from 1970 to 2009, the resulting joinpoint regression models, and predicted rates for the year 2014 with 95% prediction intervals. On the left, men all ages (full squares), men 25–49 (squares), women all ages (full circles) and women 25–49 (circles). On the right men 50–64 (squares) and women 50–64.
14. Ahmad OB, Boschi-Pinto C, Lopez AD et al. Age Standardization of Rates: a New WHO Standard. Geneva: World Health Organization, 2001.
15. Bosetti C, Malvezzi M, Rosso T et al. Lung cancer mortality in European women: trends and predictions. Lung Cancer 2012; 78: 171–178.
16. Malvezzi M, Bosetti C, Rosso T et al. Lung cancer mortality in European men: trends and predictions. Lung Cancer 2013; 80: 138–145.
17. Lortet-Tieulent J, Renteria E, Sharp L et al. Convergence of decreasing male and increasing female incidence rates in major tobacco-related cancers in Europe in 1988–2010. Eur J Cancer 2013 November 20 [epub ahead of print], doi: 10.1016/j.ejca.2013.10.014.
18. Bertuccio P, Chatenoud L, Levi F et al. Recent patterns in gastric cancer: a global overview. Int J Cancer 2009; 125: 666–673.
19. Malvezzi M, Bonifazi M, Bertuccio P et al. An age-period-cohort analysis of gastric cancer mortality from 1950 to 2007 in Europe. Ann Epidemiol 2010; 20: 898–905.
20. Ferro A, Peleteiro B, Malvezzi M et al. Worldwide trends in gastric cancer mortality (1980–2011), with predictions to 2015, and incidence by subtype. Int J Cancer 2014; 50: 1330–1334.
21. Fernandez E, La Vecchia C, Gonzalez JR et al. Converging patterns of colorectal cancer mortality in Europe. Eur J Cancer 2005; 41: 430–437.
22. Bertuccio P, Bosetti C, Malvezzi M et al. Trends in mortality from leukemia in Europe: an update to 2009 and a projection to 2012. Int J Cancer 2013; 132: 427–436. 23. Bosetti C, Bertuccio P, Malvezzi M et al. Cancer mortality in Europe, 2005–2009,
and an overview of trends since 1980. Ann Oncol 2013; 24: 2657–2671. 24. Bosetti C, Bertuccio P, Levi F et al. The decline in breast cancer mortality in
Europe: an update (to 2009). Breast 2012; 21: 77–82.
25. Gallus S, Lugo A, La Vecchia C et al. Pricing Policies And Control of Tobacco in Europe (PPACTE) project: cross-national comparison of smoking prevalence In 18 European countries. Eur J Cancer Prev 2014; 23: 177–185.
26. Duell EJ. Epidemiology and potential mechanisms of tobacco smoking and heavy alcohol consumption in pancreatic cancer. Mol Carcinog 2012; 51: 40–52.
27. Bracci PM. Obesity and pancreatic cancer: overview of epidemiologic evidence and biologic mechanisms. Mol Carcinog 2012; 51: 53–63.
28. Li D. Diabetes and pancreatic cancer. Mol Carcinog 2012; 51: 64–74. 29. Lucenteforte E, La Vecchia C, Silverman D et al. Alcohol consumption and
pancreatic cancer: a pooled analysis in the International Pancreatic Cancer Case-Control Consortium (PanC4). Ann Oncol 2012; 23: 374–382.
30. Turati F, Edefonti V, Bosetti C et al. Family history of cancer and the risk of cancer: a network of case-control studies. Ann Oncol 2013; 24: 2651–2656.
31. Klein AP. Genetic susceptibility to pancreatic cancer. Mol Carcinog 2012; 51: 14–24.
32. Fernandez E, La Vecchia C, Decarli A. Attributable risks for pancreatic cancer in northern Italy. Cancer Epidemiol Biomarkers Prev 1996; 5: 23–27.
33. Jemal A, Simard EP, Dorell C et al. Annual Report to the Nation on the Status of Cancer, 1975–2009, featuring the burden and trends in human papillomavirus (HPV)-associated cancers and HPV vaccination coverage levels. J Natl Cancer Inst 2013; 105: 175–201.
34. Lawler M, Duffy S, La Vecchia C et al. America’s cancer care crisis—is Europe any better? Lancet 2013; 382: 1628.
Annals of Oncology 25: 1656–1663, 2014 doi:10.1093/annonc/mdu187 Published online 14 May 2014
Phase I trial of olaparib in combination with cisplatin
for the treatment of patients with advanced breast,
ovarian and other solid tumors
J. Balmaña
1*, N. M. Tung
2, S. J. Isakoff
3, B. Graña
1, P. D. Ryan
3,†, C. Saura
1, E. S. Lowe
4,
P. Frewer
5, E. Winer
6, J. Baselga
7& J. E. Garber
61
University Hospital Vall d’Hebron and Vall d’Hebron Institute of Oncology (VHIO), Barcelona, Spain;2
Beth Israel Deaconess Medical Center, Boston;3
Massachusetts General Hospital, Boston;4
AstraZeneca, Wilmington, USA;5
AstraZeneca, Macclesfield, UK;6
Dana-Farber Cancer Institute, Boston;7
Memorial Sloan-Kettering Cancer Center, New York, USA
Received 3 January 2014; revised 17 March 2014 and 29 April 2014; accepted 29 April 2014
Background:
To establish the maximum tolerated dose, determine safety/tolerability and evaluate the pharmacokinetics and preliminary efficacy of olaparib in combination with cisplatin in patients with advanced solid tumors.Patients and methods:
Patients aged≥18 years with advanced solid tumors, who had progressed on standard treat-ment, were assigned to a treatment cohort and received oral olaparib [50–200 mg twice daily (bid); 21-day cycle] continu-ously or intermittently (days 1–5 or 1–10) in combination with cisplatin (60–75 mg/m2intravenously) on day 1 of each cycle.†Present address: Fox Chase Cancer Center, Philadelphia, USA.
*Correspondence to: Dr Judith Balmaña, University Hospital Vall d’Hebron, Vall d’Hebron Institute of Oncology (VHIO), Paseo Vall d’Hebron 119-129, Barcelona, Spain. Tel: +34-93-2746000; Fax: +34-93-2746059; E-mail: [email protected]
© The Author 2014. Published by Oxford University Press on behalf of the European Society for Medical Oncology. All rights reserved. For permissions, please email: [email protected].