The recent decline in mortality from Hodgkin lymphomas
in central and eastern Europe
C. Bosetti
1*, F. Levi
2, J. Ferlay
3, F. Lucchini
2, E. Negri
1& C. La Vecchia
1,41
Istituto di Ricerche Farmacologiche ‘‘Mario Negri,’’ Milan, Italy;2
Unite´ d’e´pide´miologie du cancer et Registres vaudois et neuchaˆtelois des tumeurs, Centre Hospitalier Universitaire Vaudois et Institut de me´decine sociale et pre´ventive, Universite´ de Lausanne, Lausanne, Switzerland;3
International Agency for Research on Cancer, Lyon, France;4
Istituto di Statistica Medica e Biometria ‘‘G.A. Maccacaro,’’ Universita` degli Studi di Milano, Milan, Italy
Received 7 April 2008; accepted 12 September 2008
Background:
Hodgkin lymphoma (HL) is a largely curable disease and its mortality had steadily declined in western Europe since the late 1960s. Only modest declines were, however, observed in central/eastern Europe.Materials and methods:
We updated trends in mortality from HL in various European areas up to 2004 and analyzed patterns in incidence for selected European countries providing national data.Results:
In most western European countries, HL mortality continued to steadily decline up to the mid 2000s. More recent reductions were also observed in eastern European countries. Overall, mortality from HL declined from 1.17/ 100 000 (age-standardized, world population) in 1980–1989 to 1.42/100 000 in 2000–2004 in men from the 15 member states of the European Union (EU) from western and northern Europe. In the EU 10 accession countries of central and eastern Europe, male mortality from HL was 1.42/100 000 in 1980–1984, 1.32 in 1990–1994, and declined to 0.76 in 2000–2004. Similar trends were observed in women. No consistent patterns were found for HL incidence.Conclusions:
The present work confirms the persistent declines in HL mortality in western European countries, and shows favorable patterns over more recent calendar years in central/eastern ones, where rates, however, are still at levels observed in western Europe in the early 1990s.Key words:
Europe, Hodgkin lymphoma, incidence, mortality, trendsintroduction
Advancements in integrated chemo- and radiotherapy over the
last four decades have made Hodgkin lymphoma (HL) a largely
curable disease, and its mortality rates had declined by >75% in
the United States, western Europe and Japan between the early
1960s and the late 1990s [1]. However, in former nonmarket
economy countries in central and eastern Europe, the fall in
rates was much smaller up to the late 1990s when mortality
from HL was over two-fold higher in those countries compared
with western Europe or the United States [1, 2].
To update trends in mortality from HL in various areas of
Europe, we have now considered HL mortality rates up to 2004.
We have also contrasted trends in incidence with those in
mortality for the 11 countries providing national data on
both incidence and mortality.
materials and methods
Official death certification data from HL for 26 European countries for the period 1980–2004 were derived from the World Health Organization (WHO) database available on electronic support [3].
Data for Croatia, the Czech Republic and Slovenia were available only since 1985 and data for Estonia, Lithuania and Slovakia since 1990. For Denmark, data were available only up to 2001, for Italy up to 2002 and for Luxemburg and Portugal up to 2003.
The European Union (EU 27) was defined as the 27 member states as since January 2007 (i.e. Austria, Bulgaria, the Czech Republic, Denmark, Estonia, Finland, France, Germany, Greece, Hungary, Ireland, Italy, Lithuania, Luxembourg, Malta, The Netherlands, Poland, Portugal, Romania, Slovakia, Slovenia, Spain, Sweden, UK), with the exclusion of Cyprus (data not available), Belgium and Latvia (data available only for a limited number of years). The 15 countries of the EU from western and northern Europe as before May 2004 with the exclusion of Belgium (EU 15, i.e. Austria, Denmark, Finland, France, Germany, Greece, Ireland, Italy, Luxembourg, The Netherlands, Portugal, Spain, Sweden, UK) and the 10 central and eastern accession countries in 2004 and 2007 with the exclusion of Latvia (EU 10, i.e., Bulgaria, the Czech Republic, Estonia, Hungary, Lithuania, Poland, Romania, Slovakia, and Slovenia) were also considered separately.
In the two decades considered, three different Revisions of the International classification of diseases (ICD) were used [4–6]. There were, however, no differences in coding and classification of HL across the three ICD Revisions.
Estimates of the resident population, based on official censuses, were obtained from the same WHO database [3]. From the matrices of certified deaths and resident populations, age-specific rates for each 5-year age group and calendar period were computed. Age-standardized rates per 100 000, at
original
article
*Correspondence to: Dr C. Bosetti, Istituto di Ricerche Farmacologiche ‘‘Mario Negri,’’
Via Giuseppe La Masa 19, 20156 Milan, Italy. Tel:0239014526; Fax:
+39-0233200231; E-mail: [email protected]
all ages and in various age groups, were computed using the direct method, based on the world standard population [7]. In a few countries, data were missing for part of one or more calendar years. No extrapolation was made for missing data.
Incidence data for 11 European countries providing national data were extracted from the successive volumes of Cancer Incidence in Five Continents [8]. Additional more recent information was found in various national cancer registry reports available in Internet [9–16].
results
Table 1 shows the age-adjusted death rates from HL per
100 000 men and women in selected European countries in
1980–1984, 1990–1994 and 2000–2004, and the
corresponding changes in rates. In most western European
countries, mortality from HL continued to steadily decline in
the last two decades. In proportional terms, the falls were
similar in the two subsequent decades, although in absolute
terms these were smaller over more recent calendar years. In
Bulgaria, Hungary and Romania, HL mortality was still
increasing between 1980–1984 and 1990–1994, but fell
thereafter, as in most other eastern European countries.
Overall, mortality from HL declined from 0.82/100 000 in
1990–1994 to 0.49 in 2000–2004 (240.2%) in men from
the EU 27 and from to 0.70/100 000 to 0.42 (240.0%) in
those from the EU 15. In men from the EU 10, the decline in
HL mortality was modest between 1980–1984 and 1990–1994
(27.0%, from 1.42/100 000 to 1.32), while it was larger
between 1990–1994 and 2000–2004 (242.4%). However, the
rate in the early 2000s (0.76/100 000) was still around the
level of the EU 15 in the 1990s. Similar patterns were
observed in women, whose mortality rates in 2000–2004
were the 0.31/100 000 in the EU 27 2000–2004, 0.26 in the
EU 15 and 0.48 in the EU 10. Thus, for both sexes the
highest mortality rates in 2000–2004 were in central and
eastern European countries, with the only exception of
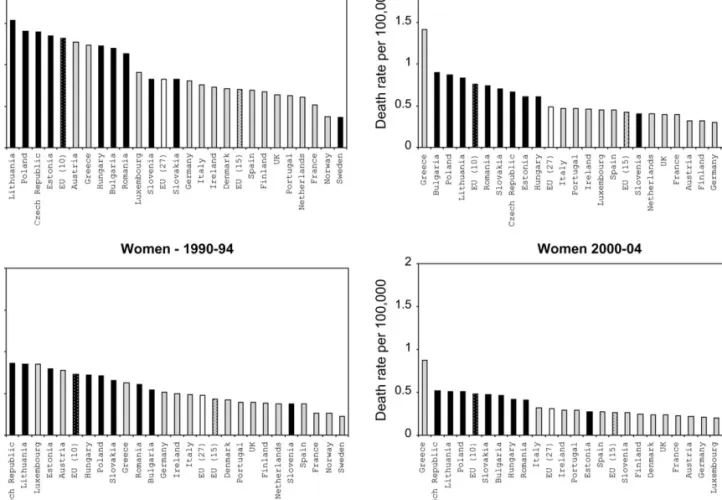
Slovenia (Figure 1).
The pattern of trends in young adults (aged 20–44 years)
across most European countries was similar to that of all ages
Table 1. Overall age-standardized (world population) mortality rates from Hodgkin lymphoma per 100 000 men and women in selected European countries in 1980–1984, 1990–1994 and 2000–2004 (unless mentioned in parentheses) and corresponding change in rates
Men Women
1980–1984 1990–1994 2000–2004 % Change % Change 1980–1984 1990–1994 2000–2004 % Change % Change
1992/1982 2002/1992 1992/1982 2002/1992 Austria 1.33 1.27 0.32 24.5 274.8 0.79 0.78 0.22 21.3 271.8 Bulgaria 1.02 1.20 0.90 17.6 225.0 0.47 0.54 0.46 14.9 214.8 Croatia – 0.78 0.45 – 242.3 – 0.49 0.29 – 240.8 Czech Republic – 1.39 0.66 – 252.5 – 0.86 0.52 – 239.5 Denmark (2000–2001) 1.05 0.71 0.24 232.4 266.2 0.50 0.42 0.24 216.0 242.9 Estonia – 1.35 0.61 – 254.8 – 0.79 0.27 265.8 Finland 1.39 0.67 0.32 251.8 252.2 0.68 0.38 0.25 244.1 234.2 France 0.88 0.51 0.39 242.0 223.5 0.49 0.26 0.23 246.9 211.5 Germany 1.42 0.80 0.30 243.7 262.5 0.81 0.51 0.21 237.0 258.8 Greece 1.26 1.23 1.41 22.4 14.6 0.56 0.63 0.87 12.5 38.1 Hungary 1.08 1.22 0.61 13.0 250.0 0.68 0.72 0.42 5.9 241.7 Ireland 1.49 0.73 0.46 251.0 237.0 0.88 0.50 0.29 5.9 241.7 Italy (2000–2002) 1.48 0.76 0.47 248.6 238.2 0.85 0.49 0.32 242.4 234.7 Lithuania (1993–1994) – 1.53 0.83 – 245.8 – 0.85 0.51 2 240.0 Luxembourg 0.98 0.91 0.45 27.14 250.5 0.88 0.85 0.20 – 276.5 Malta 1.94 0.85 0.43 256.2 249.4 1.19 0.59 0.61 250.4 3.4 The Netherlands 1.04 0.61 0.40 241.3 234.4 0.54 0.37 0.20 231.5 245.9 Norway 0.98 0.37 0.28 262.2 224.3 0.53 0.26 0.12 250.9 253.8 Poland (1995–1996,1999) 1.52 1.40 0.87 27.9 237.9 0.81 0.71 0.51 212.3 228.2 Portugal (2000–2003) 0.94 0.63 0.47 233.0 225.4 0.45 0.39 0.29 213.3 225.6 Romania 1.15 1.13 0.74 21.7 234.5 0.57 0.61 0.41 7.0 232.8 Slovakia (1992–1994) – 0.82 0.70 – 214.6 – 0.65 0.47 – 227.7 Slovenia – 0.82 0.40 – 251.2 – 0.37 0.26 – 229.7 Spain 0.97 0.69 0.45 228.9 234.8 0.49 0.37 0.27 224.5 227.0 Sweden 0.79 0.36 0.29 254.4 219.4 0.49 0.22 0.19 255.1 213.6 UK 1.05 0.64 0.39 239.0 239.1 0.57 0.39 0.24 231.6 238.5 European Union (27)a 1.20 0.82 0.49 231.7 240.2 0.66 0.48 0.31 227.3 235.4 European Union (15)b 1.17 0.70 0.42 240.2 240.0 0.65 0.43 0.26 233.9 239.5 European Union (10)c 1.42 1.32 0.76 27.0 242.4 0.79 0.73 0.48 27.6 234.2
aAs since January 2007 (with the exclusion of Belgium, Cyprus and Latvia). bAs before May 2004 (with the exclusion of Belgium).
(Table 2). However, in Poland and Romania, decreasing trends
were already observed between 1980–1984 and 1990–1994.
The different pattern in overall mortality from HL in the
EU 27, EU 15 and EU 10 is showed in Figure 2. Mortality
steadily declined in the EU 27 and EU 15 throughout the period
1980–2004, while in the EU 10 comparable reductions were
observed only after the mid 1990s.
Table 3 shows the age-standardized mortality rate from HL
per 100 000 men and women from the EU 27, the EU 15
and EU 10, in four age groups in the years 1980–1984,
1990–1994 and 2000–2004. In the EU 27 and EU 15, the
reductions in HL mortality between 1980–1984 and 1990–1994
were larger in the youngest age groups than in elderly
population, while this gradient with age was less evident
over recent calendar years. Similarly, in the EU 10 between
1980–1984 and 1990–1994, mortality started to decline first in
the younger age group, while upward trends were observed in
population aged 65 or more. Reductions similar to those
observed in the EU 15 between 1980–1984 and 1990–1994 were
observed in the EU 10 between 2000–2004 and 1990–1994.
Table 4 shows the age-standardized incidence rates from HL
in 11 European countries. Incidence in men showed no
consistent pattern across countries, with slight downward
trends, particularly in the last decade, in men from the Czech
Republic, Denmark, Ireland, Slovakia, Sweden and Scotland
and upward trends in The Netherlands and Norway. No
consistent patterns in incidence were observed in women too,
and if anything, slight upward trends were observed.
Figures 3 and 4 contrast trends in age-adjusted mortality and
incidence rates from HL in men and women from 11 European
countries providing also incidence data. Mortality consistently
decreased in all countries considered, although in most
countries mainly from northern Europe the decline tended to
slow down in most recent years. The pattern of HL incidence
was less clear, with no consistent trends in various calendar
years, across the countries examined and between sexes.
discussion
The present report shows that the decline in the mortality from
HL observed in western and northern Europe since the 1960s
has continued over more recent calendar years [1]. More
important, over the last years, HL mortality has started to
decline also in the EU 10 accession countries from central and
eastern Europe, which were characterized by unfavorable trends
up to the 1990s. The mortality rates of the EU 10 countries in
Figure 1. Age-standardized (world population) mortality rates from Hodgkin lymphoma per 100 000 men and women in selected European countries in 1990–1994 and 2000–2004. EU 27: European Union as since January 2007 (with the exclusion of Belgium, Cyprus and Latvia); EU 15; 15 countries of the European Union from western and northern Europe as before May 2004 (with the exclusion of Belgium); EU 10: 10 central and eastern countries which entered the European Union in 2004 and 2007 (with the exclusion of Latvia).
Table 2. Age-standardized (world population) mortality rates from Hodgkin lymphoma per 100 000 men and women aged 20–44 years in selected European countries in 1980–1984, 1990–1994 and 2000–2004 (unless mentioned in parentheses) and corresponding change in rates
Men Women
1980–1984 1990–1994 2000–2004 % Change % Change 1980–1984 1990–1994 2000–2004 % Change % Change
1992/1982 2002/1992 1992/1982 2002/1992 Austria 1.52 0.77 0.22 249.3 271.4 0.82 0.70 0.19 214.6 272.9 Bulgaria 1.13 1.40 1.09 23.9 222.1 0.46 0.60 0.53 30.4 211.7 Croatia – 0.66 0.37 – 243.9 – 0.56 0.38 – 232.1 Czech Republic – 1.01 0.51 – 249.5 – 0.85 0.50 – 241.2 Denmark (2000–2001) 1.13 0.65 0.04 242.5 293.8 0.51 0.34 0.24 233.3 229.4 Estonia – 1.82 0.80 – 256.0 – 0.93 0.18 – 280.6 Finland 1.33 0.71 0.27 246.6 262.0 0.57 0.28 0.32 250.9 14.3 France 0.95 0.52 0.37 245.3 228.8 0.64 0.33 0.24 248.4 227.3 Germany 1.25 0.67 0.22 246.4 267.2 0.71 0.44 0.18 238.0 259.1 Greece 0.92 0.78 0.64 215.2 217.9 0.60 0.40 0.47 233.3 17.5 Hungary 0.98 1.21 0.62 23.5 248.8 0.77 0.64 0.48 216.9 225.0 Ireland 1.38 0.73 0.21 247.1 271.2 0.73 0.43 0.25 216.9 225.0 Italy (2000–2002) 1.28 0.67 0.36 247.7 246.3 0.93 0.53 0.38 243.0 228.3 Lithuania (1993–1994) – 1.54 0.88 – 242.9 – 1.07 0.72 – 232.7 Luxembourg 0.53 0.60 0.52 – 213.3 1.11 1.31 0.00 18.0 2100.0 Malta 1.28 0.40 0.41 268.8 2.5 0.75 0.00 1.06 2100.0 The Netherlands 0.95 0.55 0.30 242.1 245.5 0.57 0.42 0.18 226.3 257.1 Norway 0.82 0.26 0.15 268.3 242.3 0.44 0.33 0.08 225.0 275.8 Poland (1995–1996,1999) 1.37 1.17 0.72 214.6 238.5 0.86 0.75 0.52 212.8 230.7 Portugal (2000–2003) 0.87 0.76 0.50 212.6 234.2 0.53 0.37 0.30 230.2 218.9 Romania 1.19 1.17 0.65 21.7 244.4 0.73 0.72 0.49 21.4 231.9 Slovakia (1992–1994) – 0.90 0.50 – 244.4 – 0.39 0.42 – 7.7 Slovenia – 0.47 0.26 – 244.7 – 0.39 0.28 – 228.2 Spain 0.93 0.65 0.41 230.1 236.9 0.57 0.36 0.28 236.8 222.2 Sweden 0.64 0.36 0.18 243.8 250.0 0.40 0.14 0.18 265.0 28.6 UK 1.24 0.73 0.37 241.1 249.3 0.71 0.52 0.27 226.8 248.1 European Union (27)a 1.14 0.76 0.41 233.3 246.1 0.71 0.49 0.31 231.0 236.7 European Union (15)b 1.12 0.65 0.34 242.0 247.7 0.69 0.43 0.26 237.7 239.5 European Union (10)c 1.28 1.12 0.65 212.5 242.0 0.84 0.73 0.50 213.1 231.5
aAs since January 2007 (with the exclusion of Belgium, Cyprus and Latvia). bAs before May 2004 (with the exclusion of Belgium).
cCentral and eastern countries which entered the European Union in 2004 and 2007 (with the exclusion of Latvia).
Men 0 0.5 1 1.5 2 2.5 1980-84 1985-89 1990-94 1995-99 2000-04 Calendar period
Death rate per 100,000
EU (27) EU (15) EU (10) Women 0 0.5 1 1.5 2 2.5 1980-84 1985-89 1990-94 1995-99 2000-04 Calendar period
Death rate per 100,000
EU (27) EU (15) EU (10)
Figure 2. Trends in age-standardized (world population) mortality rates from Hodgkin lymphoma per 100 000 men and women in the European Union (EU), the EU 15 and the EU 10. EU 27: European Union as since January 2007 (with the exclusion of Belgium, Cyprus and Latvia); EU 15; 15 countries of the European Union from western and northern Europe as before May 2004 (with the exclusion of Belgium); EU 10: 10 central and eastern countries which entered the European Union in 2004 and 2007 (with the exclusion of Latvia).
the early 2000s were, however, still higher than those of the EU
15 ones and were comparable to those observed in the EU 15
countries almost a decade earlier.
HL incidence showed no consistent patterns, with stable or
slightly downward trends in men and less favorable ones in
women [17, 18]. This indicates that no important new causes of
HL have been introduced on population level over the last few
decades.
The dynamic and evolving classification of lymphomas and
the consequent changes in HL registration may have had some
contribution in temporal trends [19, 20]. However, the absence
of appreciable changes in incidence suggests that they are
unlikely to appreciably account for such generalized favorable
trend in HL mortality observed in European countries, as well
as other areas of the world.
The persistence of favorable trends in HL mortality in
countries from western and northern Europe indicates,
therefore, that advancements in diagnosis and treatment for
these neoplasms—with a consequent favorable impact on
survival [17, 18]—are still in course. During the past two
decades, staging by means of laparotomy and splenectomy has
been abandoned, and new and better methods have been
introduced, including the use of a more sensitive metabolic
imaging technique, the positron emission tomography with
Table 3. Age-standardized (world population) mortality rate from Hodgkin lymphoma per 100 000 men and women in the European Union as since January 2007 (EU 27), in the EU as before May 2004 (EU 15) and in 10 countries which entered the EU in 2004 and 2007 (EU 10), in four age groups in 1980–1984, 1990–1994 and 2000–2004 Age group (years) Men Women 1980– 1984 1990– 1994 2000– 2004 % Change 1992/1982 % Change 2002/1992 1980– 1984 1990– 1994 2000– 2004 % Change 1992/1982 % Change 2002/1992 EU (27)a 0–19 0.17 0.10 0.05 241.2 250.0 0.10 0.07 0.05 230.0 228.6 20–44 1.14 0.76 0.41 233.3 246.1 0.71 0.49 0.31 231.0 236.7 45–64 2.31 1.53 0.84 233.8 245.1 1.06 0.73 0.42 231.1 242.5 ‡65 4.33 3.31 2.42 223.6 226.9 2.57 2.11 1.45 217.9 231.3 EU (15)b 0–19 0.14 0.06 0.05 257.1 216.7 0.08 0.05 0.04 237.5 220.0 20–44 1.12 0.65 0.34 242.0 247.7 0.69 0.43 0.26 237.7 239.5 45–64 2.23 1.26 0.68 243.5 246.0 1.03 0.61 0.34 240.8 244.3 ‡65 4.46 3.10 2.24 230.5 227.7 2.65 2.03 1.34 223.4 234.0 EU (10)c 0–19 0.21 0.12 0.06 242.9 250.0 0.16 0.12 0.05 225.0 258.3 20–44 1.28 1.12 0.65 212.5 242.0 0.84 0.73 0.50 213.1 231.5 45–64 3.11 2.83 1.42 29.0 249.8 1.33 1.23 0.71 27.5 242.3 ‡65 4.44 5.09 3.44 14.6 232.4 2.62 2.84 2.15 8.4 224.3
aWith the exclusion of Belgium, Cyprus and Latvia. bWith the exclusion of Belgium.
cWith the exclusion of Latvia.
Table 4. Age-standardized (world population) incidence rates from Hodgkin lymphoma per 100 000 men and women in selected European countries in 1980–1984, 1990–1994 and 2000–2004 (unless mentioned in parentheses) and the corresponding change in rates
Men Women
1980–1984 1990–1994 2000–2004 % Change % Change 1980–1984 1990–1994 2000–2004 % change % change
1992/1982 2002/1992 1992/1982 2002/1992 Czech Republic (1983–1984, 2000–2003) 3.12 2.93 2.40 2.4 218.1 2.03 2.45 1.98 20.7 219.2 Denmark (2000–2003) 2.76 2.57 2.43 26.9 25.4 1.71 1.67 1.87 22.3 12.0 Finland 2.72 2.68 2.76 21.5 3.0 1.59 1.92 2.10 20.8 9.4 Ireland (1994) – 2.55 2.37 – 27.1 – 1.89 1.91 – 1.1 The Netherlands (2000–2003) – 2.40 2.56 – 6.7 – 1.77 1.82 – 2.8 Norway 2.32 2.13 2.71 28.2 27.2 1.48 1.40 1.87 25.4 33.6 Slovakia (1983–1984, 2000–2003) 2.40 2.70 1.92 12.5 228.9 1.53 1.79 2.06 17.0 15.1 Slovenia (1983–1984) 2.53 2.22 2.36 212.3 6.3 1.34 1.74 2.09 29.9 20.1 Sweden 1.99 1.95 1.76 22.0 29.7 1.23 1.46 1.69 18.7 15.8 UK, England 2.76 2.45 2.58 211.2 5.3 1.71 1.71 1.86 0.0 8.8 UK, Scotland 2.99 2.81 2.68 26.0 24.6 1.99 1.94 2.25 22.5 16.0
18
F-fluorodeoxyglucose as a tracer [21, 22]. Treatment of the
disease has also improved, through advancements in
combined radiotherapy and chemotherapy. Moreover,
prognostic factors have been identified which impact
survival and may help tailoring the treatments [23–25].
More important, the recent favorable patterns in central
and eastern Europe indicate that—after substantial
delays—progresses in the treatment of HL have also been
made in those countries. However, the persistence of higher
rates in eastern as compared with western European countries
indicates that there is still scope for advancements in HL
control and treatment in those countries, simply by
widespread adoption of available and up to date medical
treatment and/or radiotherapy. As for other lymphoid
Figure 3. Trends in age-standardized (world population) mortality and incidence rates from Hodgkin lymphoma per 100 000 men in 11 Northern and Eastern European countries between 1980 and 2004 (incidence; mortality).
neoplasms [26], this has to be extended in middle-aged and
elderly individuals, too, since the difference in mortality
between western and central/eastern European countries is
greater in those age groups.
Thus, the present work confirms the persistent favorable
trends in HL mortality in western European countries and
indicates recent improvements in central/eastern European
countries, though the gap in HL mortality across various areas
of Europe is still considerable and calls for urgent interventions
to control this largely avoidable cause of death.
funding
Italian and Swiss Leagues Against Cancer; the Swiss Foundation
for Research Against Cancer; the Italian Association for Cancer
Research.
Figure 4. Trends in age-standardized (world population) mortality and incidence rates from Hodgkin lymphoma per 100 000 women in 11 Northern and Eastern European countries between 1980 and 2004 (incidence; mortality).
acknowledgements
The work of this paper was undertaken while CLV was a senior
fellow at the International Agency for Research on Cancer. The
authors thank Mrs I. Garimoldi for editorial assistance.
references
1. Levi F, Lucchini F, Negri E et al. Trends in mortality from Hodgkin’s disease in western and eastern Europe. Br J Cancer 2002; 87: 291–293.
2. Bosetti C, Bertuccio P, Levi F et al. Cancer mortality in the European Union, 1970–2003, with a joinpoint analysis. Ann Oncol 2008; 19: 631–640. 3. World Health Organization Statistical Information System. WHO Mortality
Database. 2007 http://www3.who.int/whosis/menu.cfm (accessed November 2007).
4. World Health Organization. International Classification of Disease: 8th revision. Geneva: World Health Organization 1967.
5. World Health Organization. International Classification of Disease: 9th revision. Geneva: World Health Organization 1977.
6. World Health Organization. International Statistical Classification of Disease and related Health Problems: 10th revision. Geneva: World Health Organization 1992.
7. Doll R, Smith PG. Comparison between registries: age-standardized rates. Vol. IV. IARC Sci Publ No. 42. In Waterhouse JAH, Muir CS, Shanmugaratnam K et al. (eds): Cancer Incidence in Five Continents. Lyon: IARC 1982; 671–675. 8. Parkin DM, Whelan SL, Ferlay J, Storm H. Cancer Incidence in Five Continents.
Volume I to VIII. [Cancer base No.7]. Lyon, France: International Agency for Research on Cancer 2005.
9. Engholm G, Storm HH, Ferlay J et al. NORDCAN: Cancer Incidence and Mortality in the Nordic Countries, Version 3.0. Association of Nordic Cancer Registries. Danish Cancer Society. 2007 http://www.ancr.nu (accessed September 2007). 10. Swedish Cancer Registry. http://www.socialstyrelsen.se/ (accessed October
2006).
11. Information Services Division (ISD). www.isdscotland.org (accessed April 2007). 12. National Statistics. http://www.statistics.gov.uk (accessed April 2007).
13. Dutch Comprehensive Cancer Centres. http://www.iKCnet.nl (accessed October 2006).
14. Institute of Oncology Ljubljana. http://www.onko-i.si/en/sectors_of_the_ institute_of_oncology/epidemiolog/ (accessed September 2007).
15. National Cancer Registry Ireland. http://www.ncri.ie/ncri (accessed February 2008).
16. Ondrusova M, Plesko I, Safaei-Diba Ch et al. Comprehensive Analysis of Incidence and Mortality in the Slovak Republic, 1978–2003. Bratislaba: National Health Information Center of the Slovak Republic, [cit. 2007-10-01] 2007 http:// www-nor-sk.org (accessed September 2007).
17. Adamson P, Bray F, Costantini AS et al. Time trends in the registration of Hodgkin and non-Hodgkin lymphomas in Europe. Eur J Cancer 2007; 43: 391–401.
18. Karim-Kos HE, de Vries E, Soerjomataram I et al. HLA class II expression by Hodgkin Reed-Sternberg cells is an independent prognostic factor in classical Hodgkin’s lymphoma. Eur J Cancer 2008.
19. Gil-Delgado MA, Khyat D, Johnson SAN. Chapter 30. Lymphomas. In Pollock RE (ed): UICC Manual of Clinical Oncology, Eighth Edition. Hoboken, New Jersey: John Wiley & Sons, Inc 2004; 671–689.
20. Mueller NE, Grufferman S. Hodgkin lymphoma. In Schottenfeld D, Fraumeni JF (eds): Cancer Epidemiology and Prevention, 3rd edition. New York: Oxford University Press 2006; 872–897.
21. Diehl V. Hodgkin’s disease—from pathology specimen to cure. N Engl J Med 2007; 357: 1968–1971.
22. Cheson BD, Pfistner B, Juweid ME et al. Revised response criteria for malignant lymphoma. J Clin Oncol 2007; 25: 579–586.
23. Ferme´ C, Eghbali H, Meerwaldt JH et al. Chemotherapy plus involved-field radiation in early-stage Hodgkin’s disease. N Engl J Med 2007; 357: 1916–1927.
24. Maucort-Boulch D, Djeridane M, Roy P et al. Predictive and discriminating three-risk-group prognostic scoring system for staging Hodgkin lymphomas. Cancer 2007; 109: 256–264.
25. Han X, Kilfoy B, Zheng T et al. Lymphoma survival patterns by WHO subtype in the United States, 1973–2003. Cancer Causes Control 2008.
26. Levi F, Lucchini F, Negri E et al. Trends in mortality from leukemia in subsequent age groups. Leukemia 2000; 14: 1980–1985.