European cancer mortality predictions for the year 2011
M. Malvezzi
1,2,3, A. Arfe´
1, P. Bertuccio
1,2, F. Levi
4, C. La Vecchia
1,2* & E. Negri
11
Department of Epidemiology, Istituto di Ricerche Farmacologiche ‘Mario Negri’, Milan;2
Department of Occupational Health, Section of Medical Statistics, University of Milan, Milan;3Department of Medical Statistics, Biometry and Bioinformatics, National Tumor Institute, Milan, Italy;4Cancer Epidemiology Unit and Vaud and Neuchaˆtel Cancer Registries, Institute of Social and Preventive Medicine, Centre Hospitalier Universitaire Vaudois and University of Lausanne, Lausanne, Switzerland
Received 14 December 2010; accepted 21 December 2010
Background:
Mortality figures become available after some years.Materials and methods:
Using the World Health Organization mortality and population data, we estimated numbers of deaths in 2011 from all cancers and selected sites for the European Union (EU) and six major countries, by fitting a joinpoint model to 5-year age-specific numbers of deaths. Age-standardized rates were computed using EUROSTAT population estimates.Results:
The predicted number of cancer deaths in the EU in 2011 was 1 281 436, with standardized rates of 143/ 100 000 men and 85/100 000 women. Poland had the highest rates, with smaller falls over recent periods. Declines in mortality for major sites including stomach, colorectum, breast, uterus, prostate and leukemias, plus male lung cancer, will continue until 2011, and a trend reversal or a leveling off is predicted where upward trends were previously observed. Female lung cancer rates are increasing in all major EU countries except the UK, where it is the first cause of cancer death, as now in Poland. The increasing pancreatic cancer trends in women observed up to 2004 have likely leveled off.Conclusions:
Despite falls in rates, absolute numbers of cancer deaths are stable in Europe. The gap between Western and former nonmarket economy countries will likely persist.Key words:
cancer, Europe, mortality, projections, time trendsintroduction
Estimates of current cancer mortality, in terms of absolute
numbers and of rates, are essential for planning resource
allocation and designing and evaluating cancer prevention and
management strategies. However, mortality figures generally
only become available after a few years [1]. A reliable system to
estimate current mortality statistics is of considerable interest
and has been developed for USA data [2, 3]. The scope of this
work is to present estimates of mortality for all cancers and for
selected major cancer sites in the year 2011 in the whole
European Union (EU) and in its six more populated countries,
using actual mortality data up to the most recent available year,
which is between 2005 and 2007 for most EU countries.
materials and methods
We obtained from the World Health Organization (WHO) database (WHO Statistical Information System) [4], official death certification data from stomach, intestines (colon and rectum), pancreas, lung, breast, uterus (cervix and corpus), prostate, leukemias and total cancer for the EU in the period 1970–2007 and up to the most recent available year for six EU countries: France (2007), Germany (2006), Italy (2007), Poland (2008), Spain (2005)
and the UK (2007). The EU was defined as the 27 member states as of January 2007. Data for Cyprus were not available. For the calculation of the EU rates, when data were not available for a country, the nearest available data were replicated (see supplemental Appendix 1, available at Annals of Oncology online).
No interpolation was made for individual countries for missing data except for the construction of the EU rates.
During the calendar period considered, three different revisions of the International Classification of Diseases (ICD) were used. Cancer deaths were recoded according to the 10th revision of the ICD [5]: stomach cancer (C16), intestinal (mainly colon and rectum) cancer (C17–C21, C26), pancreas (C25), lung (C34), breast (C50), uterus (cervix and corpus; C53–C55, C58), prostate (C61), leukemias (C91–C95) and total cancers (C00–D48).
Estimates of the resident population were obtained from the same WHO database. Population projection estimates for the year 2011 were obtained from EUROSTAT [6].
We computed age-specific rates and numbers of deaths for each 5-year age group (from 0–4 to 80+ years) and calendar year. Age-standardized rates, per 100 000 men and women, at all ages, were computed using the direct method, on the basis of the world standard population [7].
Joinpoint models were fitted to the logarithm of each 5-year age-specific number of deaths, assuming a Poisson distribution, in order to identify the most recent trend segment. The joinpoint model was set to a maximum of five identifiable segments (four joinpoints) and to have at least five data points for the last segment [8].
A linear regression was carried out on mortality data from each age group over the time period identified by the joinpoint model, in order to compute the predicted age-specific numbers of deaths, the corresponding 95% confidence intervals (CIs) and prediction intervals (PIs; i.e. the CIs for the
original
article
*Correspondence to: Prof. C. La Vecchia, Department of Epidemiology, Istituto di Ricerche Farmacologiche ‘Mario Negri’, Via Giuseppe La Masa 19, 20156 Milan, Italy. Tel:+39-02-39-01-4527; Fax: +39-02-33-200-231;
E-mail: carlo.lavecchia@marionegri.it
prediction of a single future value, calculated using a standard error accounting for the variability of the new observation) [9]. Using the projected EUROSTAT population data, we computed predicted specific and age-standardized death rates (world population) with 95% CI and PI.
results
The prediction method was tested by estimating the last calendar
year available using data from up to 4 years earlier (supplemental
Appendix 1, supplemental Tables A1–A7, available at Annals of
Oncology online). Real values for total numbers of deaths and
standardized rates were within the modeled 95% PI with very
few exceptions; in the EU (2007 data), falls in death rates for
gastric and intestinal cancer in women were overestimated, as for
stomach cancer in both sexes in the UK.
Tables 1–7 show the total numbers of predicted deaths and
standardized death rates in 2011 for the studied neoplasms with
95% PI and CI, in the whole EU and the six largest EU countries.
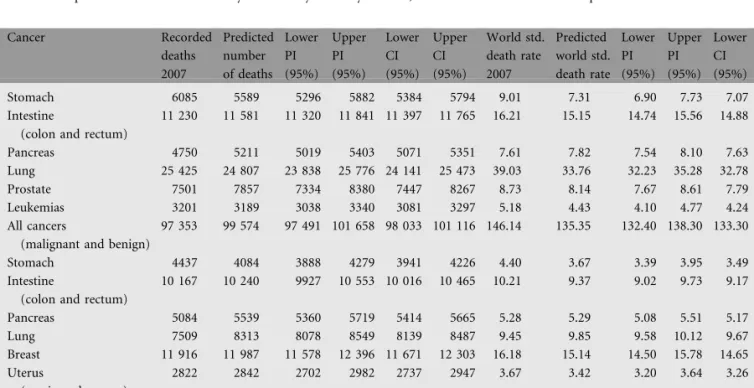
Figure 1 shows total cancer death standardized rate trends,
for European men and women, for the central years of
quinquennia (1982–2007) and the predicted rates in 2011.
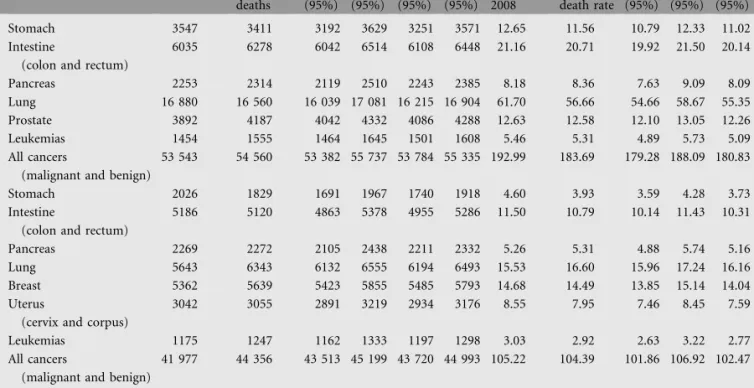
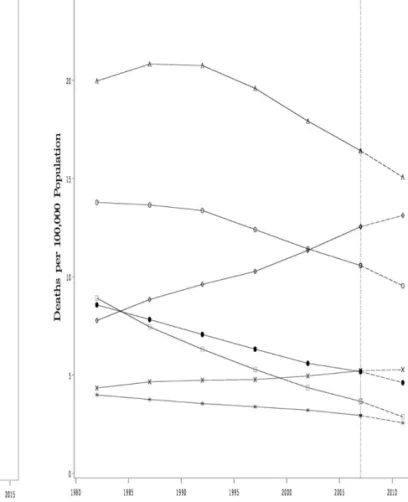
Figures 2 and 3 show standardized trends in death rates for the
examined cancer sites in men and women, respectively.
The predicted total number of cancer deaths in the EU in 2011
is 1 281 436 (721 252 men and 560 184 women), as compared
with 1 256 001 (703 872 men and 552 129 women), in 2007. The
estimated standardized total cancer death rates in 2011 are
142.8/100 000 men and 85.3/100 000 women, compared with
153.8/100 000 men and 90.7/100 000 women. This would
correspond to a 7% fall in men and a 6% one in women. In men,
lung cancer accounts for the most deaths (182 080 deaths, 25%
of total male cancer deaths) with standardized rate of 37.6/
100 000, 9% lower than the rate recorded in 2007. In women, the
favorable total cancer trends are mainly driven by falls in breast
cancer mortality (the first cause of female cancer deaths, making
up for 16% of total cancer mortality with 87 843 deaths and
a standardized rate of 15.1/100 000 women), colorectal (73 721
deaths, 9.5/100 000 women) and stomach (21 370 deaths, 2.9/
100 000 women) cancers. These downward trends in rates were
reflected in all the examined cancer sites except for pancreatic
cancer, stable in men (37 587 deaths, 7.8/100 000 men) and
recording a slight rise in women (37 120 deaths, 5.3/100 000
women), and female lung cancer, which rose from 12.6/100 000
women in 2007 to 13.1/100 000 (75 688 deaths) in 2011.
Figure 4 shows bar plots of standardized death rates per
100 000 population for the year 2007 and the predicted rates for
2011 with 95% PIs for the EU in men and women for the
studied cancer sites.
Figure 5 shows bar plots of standardized death rates per
100 000 population and certified deaths for the year 2007 and
the predicted rates and number of deaths for 2011 with 95% PIs
for total cancer mortality in the EU in men and women.
The predicted total cancer standardized mortality rate for
2011 showed favorable trends for all the studied countries in
both sexes. The highest rates were in Poland for both sexes,
falling 5% to 183.7/100 000 in men since 2008 and 1% to
104.4/100 000 in women. Total male cancer rates were also
higher than the overall EU ones in Spain (145.5/100 000 men,
7% fall since 2005) and France (151.4/100 000 men, 6% fall
since 2007). Germany, Italy and the UK have predicted male
total cancer mortality rates lower than the EU ones, with
Germany and the UK having the lowest at 125.1 and 126.4 per
100 000 men, displaying 10% and 8% falls since 2006 and 2007,
respectively. Conversely, total female cancer mortality rates in
the UK are high compared with the EU and the other studied
countries (with the exception of Poland), but they fell 8%, with
a predicted rate of 95.6/100 000 women in 2011. France,
Germany and Italy all had female rates that were lower, but
comparable with those in the EU (between 79 and 86 per
100 000 women), while Spain had sensibly lower female rates,
falling 8% since 2005 and reaching 65.9/100 000 women.
Stomach cancer mortality rates were again the highest in Poland
(11.6/100 000 men and 3.9/100 000 women), with rates being
fourfold higher than the lowest seen in UK males (3.1/100 000
men) and threefold those in UK females (1.3/100 000 women).
Poland had the highest intestinal cancer mortality rates
(20.7/100 000 men and 10.8/100 000 women). In men, the
lowest rates were in France (13.9/100 000 men), while Germany
had the lowest female predicted rates (7.9/100 000 women).
Pancreatic cancer mortality rates in males varied between 6.4
and 8.4 per 100 000 men and between 3.7 and 5.8 per 100 000
women. In men, age-standardized rates for this neoplasm
remained stable compared with the last recorded data. In
women, the trend was approximately stable, with the exception
of Spain that recorded a slight fall reaching the lowest female
rate of 3.7/100 000 women and France where the rate increased
by almost 8% (up to 5.3/100 000 women).
Male lung cancer rates had favorable trends in all the studied
countries, with estimated rates varying between 56.7/100 000 in
Poland and 28.3/100 000 in the UK. Conversely, in women, rising
trends were observed in all countries with the exception of the UK
that had the highest at 20.3/100 000 women, over threefold higher
than the lowest estimated rate for Spain (6.5/100 000 women).
Estimated female breast cancer rates all resulted in falling
trends. The highest rates were in the UK (17.2/100 000 women)
and the lowest ones in Spain (11.3/100 000 women).
Estimated mortality rates for cancer of the uterus in Poland
were three times higher than the lowest rates projected for
Germany, 7.9 and 2.6 per 100 000 women, respectively. The
remaining countries and the EU showed values between 3.4 and
4.6/100 000 women. Estimated rates showed favorable changes
in all countries.
Prostate cancer estimated mortality rates for 2011 varied
between 12.6 and 8.1/100 000 men with the highest being in
Poland and the UK while the lowest ones were in Italy. The trend
for this cancer was also favorable in all the studied countries.
Predicted mortality rates for leukemias for Poland were
higher than the other countries in both men (5.3/100 000) and
women (2.9/100 000), while for Spain they were lower (3.6/100
000 men and 1.8/100 000 women). In the remaining countries
and the EU, rates varied between 3.9 and 4.6 per 100 000 in
men and 2.4 and 2.6 per 100 000 in women. All the estimated
rates were lower than those recorded in the last available year.
discussion
Albeit these are short-term predictions and therefore no major
unexpected event should affect them, it is still possible that
Table 1. Number of predicted deaths and mortality rate in the EU for the year 2011, with 95% PIs and CIs and comparison data from 2007
Sex Cancer Recorded
deaths 2007 Predicted number of deaths Lower PI (95%) Upper PI (95%) Lower CI (95%) Upper CI (95%) World std. death rate 2007 Predicted world std. death rate Lower PI (95%) Upper PI (95%) Lower CI (95%) Upper CI (95%) Men Stomach 37 416 34 526 33 883 35 169 34 103 34 949 8.07 6.75 6.62 6.88 6.67 6.83 Intestine
(colon and rectum)
84 480 88 305 87 185 89 426 87 548 89 062 17.66 16.80 16.57 17.04 16.65 16.96 Pancreas 34 714 37 587 37 150 38 025 37 287 37 887 7.84 7.84 7.74 7.94 7.77 7.91 Lung 182 132 182 080 179 006 185 153 180 114 184 045 41.31 37.55 36.84 38.26 37.10 38.00 Prostate 67 959 69 453 68 007 70 899 68 418 70 488 12.00 10.97 10.76 11.18 10.83 11.12 Leukemias 21 603 22 302 21 724 22 880 21 843 22 760 4.86 4.40 4.24 4.56 4.32 4.49 All cancers
(malignant and benign)
703 872 721 252 712 863 729 640 715 740 726 764 153.75 142.79 141.09 144.50 141.71 143.87
Women Stomach 24 924 21 370 20 689 22 051 20 919 21 821 3.66 2.87 2.76 2.98 2.81 2.93
Intestine
(colon and rectum)
75 189 73 721 72 856 74 585 73 143 74 299 10.57 9.54 9.40 9.68 9.46 9.62
Pancreas 34 590 37 120 36 461 37 778 36 635 37 604 5.21 5.27 5.18 5.37 5.20 5.35
Lung 68 553 75 688 74 502 76 873 74 762 76 614 12.55 13.12 12.87 13.37 12.92 13.32
Breast 88 655 87 843 86 540 89 146 86 907 88 779 16.41 15.07 14.83 15.30 14.90 15.23
Uterus
(cervix and corpus)
27 268 26 181 25 651 26 710 25 780 26 582 5.17 4.61 4.50 4.72 4.52 4.69
Leukemias 17 803 18 285 17 871 18 699 18 007 18 563 2.94 2.56 2.43 2.69 2.51 2.62
All cancers (malignant and benign)
552 199 560 184 555 169 565 200 556 489 563 880 90.72 85.33 84.54 86.13 84.75 85.92
EU, European Union; PI, prediction interval; CI, confidence interval; std., standardized.
Table 2. Number of predicted deaths and mortality rate in France for the year 2011, with 95% PIs and CIs and comparison data from 2007
Sex Cancer Recorded
deaths 2007 Predicted number of deaths Lower PI (95%) Upper PI (95%) Lower CI (95%) Upper CI (95%) World std. death rate 2007 Predicted world std. death rate Lower PI (95%) Upper PI (95%) Lower CI (95%) Upper CI (95%) Men Stomach 3025 2957 2831 3083 2868 3046 5.10 4.61 4.37 4.85 4.44 4.77 Intestine
(colon and rectum)
9758 9755 9388 10 121 9496 10 014 15.45 13.95 13.35 14.56 13.54 14.37 Pancreas 4431 4737 4572 4901 4633 4841 7.93 7.83 7.55 8.10 7.66 7.99 Lung 22 144 23 608 22 942 24 274 23 105 24 111 42.10 41.22 39.81 42.62 40.12 42.32 Prostate 9033 8859 8435 9284 8549 9170 11.74 10.27 9.68 10.85 9.84 10.70 Leukemias 3051 3164 2983 3346 3040 3289 5.03 4.61 4.34 4.88 4.45 4.77 All cancers
(malignant and benign)
92 425 95 649 93 631 97 667 94 084 97 214 160.40 151.42 147.47 155.38 148.33 154.52
Women Stomach 1659 1514 1377 1652 1418 1610 1.78 1.66 1.51 1.81 1.57 1.75
Intestine
(colon and rectum)
8637 8769 8374 9164 8476 9062 8.88 8.39 7.90 8.87 8.01 8.76
Pancreas 4192 4745 4540 4950 4591 4899 4.92 5.29 5.09 5.49 5.15 5.44
Lung 6497 7718 7376 8060 7445 7991 10.14 11.66 11.00 12.32 11.12 12.20
Breast 11 379 11 661 11 280 12 042 11 403 11 918 16.67 16.07 15.48 16.65 15.70 16.43
Uterus
(cervix and corpus)
3115 3143 3015 3271 3055 3231 4.30 4.08 3.86 4.31 3.94 4.23
Leukemias 2466 2526 2388 2663 2432 2619 2.91 2.52 2.30 2.74 2.41 2.63
All cancers
(malignant and benign)
63 711 66 710 65 498 67 922 65 785 67 635 80.60 79.78 77.87 81.68 78.26 81.30
Table 3. Number of predicted deaths and mortality rate in Germany for the year 2011, with 95% PIs and CIs and comparison data from 2005
Sex Cancer Recorded
deaths 2006 Predicted number of deaths Lower PI (95%) Upper PI (95%) Lower CI (95%) Upper CI (95%) World std. death rate 2006 Predicted world std. death rate Lower PI (95%) Upper PI (95%) Lower CI (95%) Upper CI (95%) Men Stomach 5986 5075 4777 5374 4850 5301 7.14 5.26 4.87 5.65 4.96 5.56 Intestine
(colon and rectum)
14 502 14 175 13 596 14 754 13 755 14 595 16.92 14.24 13.56 14.92 13.73 14.75 Pancreas 6729 7215 6902 7528 6959 7470 8.28 8.07 7.67 8.47 7.74 8.40 Lung 28 898 28 005 26 848 29 163 27 047 28 963 35.73 31.17 29.62 32.73 29.86 32.48 Prostate 11 577 11 496 10 964 12 029 11 092 11 900 11.97 10.23 9.75 10.71 9.86 10.60 Leukemias 3720 3874 3626 4122 3672 4077 4.64 3.89 3.57 4.21 3.66 4.12 All cancers (malignant and benign) 115 176 116 857 112 514 121 199 113 456 120 258 139.17 125.10 119.71 130.48 120.70 129.50 Women Stomach 4937 3681 3388 3975 3448 3915 3.83 2.68 2.42 2.94 2.47 2.89 Intestine
(colon and rectum)
14 313 12 101 11 668 12 534 11 777 12 425 10.31 7.92 7.55 8.28 7.64 8.20
Pancreas 7213 7568 7221 7914 7280 7855 5.76 5.74 5.41 6.07 5.46 6.02
Lung 11 873 13 585 13 206 13 963 13 289 13 881 12.38 13.67 13.20 14.14 13.30 14.05
Breast 17 286 17 298 16 525 18 070 16 631 17 964 17.45 16.39 15.37 17.42 15.49 17.30
Uterus
(cervix and corpus)
3889 2894 2624 3163 2678 3109 3.74 2.57 2.21 2.93 2.26 2.88 Leukemias 3387 3506 3332 3681 3365 3648 2.92 2.60 2.39 2.81 2.47 2.73 All cancers (malignant and benign) 101 919 98 804 96 457 101 150 96 906 100 702 89.11 82.26 80.03 84.50 80.38 84.14
PI, prediction interval; CI, confidence interval; std., standardized.
Table 4. Number of predicted deaths and mortality rate in Italy for the year 2011, with 95% PIs and CIs and comparison data from 2007
Sex Cancer Recorded
deaths 2007 Predicted number of deaths Lower PI (95%) Upper PI (95%) Lower CI (95%) Upper CI (95%) World std. death rate 2007 Predicted world std. death rate Lower PI (95%) Upper PI (95%) Lower CI (95%) Upper CI (95%) Men Stomach 6085 5589 5296 5882 5384 5794 9.01 7.31 6.90 7.73 7.07 7.56 Intestine
(colon and rectum)
11 230 11 581 11 320 11 841 11 397 11 765 16.21 15.15 14.74 15.56 14.88 15.42 Pancreas 4750 5211 5019 5403 5071 5351 7.61 7.82 7.54 8.10 7.63 8.01 Lung 25 425 24 807 23 838 25 776 24 141 25 473 39.03 33.76 32.23 35.28 32.78 34.73 Prostate 7501 7857 7334 8380 7447 8267 8.73 8.14 7.67 8.61 7.79 8.49 Leukemias 3201 3189 3038 3340 3081 3297 5.18 4.43 4.10 4.77 4.24 4.62 All cancers
(malignant and benign)
97 353 99 574 97 491 101 658 98 033 101 116 146.14 135.35 132.40 138.30 133.30 137.41
Women Stomach 4437 4084 3888 4279 3941 4226 4.40 3.67 3.39 3.95 3.49 3.85
Intestine
(colon and rectum)
10 167 10 240 9927 10 553 10 016 10 465 10.21 9.37 9.02 9.73 9.17 9.58
Pancreas 5084 5539 5360 5719 5414 5665 5.28 5.29 5.08 5.51 5.17 5.42
Lung 7509 8313 8078 8549 8139 8487 9.45 9.85 9.58 10.12 9.67 10.03
Breast 11 916 11 987 11 578 12 396 11 671 12 303 16.18 15.14 14.50 15.78 14.65 15.63
Uterus
(cervix and corpus)
2822 2842 2702 2982 2737 2947 3.67 3.42 3.20 3.64 3.26 3.58
Leukemias 2572 2657 2490 2823 2536 2777 3.11 2.50 2.15 2.85 2.33 2.67
All cancers
(malignant and benign)
74 270 77 146 75 471 78 821 75 908 78 384 85.08 81.81 80.25 83.36 80.73 82.89
some error occurred. These predictions are based on the most
recent trends in available data, i.e. up to the year 2007 (2005 for
Spain, 2006 for Germany and 2008 for Poland). However, if
a change, or even a reversal of trends, has taken place in the last
2 or 3 years, the joinpoint regression model is not likely to be
able to pick it up. Therefore, these predictions should be
Table 5. Number of predicted deaths and mortality rate in Poland for the year 2011, with 95% PIs and CIs and comparison data from 2008
Sex Cancer Recorded
deaths 2008 Predicted number of deaths Lower PI (95%) Upper PI (95%) Lower CI (95%) Upper CI (95%) World std. death rate 2008 Predicted world std. death rate Lower PI (95%) Upper PI (95%) Lower CI (95%) Upper CI (95%) Men Stomach 3547 3411 3192 3629 3251 3571 12.65 11.56 10.79 12.33 11.02 12.10 Intestine
(colon and rectum)
6035 6278 6042 6514 6108 6448 21.16 20.71 19.92 21.50 20.14 21.28 Pancreas 2253 2314 2119 2510 2243 2385 8.18 8.36 7.63 9.09 8.09 8.63 Lung 16 880 16 560 16 039 17 081 16 215 16 904 61.70 56.66 54.66 58.67 55.35 57.98 Prostate 3892 4187 4042 4332 4086 4288 12.63 12.58 12.10 13.05 12.26 12.90 Leukemias 1454 1555 1464 1645 1501 1608 5.46 5.31 4.89 5.73 5.09 5.52 All cancers
(malignant and benign)
53 543 54 560 53 382 55 737 53 784 55 335 192.99 183.69 179.28 188.09 180.83 186.55
Women Stomach 2026 1829 1691 1967 1740 1918 4.60 3.93 3.59 4.28 3.73 4.14
Intestine
(colon and rectum)
5186 5120 4863 5378 4955 5286 11.50 10.79 10.14 11.43 10.31 11.27
Pancreas 2269 2272 2105 2438 2211 2332 5.26 5.31 4.88 5.74 5.16 5.47
Lung 5643 6343 6132 6555 6194 6493 15.53 16.60 15.96 17.24 16.16 17.05
Breast 5362 5639 5423 5855 5485 5793 14.68 14.49 13.85 15.14 14.04 14.94
Uterus
(cervix and corpus)
3042 3055 2891 3219 2934 3176 8.55 7.95 7.46 8.45 7.59 8.32
Leukemias 1175 1247 1162 1333 1197 1298 3.03 2.92 2.63 3.22 2.77 3.08
All cancers
(malignant and benign)
41 977 44 356 43 513 45 199 43 720 44 993 105.22 104.39 101.86 106.92 102.47 106.31
PI, prediction interval; CI, confidence interval; std., standardized.
Table 6. Number of predicted deaths and mortality rate in Spain for the year 2011, with 95% PIs and CIs and comparison data from 2005
Sex Cancer Recorded
deaths 2005 Predicted number of deaths Lower PI (95%) Upper PI (95%) Lower CI (95%) Upper CI (95%) World std. death rate 2005 Predicted world std. death rate Lower PI (95%) Upper PI (95%) Lower CI (95%) Upper CI (95%) Men Stomach 3549 3226 3009 3443 3054 3398 8.68 6.77 6.21 7.34 6.29 7.26 Intestine
(colon and rectum)
7927 8816 8431 9201 8487 9145 18.43 18.00 17.30 18.69 17.40 18.59 Pancreas 2420 2779 2644 2914 2686 2872 6.34 6.51 6.14 6.88 6.23 6.78 Lung 16 647 18 408 17 644 19 172 17 739 19 077 43.90 42.34 40.25 44.43 40.49 44.20 Prostate 5512 5449 5106 5792 5162 5737 10.41 8.67 8.15 9.20 8.25 9.10 Leukemias 1718 1772 1647 1897 1676 1869 4.48 3.62 3.21 4.04 3.32 3.92 All cancers
(malignant and benign)
62 664 67 841 66 444 69 239 66 620 69 063 155.82 145.45 141.74 149.15 142.22 148.67
Women Stomach 2132 1846 1713 1979 1751 1941 3.64 2.70 2.45 2.95 2.52 2.88
Intestine
(colon and rectum)
5913 6368 6188 6547 6229 6507 9.64 9.14 8.74 9.54 8.82 9.46
Pancreas 2171 2380 2233 2528 2256 2504 3.81 3.68 3.39 3.96 3.43 3.92
Lung 2471 3027 2891 3164 2926 3129 5.64 6.48 6.11 6.84 6.19 6.77
Breast 5727 5952 5635 6270 5682 6223 12.87 11.32 10.49 12.15 10.59 12.06
Uterus
(cervix and corpus)
1863 1893 1792 1994 1836 1950 3.90 3.55 3.30 3.80 3.39 3.70
Leukemias 1291 1319 1212 1426 1240 1398 2.62 1.83 1.50 2.16 1.61 2.04
All cancers
(malignant and benign)
37 542 39 766 38 935 40 597 39 056 40 476 71.77 65.86 63.72 67.99 63.92 67.79
interpreted as the estimated numbers of deaths and rates under
the hypothesis that recent trends will continue in the near
future. The issue of random variation in the estimates of recent
and hence future trends must also be considered. However, we
have analyzed the whole of the EU and its six major member
countries that have the most stable rates. Random variation
may be an issue for the younger age groups, where number of
deaths is smaller. However, imprecision in these age groups has
a modest effect on the overall number of cases and hence on
age-standardized rates.
We published an analysis of trends in cancer mortality in
Europe from the early 1980s up to 2000–2004 [1]. In
commenting the present results, it is also of interest to note the
evolution in rates up to the midyear for the subsequent
quinquennium, i.e. 2007, in addition to the predicted rates for
the year 2011.
stomach cancer
Long-standing declines in stomach cancer mortality have been
observed since the 1960s, which are likely to continue in 2011,
as suggested by an age-period-cohort analysis of gastric cancer
mortality data in Europe [10]. In the early 1980s, in the EU,
stomach cancer was the second cause of cancer death in men
together with colon cancer, after lung cancer, and the third one
in women, after breast and colon cancer. In 2011, stomach
cancer is the fifth cause of death in men and the sixth in
women. The drops will be proportionally lower in Poland,
where rates are higher, compared with the EU as a whole, thus
increasing the gap with lower risk countries. The decrease in
rates more than compensates for the aging of the population,
and the estimated absolute numbers of deaths in 2011 are also
lower than in 2007 for both sexes [11].
Table 7. Number of predicted deaths and mortality rate in the UK for the year 2011, with 95% PIs and CIs and comparison data from 2007
Sex Cancer Recorded
deaths 2007 Predicted number of deaths Lower PI (95%) Upper PI (95%) Lower CI (95%) Upper CI (95%) World std. death rate 2007 Predicted world std. death rate Lower PI (95%) Upper PI (95%) Lower CI (95%) Upper CI (95%) Men Stomach 3277 2293 2068 2518 2180 2406 5.21 3.07 2.64 3.50 2.87 3.27 Intestine
(colon and rectum)
10 081 10 262 9888 10 636 9974 10 549 16.63 15.50 14.88 16.13 15.01 16.00 Pancreas 3763 3825 3648 4002 3721 3929 6.62 6.41 6.10 6.72 6.21 6.60 Lung 19 700 18 245 17 679 18 812 17 851 18 639 33.13 28.29 27.35 29.22 27.64 28.93 Prostate 10 256 10 177 9782 10 573 9850 10 505 13.84 12.63 12.15 13.11 12.26 13.00 Leukemias 2505 2668 2531 2806 2568 2768 4.42 4.19 3.92 4.47 4.04 4.35 All cancers
(malignant and benign)
82 998 82 090 80 741 83 439 81 139 83 041 137.97 126.37 123.98 128.77 124.76 127.99
Women Stomach 1976 1289 1118 1461 1200 1378 2.29 1.31 1.09 1.53 1.21 1.42
Intestine
(colon and rectum)
9161 9072 8753 9390 8829 9315 10.88 10.41 9.98 10.84 10.08 10.74
Pancreas 3996 4126 3956 4297 4013 4239 5.11 5.13 4.89 5.36 4.97 5.28
Lung 14 900 15 632 15 145 16 119 15 290 15 974 20.57 20.33 19.69 20.96 19.90 20.76
Breast 12 014 11 949 11 444 12 454 11 592 12 306 18.39 17.21 16.50 17.91 16.69 17.72
Uterus (cervix and corpus) 2609 2368 2226 2510 2263 2472 4.09 3.53 3.28 3.78 3.38 3.69
Leukemias 1867 1898 1780 2017 1846 1950 2.54 2.36 2.14 2.59 2.28 2.45
All cancers
(malignant and benign)
76 619 74 497 72 595 76 400 72 917 76 078 103.68 95.56 93.03 98.10 93.47 97.66
PI, prediction interval; CI, confidence interval; std., standardized.
Figure 1. Age-standardized (world population) total cancer mortality trends in 5-year steps from 1982 to 2007 and the predicted rates for 2011, for men (squares) and women (circles) in the EU. EU, European Union.
colorectal cancer
The declines observed up to 2004 in colorectal cancer mortality
in both sexes have continued up to 2007 and will likely carry
on up to 2011. Germany shows the largest absolute and
relative declines in both sexes. Again, the predicted trends
are less favorable in Polish men but comparable in Polish
women. This reflects the trends observed in the late 1980s
and 1990s in Western Europe [1, 12] and North America
[13, 14], where declines also started earlier in women than in
men. This was related to earlier adoption of favorable dietary
pattern and/or diagnostic and therapeutic improvements in
women.
pancreatic cancer
A stabilization of rates is predicted for pancreatic cancer, with
only modest changes between 2007 and 2011. Rates were
approximately stable in men in earlier periods too, while
a steady increase was observed in women up to 2004 [1, 15]. If
true, the lack of increase in pancreatic cancer rates in women is
an important favorable indicator. Given the declines in
mortality in most other major cancers, pancreatic cancer is
likely to become the fourth cause of cancer death in both sexes.
lung cancer
Lung cancer mortality rates will continue to decline in EU men,
albeit Spain and France showed shallower declines [1]. Changes
in ranking occurred among the six major European countries.
While Poland maintains the highest rate, and the UK and
Germany the lowest ones, Spain and France now have higher
rates than Italy, where they are declining faster than in the EU
as a whole. Conversely, lung cancer mortality in women has
increased up to 2007 in the EU, and the upward trend is likely
to continue until 2011. This is evident in all countries except
the UK, where rates are approximately stable at high levels. This
suggests that the lung cancer epidemic in European women is
still expanding, and the rate may ultimately approach 14 to 15
per 100 000 in 2015 [16]. Already in 2007–2008, lung cancer
was the first cause of cancer death in the UK and in Poland,
with rates higher than those of breast cancer.
breast cancer
The model predicts continuing declines in breast cancer
mortality rates, essentially due to improved management and
treatment of the disease [17, 18]. The declines are relatively
Figure 2. Age-standardized (world population) EU male cancer mortality trends in 5-year steps from 1982 to 2007 and the predicted rates for 2011: stomach (squares), intestines (circles), pancreas (crosses), lung
(diamonds), prostate (triangles) and leukemias (full circles). EU, European Union.
Figure 3. Age-standardized (world population) EU female cancer mortality rate trends in 5-year steps from 1982 to 2007 and the predicted rates for 2011: stomach (squares), intestines (circles), pancreas (crosses), lung (diamonds), breast (triangles), uterus (full circles) and leukemias (asterisks). EU, European Union.
modest in Poland and France, as was the case in previous
periods [1]. It is difficult to interpret these small differences in
rate changes, but the rate in Poland was 17% lower than in the
EU in 2000–2004, 11% lower in 2007 and is predicted to be
only 4% lower than in the EU in 2011, reflecting a long-term
tendency toward leveling of breast cancer rates in Europe,
starting from rates 25% to 30% lower in Eastern than in
Western Europe [19].
uterine cancer
Cancers of the cervix and corpus uteri have different etiology
and descriptive epidemiology, and not being able to distinguish
them in death certificates is a major drawback. However, the
constant declines in uterine cancer mortality are mostly due to
the effective prevention of cervical cancer through screening.
The rates in Poland will remain about double than those of the
other five countries considered, reflecting the delay observed in
former nonmarket countries in the adoption of effective
preventive strategies [20].
prostate cancer
Declines in prostate cancer mortality are expected, albeit in
Poland the rates for 2008 and 2011 are stable. Declines were
already observed in France, Germany and the UK between 1994
Figure 4. Bar plots of standardized death rates per 100 000 population for the year 2007 (dark gray) and the predicted rates for 2011 with 95% prediction intervals (light gray) for the EU in men and women in the studied cancer sites. EU, European Union.
Figure 5. Bar plots of standardized death rates per 100 000 population and certified deaths for the year 2007 (dark gray) and the predicted rates and number of deaths for 2011 with 95% prediction intervals (light gray) for total cancer mortality in the EU in men and women. EU, European Union.
and 2004, but trends were still upward in Poland and
approximately constant in Italy and Spain [1]. Thus, the data
for 2007 and the predictions for 2011 suggest that the tendency
toward a decrease—or at least a leveling off in Poland—in
prostate cancer mortality trends will spread through the EU.
This is likely attributable to improvements in diagnosis and,
chiefly, treatment of the disease [14, 21, 22].
leukemias
The declines in leukemias already observed in previous periods are
likely to have continued up to 2011. Up to 2004, later and smaller
declines were observed in Eastern and Southern Europe [1, 14,
22]. This does not seem the case anymore for Southern Europe,
represented by Italy and Spain, where more marked declines were
predicted than in other countries, particularly in women. High
rates and shallower declines are still foreseen in Poland.
all neoplasms
A substantial decline in total cancer mortality rates has been
observed since the late 1980s in men and since even earlier in
women in the EU. Between 1990–1994 and 2000–2004, the
rates declined by 9% in men, to reach the value of 168.0/
100 000 men, and by 8% in women, reaching the rate of 96.9/
100 000 women [1]. In men, the decline has continued in 2007
and will likely carry on up to 2011, and the greatest drop is
predicted in Germany. For women too, the declines persist, but
the trend in Polish women is less favorable. Given that Poland
has the highest total cancer mortality rates in both sexes, the
lack of improvement is particularly worrying. In France, the
predicted decline is also modest, although the 2011 rate in
French women remains the second lowest after Spain. This is
due to the recent unfavorable trends in lung cancer among
French and Spanish women [23].
conclusions
Declines in mortality already observed for major sites,
including stomach, colorectum, breast, uterus, prostate and
leukemias, plus lung cancer in men, have likely continued up to
2011, and a reversal of trends or at least a leveling off is
predicted in the few situations where upward trends were
observed in the past. Thus, at least in the direction of trends,
there appears to be a tendency toward greater homogeneity
between the six countries considered and likely also among
other EU countries. Lung cancer in women is steadily
increasing (except for the UK where rates were already high
a decade ago) and has become the first cause of cancer death in
Polish women, in addition to women from the UK. More
encouraging trends were foreseen for pancreatic cancer, which
showed worrying trends in the past, as our model indicated that
the increasing trends in women have likely leveled off in recent
years. The present estimated rates, therefore, are in broad
agreement with projections made for cancer mortality in
Europe up to 2015, which estimated persistently falling rates
and approximately constant absolute numbers of deaths [24].
They also confirm that, despite general favorable trends, the gap
in cancer mortality between Western and former nonmarket
economy countries of Central and Eastern Europe is likely to
persist for the foreseeable future [25, 26].
acknowledgements
This work was conducted with the contribution of the Swiss
Cancer League and the Italian Association for Cancer Research.
PB and MM were supported by a fellowship from the Italian
Foundation for Cancer Research. The authors thank Ivana
Garimoldi for editorial assistance.
funding
The Swiss Cancer League and the Italian Association for Cancer
Research.
disclosure
The authors declare no conflict of interest.
references
1. La Vecchia C, Bosetti C, Lucchini F et al. Cancer mortality in Europe, 2000–2004, and an overview of trends since 1975. Ann Oncol 2010; 21: 1323–1360.
2. Jemal A, Siegel R, Ward E et al. Cancer statistics, 2009. CA Cancer J Clin 2009; 59: 225–249.
3. Tiwari RC, Ghosh K, Jemal A et al. A new method of predicting US and state-level cancer mortality counts for the current calendar year. CA Cancer J Clin 2004; 54: 30–40.
4. World Health Organization Statistical Information System. WHO Mortality Database. 2010; http://www3.who.int/whosis/menu.cfm (15 July 2010, date last accessed).
5. World Health Organization. International Statistical Classification of Disease and Related Health Problems, 10th Revision. Geneva, Switzerland: World Health Organization. 1992.
6. European Commission. Eurostat Population Database. 2010; http:// epp.eurostat.ec.europa.eu/portal/page/portal/statistics/search_database. (19 October 2010, date last accessed).
7. Doll R, Smith PG, Waterhouse JAH et al. Comparison between registries: age-standardized rates. In Waterhouse JAH, Muir CS, Shanmugaratnam K et al. (eds): Cancer Incidence in Five Continents, Vol IV. IARC Sci Publ No 42. Lyon: International Agency for Research on Cancer. 1982; 671–675. 8. Kim HJ, Fay MP, Feuer EJ, Midthune DN. Permutation tests for joinpoint
regression with applications to cancer rates. Stat Med 2000; 19: 335–351. 9. Faraway JJ. Linear Models with R. Chapman & Hall, Boca Raton 2009. 10. Malvezzi M, Bonifazi M, Bertuccio P et al. An age-period-cohort analysis of gastric
cancer mortality from 1950 to 2007 in Europe. Ann Epidemiol 2010; 20: 898–905. 11. Amiri M, Janssen F, Kunst AE. The decline in stomach cancer mortality:
exploration of future trends in seven European countries. Eur J Epidemiol 2011; 26: 23–28.
12. Bosetti C, Levi F, Rosato V et al. Recent trends in colorectal cancer mortality in Europe. Int J Cancer 2010.
13. Jemal A, Siegel R, Xu J, Ward E. Cancer statistics, 2010. CA Cancer J Clin 2010; 60: 277–300.
14. Edwards BK, Brown ML, Wingo PA et al. Annual report to the nation on the status of cancer, 1975–2002, featuring population-based trends in cancer treatment. J Natl Cancer Inst 2005; 97: 1407–1427.
15. Levi F, Lucchini F, Negri E, La Vecchia C. Pancreatic cancer mortality in Europe: the leveling of an epidemic. Pancreas 2003; 27: 139–142.
16. Bosetti C, Levi F, Lucchini F et al. Lung cancer mortality in European women: recent trends and perspectives. Ann Oncol 2005; 16: 1597–1604. 17. Levi F, Bosetti C, Lucchini F et al. Monitoring the decrease in breast cancer
mortality in Europe. Eur J Cancer Prev 2005; 14: 497–502.
18. Dowsett M, Cuzick J, Ingle J et al. Meta-analysis of breast cancer outcomes in adjuvant trials of aromatase inhibitors versus tamoxifen. J Clin Oncol 2010; 28: 509–518.
19. Autier P, Boniol M, La Vecchia C et al. Disparities in breast cancer mortality trends between 30 European countries: retrospective trend analysis of WHO mortality database. BMJ 2010; 341: c3620.
20. Levi F, Lucchini F, Negri E et al. Cervical cancer mortality in young women in Europe: patterns and trends. Eur J Cancer 2000; 36: 2266–2271.
21. Levi F, Lucchini F, Negri E et al. Leveling of prostate cancer mortality in Western Europe. Prostate 2004; 60: 46–52.
22. Jemal A, Clegg LX, Ward E et al. Annual report to the nation on the status of cancer, 1975–2001, with a special feature regarding survival. Cancer 2004; 101: 3–27.
23. Levi F, Bosetti C, Fernandez E et al. Trends in lung cancer among young European women: the rising epidemic in France and Spain. Int J Cancer 2007; 121: 462–465.
24. Quinn MJ, d’Onofrio A, Moller B et al. Cancer mortality trends in the EU and acceding countries up to 2015. Ann Oncol 2003; 14: 1148–1152. 25. Levi F, Lucchini F, Negri E et al. Trends in cancer mortality in the European
Union and accession countries, 1980–2000. Ann Oncol 2004; 15: 1425–1431.
26. Zatonski W, Didkowska J. Closing the gap: cancer in Central and Eastern Europe (CEE). Eur J Cancer 2008; 44: 1425–1437.