18. Khong PL, Pang CB, Liang R et al. Fluorine-18fluorodeoxyglucose positron emission tomography in mature T-cell and natural killer cell malignancies. Ann Hematol 2008; 87: 613–621.
19. Karantanis D, Subramaniam RM, Peller PJ et al. The value of [(18)F] fluorodeoxyglucose positron emission tomography/computed tomography in extranodal natural killer/T-cell lymphoma. Clin Lymphoma Myeloma 2008; 8: 94–99.
20. Berk V, Yildiz R, Akdemir UO et al. Disseminated extranodal NK/T-cell lymphoma, nasal type, with multiple subcutaneous nodules: utility of 18F-FDG PET in staging. Clin Nucl Med 2008; 33: 365–366.
21. Kako S, Izutsu K, Ota Y et al. FDG-PET in T-cell and NK-cell neoplasms. Ann Oncol 2007; 18: 1685–1690.
22. Bishu S, Quigley JM, Schmitz J et al. F-18-fluoro-deoxy-glucose positron emission tomography in the assessment of peripheral T-cell lymphomas. Leuk Lymphoma 2007; 48: 1531–1538.
23. Wu HB, Wang QS, Wang MF et al. Utility of 18F-FDG PET/CT for staging NK/T-cell lymphomas. Nucl Med Commun 2010; 31: 195–200.
24. Hadithi M, Mallant M, Oudejans J et al. 18F-FDG PET versus CT for the detection of enteropathy-associated T-cell lymphoma in refractory celiac disease. J Nucl Med 2006; 47: 1622–1627.
25. Feeney J, Horwitz S, Gonen M, Schoder H. Characterization of T-cell lymphomas by FDG PET/CT. Am J Roentgenol 2010; 195: 333–340.
26. Casulo C, Schoder H, Feeney J et al. FDG-PET in the staging and prognosis of T cell lymphoma. Leuk Lymphoma 2013; 54: 2163–2167.
27. NCCN clinical practice guidelines in oncology: non-Hodgkin’s lymphoma. V.5.2014
http://www.nccn.org/professionals/physician_gls/pdf/nhl.pdf(24 November 2014, date last accessed).
28. O’Connor OA, Pro B, Pinter-Brown L et al. Pralatrexate in patients with relapsed or refractory peripheral T-cell lymphoma: results from the pivotal PROPEL study. J Clin Oncol 2011; 29: 1182–1189.
29. Pellegrini C, Casadei B, Derenzini E et al. The role of interim-PET andfinal-PET in the outcome of peripheral T-cell lymphoma (PTCL) treated at the diagnosis with CHOP. Blood 2012; 120: abstr 2721.
30. Pro B, Advani RH, Brice P et al. Three-year survival results from an ongoing phase 2 study of brentuximab vedotin in patients with relapsed or refractory systemic anaplasitc large cell lymphoma. Blood 2013; 122: abstr 1809.
31. Cahu X, Bodet-Milin C, Brissot E et al. 18F-fluorodeoxyglucose-positron emission tomography before, during and after treatment in mature T/NK lymphomas: a study from the GOELAMS group. Ann Oncol 2011; 22: 705–711.
32. Meignan M, Gallamini A, Itti E et al. Report on the Third International Workshop on Interim Positron Emission Tomography in Lymphoma held in Menton, France, 26–27 September 2011 and Menton 2011 consensus. Leuk Lymphoma 2012; 53: 1876–1881. 33. Yhim HY, Lee NR, Song EK et al. Interim positron emission tomography scan
predicts early outcomes of patients with peripheral T-cell lymphoma. Blood 2013; 122: abstr 4364.
34. Yang DH, Min JJ, Ahn JS et al. The prognostic significance of interim PET/CT using visual, SUV-based and MTV-based assessment in treatment of peripheral T cell lymphoma. Blood 2013; 122: abstr 4261.
Annals of Oncology 26: 779–786, 2015 doi:10.1093/annonc/mdv001 Published online 26 January 2015
European cancer mortality predictions for the year
2015: does lung cancer have the highest death rate
in EU women?
M. Malvezzi
1,2, P. Bertuccio
1, T. Rosso
2, M. Rota
1, F. Levi
3, C. La Vecchia
2* & E. Negri
1 1Department of Epidemiology, IRCCS-Istituto di Ricerche Farmacologiche‘Mario Negri’, Milan;2
Department of Clinical Sciences and Community Health, Universitá degli Studi di Milano, Milan, Italy;3
Cancer Epidemiology Unit, Institute of Social and Preventive Medicine (IUMSP), Lausanne University Hospital, Lausanne, Switzerland
Received 10 December 2014; revised 19 December 2014; accepted 22 December 2014
Background:Cancer mortality statistics for 2015 were projected from the most recent available data for the European Union (EU) and its six more populous countries. Prostate cancer was analysed in detail.
Patients and methods:Population and death certification data from stomach, colorectum, pancreas, lung, breast, uterus, prostate, leukaemias and total cancers were obtained from the World Health Organisation database and Eurostat. Figures were derived for the EU, France, Germany, Italy, Poland, Spain and the UK. Projected 2015 numbers of deaths by age group were obtained by linear regression on estimated numbers of deaths over the most recent time period identi-fied by a joinpoint regression model.
Results:A total of 1 359 100 cancer deaths are predicted in the EU in 2015 (766 200 men and 592 900 women), corre-sponding to standardised death rates of 138.4/100 000 men and 83.9/100 000 women, falling 7.5% and 6%, respective-ly, since 2009. In men, predicted rates for the three major cancers (lung, colorectum and prostate) are lower than in 2009, falling 9%, 5% and 12%. Prostate cancer showed predicted falls of 14%, 17% and 9% in the 35–64, 65–74 and 75+ age groups. In women, breast and colorectal cancers had favourable trends (−10% and −8%), but predicted lung cancer rates rise 9% to 14.24/100 000 becoming the cancer with the highest rate, reaching and possibly overtaking breast
*Correspondence to: Prof. C. La Vecchia, Department of Clinical Sciences and Community Health, Universitá degli Studi di Milano, Via Augusto Vanzetti 5, Milan 20122, Italy. Tel: +39-02-39-01-4527; Fax: +39-02-33-200-231; E-mail: carlo.lavecchia@unimi.it
© The Author 2015. Published by Oxford University Press on behalf of the European Society for Medical Oncology. All rights reserved. For permissions, please email: journals.permissions@oup.com.
cancer rates—though the total number of deaths remain higher for breast (90 800) than lung (87 500). Pancreatic cancer has a negative outlook in both sexes, rising 4% in men and 5% in women between 2009 and 2015.
Conclusions:Cancer mortality predictions for 2015 confirm the overall favourable cancer mortality trend in the EU, translating to an overall 26% fall in men since its peak in 1988, and 21% in women, and the avoidance of over 325 000 deaths in 2015 compared with the peak rate.
Key words:cancer, Europe, mortality, projections, prostate cancer, time trends
introduction
Estimates of cancer mortality statistics for the current year, extrapolated from available data from a few years earlier, have
long been available for the United States [1], and have been
re-cently published for the European Union (EU), based on the
World Health Organisation (WHO) mortality database [2–5].
In 2012, we predicted that lung cancer mortality rates would overtake those of breast cancer as the neoplasm with the highest
death rate in EU women in 2015 [4].
Here we provide figures for the year 2015 using the same
methodology, but including Croatia, which joined the EU in 2013, and data from the WHO mortality database updated in
February 2014 [6]. This report also focuses on prostate cancer,
which is the third cause of male cancer mortality in the EU [7].
materials and methods
This work is an update to the previous articles on predicted European cancer mortality, and is based on similar methods [2–5].
Official death certification data for stomach, colorectum, pancreas, lung, breast, uterus (cervix and corpus), prostate, leukaemias and total cancer (ma-lignant and benign) mortality were obtained from the WHO database (WHOSIS) [6]. Figures were derived for the EU (28 countries as of July 2013) in the period 1970–2009 and up to the most recent available year for six major European countries: France (2010), Germany (2012), Italy (2010), Poland (2011), Spain (2011) and the UK (2010). Details on data sources and preparation are given in supplementary Appendix, available at Annals of Oncology online.
From the matrices of certified deaths and resident populations, we com-puted age-specific death numbers and rates for each 5-year age group (from 0–4 to 85+ years) and calendar year. Age-standardised rates per 100 000 men and women, at all ages, were computed using the direct method, based on the world standard population [8]. For prostate cancer, rates for the 35– 64, 65–74 and 75+ years age groups were also computed.
Wefit a logarithmic Poisson count data joinpoint regression model to each 5-year age-specific number of certified deaths, and identified the most recent trend segment (details in the supplementary Appendix, available at Annals of Oncology online) [9]. We computed the predicted age-specific certified
numbers of deaths and the corresponding 95% prediction intervals (PIs) [10]
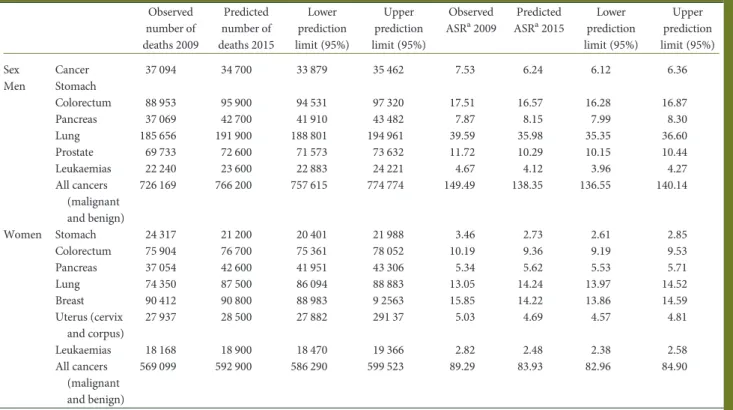
Table 1. Number of predicted cancer deaths and mortality rates for the year 2015 and comparison figures for most recent data for the EU as a whole, with 95% prediction intervals
Observed number of deaths 2009 Predicted number of deaths 2015 Lower prediction limit (95%) Upper prediction limit (95%) Observed ASRa2009 Predicted ASRa2015 Lower prediction limit (95%) Upper prediction limit (95%) Sex Cancer 37 094 34 700 33 879 35 462 7.53 6.24 6.12 6.36 Men Stomach Colorectum 88 953 95 900 94 531 97 320 17.51 16.57 16.28 16.87 Pancreas 37 069 42 700 41 910 43 482 7.87 8.15 7.99 8.30 Lung 185 656 191 900 188 801 194 961 39.59 35.98 35.35 36.60 Prostate 69 733 72 600 71 573 73 632 11.72 10.29 10.15 10.44 Leukaemias 22 240 23 600 22 883 24 221 4.67 4.12 3.96 4.27 All cancers (malignant and benign) 726 169 766 200 757 615 774 774 149.49 138.35 136.55 140.14 Women Stomach 24 317 21 200 20 401 21 988 3.46 2.73 2.61 2.85 Colorectum 75 904 76 700 75 361 78 052 10.19 9.36 9.19 9.53 Pancreas 37 054 42 600 41 951 43 306 5.34 5.62 5.53 5.71 Lung 74 350 87 500 86 094 88 883 13.05 14.24 13.97 14.52 Breast 90 412 90 800 88 983 9 2563 15.85 14.22 13.86 14.59 Uterus (cervix and corpus) 27 937 28 500 27 882 291 37 5.03 4.69 4.57 4.81 Leukaemias 18 168 18 900 18 470 19 366 2.82 2.48 2.38 2.58 All cancers (malignant and benign) 569 099 592 900 586 290 599 523 89.29 83.93 82.96 84.90
aASR, standardised using the World Standard Population.
ASR, age standardised mortality rate.
by performing a linear regression on mortality data from each age group over the time period identified by the joinpoint model. Predicted standardised death rates with 95% PI were then computed using the predicted age-specific deaths numbers and the predicted population from Eurostat [11].
results
Table1 shows total numbers (rounded to the nearest 100) of
cancer deaths and world standardised death rate predictions for the EU in 2015 with corresponding 95% PIs, as well as the 2009
recorded data. A total of 1 359 100 Europeans are projected to die of cancer in 2015; 766 200 men and 592 900 women. These figures correspond to age-standardised rates of 138.4/100 000 men and 83.9/100 000 women. Thus, a 7.5% fall in rates for men and a 6% fall in women are predicted, compared with data for 2009 (149.5 and 89.3/100 000, respectively, corresponding to 1 295 268 total deaths).
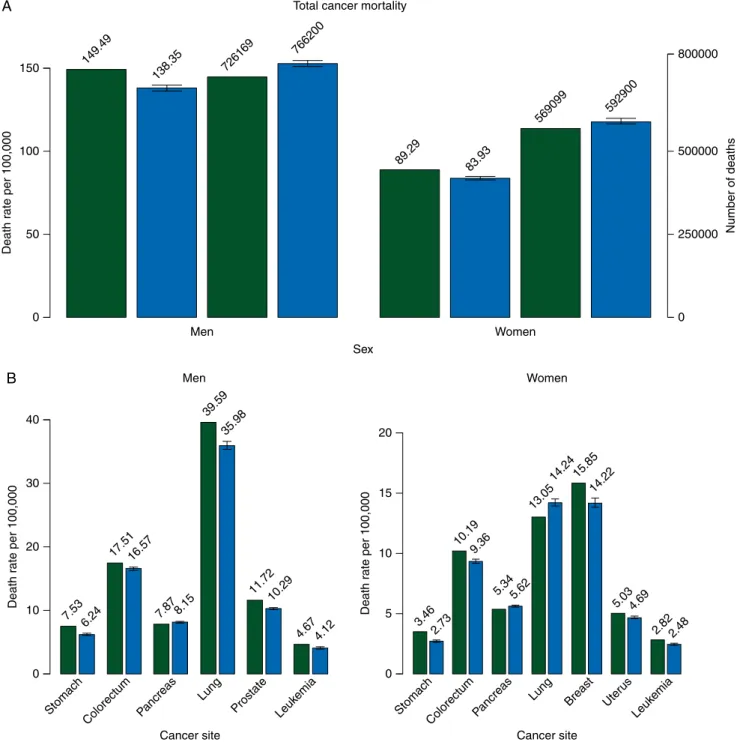
Figure 1A shows bar plots of standardised death rates per
100 000 population and certified death numbers for 2009 for EU
men and women, and the predicted values for 2015 with
0
Men Women
Men Women
Sex Total cancer mortality
50 Death r ate per 100,000 100 150 0 Cancer site 20 10 Death r ate per 100,000 30 40 0 250000 Number of deaths 500000 800000 149.49 7.53 Stomach Colorectum Pancreas Lung Prostate Leuk emia 6.24 138.35 726169 766200 89.29 83.93 569099 592900 17.5116.57 7.87 8.15 39.59 35.98 11.72 10.29 4.67 4.12 0 Cancer site 10 5 Death r ate per 100,000 15 20 3.46 Stomach ColorectumPa
ncreas Lung Uter
us Leuk emia 2.73 10.19 9.36 5.345.62 13.05 14.24 5.034.69 2.822.48 Breast 15.85 14.22 B A
Figure 1. (A) Bar plots of age-standardised (world population) death rates per 100 000 and certified deaths for the year 2009 (green) and predicted rates and number of deaths ( predicted numbers of deaths are rounded to the nearest hundred) for 2015 (blue) with 95% prediction intervals (PIs) for total cancer mortal-ity in the EU in men and women. (B) Bar plots of age-standardised death rates per 100 000 population for year 2009 (green) and predicted rates for 2015 with 95% PIs (blue) in the EU in men and women for selected cancer sites.
corresponding 95% PIs. Figure1B shows bar plots of age-stan-dardised death rates for 2009 and 2015 predictions with 95% PIs for the eight major cancer sites in EU men and women. Lung cancer has the highest predicted rates in both sexes, in men 36/
100 000, corresponding to∼191 900 predicted deaths (25% of
total male cancer deaths), and to a 9.1% fall in rates since 2009. In women, mortality from this cancer is still rising and is pre-dicted to become the neoplasm with the highest age-standar-dised cancer mortality rate in the EU in 2015, with a predicted rate of 14.24/100 000 (+9.2% since 2009), corresponding to 87 500 deaths (15% of total female cancer deaths) when com-pared with 14.22/100 000 for breast cancer. However, the total number of deaths remains higher for breast cancer (90 800). Between the ages of 50 and 79 years, more deaths from lung than breast cancer were predicted, while in elderly women an excess in breast cancer deaths persisted.
Lung cancer is predicted to cause nearly 280 000 deaths in both sexes combined in 2015, corresponding to over 20% total cancer deaths. The cancer with the second largest impact is in-testinal cancer (colon and rectum), with predicted rates of 16.6 and 9.4/100 000 in men and women, corresponding to 5.3% and 8.1% falls, respectively. Intestinal cancer deaths represent 13% of total cancer deaths in the EU in 2015, with 172 600 projected deaths. Breast cancer in women has the second highest projected
rate with a 10.2% fall from 2009, but the highest number of deaths, while in men prostate cancer has the third highest pre-dicted rate at 10.3/100 000 men with a 12.2% fall since 2009. Pancreatic cancer shows rising predicted death rates in both sexes (8.2 and 5.6/100 000 for men and women, 3.6% and 5.2% rises, respectively), corresponding to 85 300 total deaths, that is 6% of all predicted cancer deaths. The remaining causes, cancer of the uterus, stomach and leukaemias each represent <5% of total cancer deaths, show recent declines and low age-specific rates.
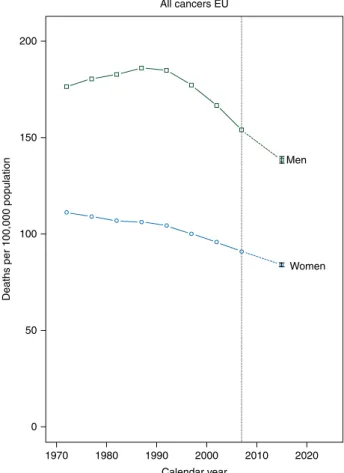
Figure2illustrates trends in standardised total cancer
mortal-ity rates for men and women in quinquennia centred from 1972 to 2007, and the predicted rates for 2015 with PIs. Trends in total cancer mortality in the EU are favourable in both sexes; in men rates have been falling since the late 1980s, while in women they have been favourable over the entire period, though recent falls were largest in men.
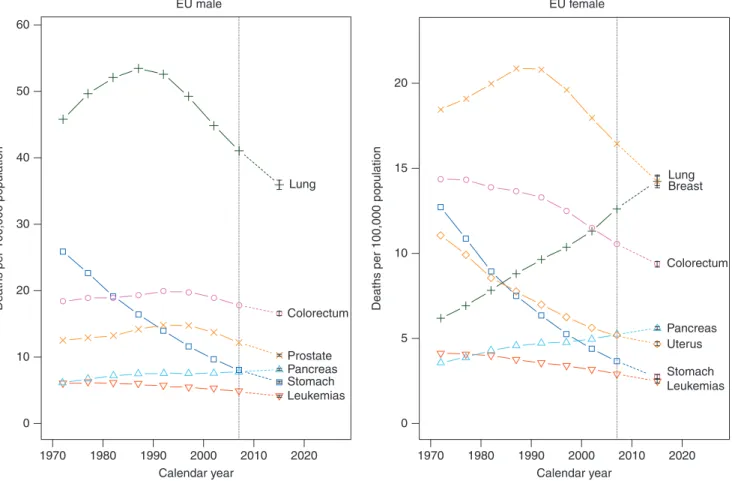
These favourable trends are seen in most of the studied cancers in both sexes; in particular, stomach cancer mortality shows the greatest falls over the whole studied period in both
sexes (Figure3). In men, lung cancer also showed appreciable
falls in mortality since the late 1980s as did breast cancer in women. The only exceptions to these generally favourable trends in the EU are pancreatic cancer, whose mortality rates have been showing steady rises in both sexes, and lung cancer in women, which has shown strong rises over the whole studied period becoming the cancer with the highest predicted mortality rate in the EU for 2015. See supplementary Appendix, available at Annals of Oncology online, with individual country data and
analyses (supplementary Tables S1–S9 and Figure S1, available
at Annals of Oncology online).
Table 2shows age standardised mortality rates for prostate
cancer in the 2000–2004 and 2005–2009 quinquennia, their percent difference and the predicted age standardised rate for
2015, for all ages, 35–64, 65–74 and the over 75 years age
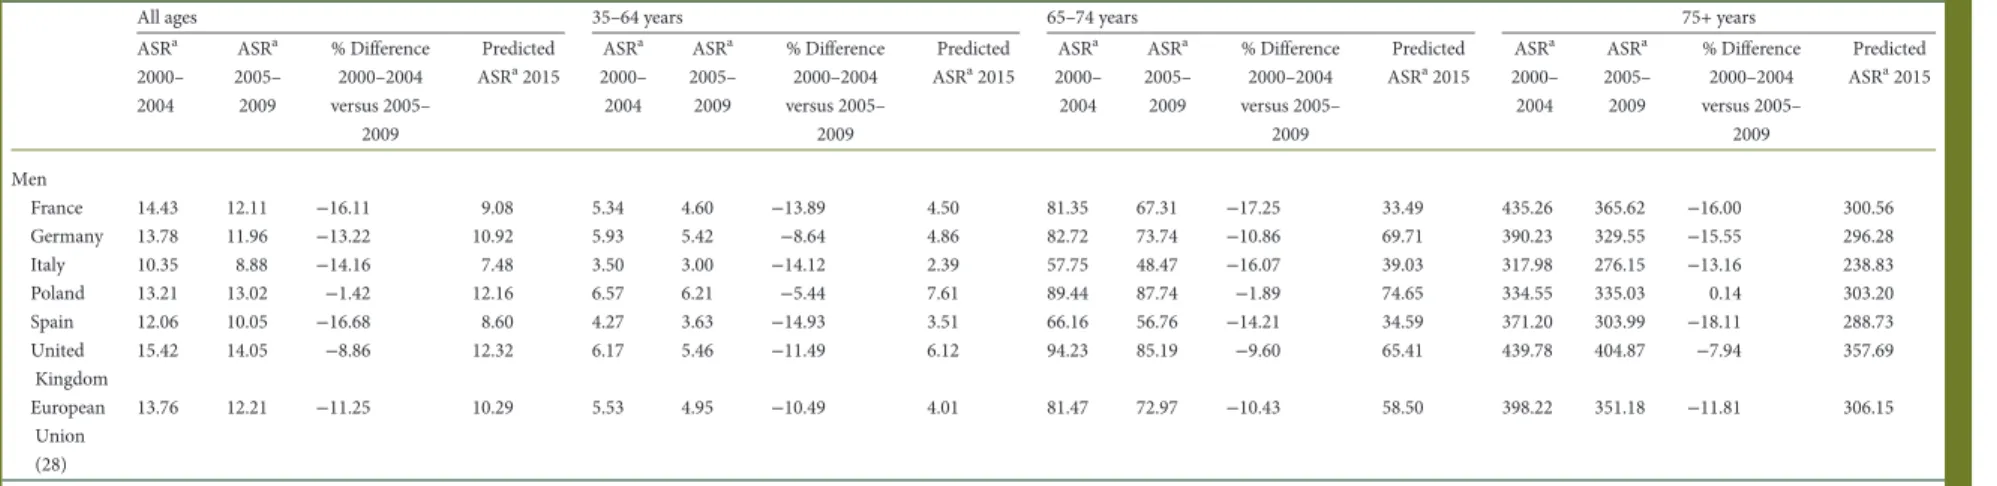
groups, in the six studied countries and the EU as a whole. In the early years of the new millennium, prostate cancer mortality rates for all ages were between 10 and 15/100 000 men (Italy and the UK, respectively), and showed favourable trends in all coun-tries and the EU as a whole, giving predicted rates for 2015 between 7 (Italy) and 12/100 000 (Poland and the UK). The overall decline between 2007 and 2015 approached 10%.
These patterns occur to a similar extent in subsequent age groups: predicted rates for 2015 are between 2 and 8/100 000 in 35–64 year olds, 33 and 75/100 000 in the 65–74 years age group and between 240 and 360/100 000 in men older than 75. In 2015, Poland and the UK have the highest predicted rates in all age groups, while only in the 65–74 year olds Germany has a slightly higher predicted rate than the UK but still lower than in Poland. Between the two quinquennia, all trends were
favour-able, with the exception of men≥75 in Poland. The predicted
rates for 2015 in the EU are favourable compared with 2009, with values of 10.3, 4, 58.5 and 306.2/100 000 men for all ages,
35–64, 65–74 and over 75 years, respectively.
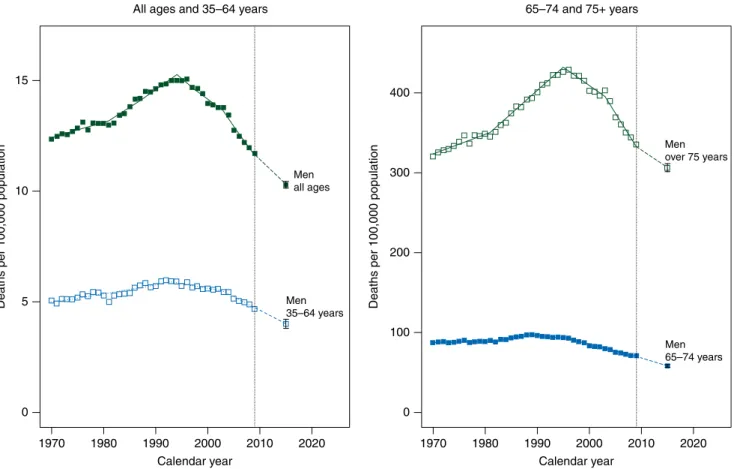
Figure4illustrates joinpoint analysis of prostate cancer
age-stan-dardised mortality rates for EU men in the four studied age groups, with predictions for 2015 and relative PIs. All the age groups display
a similar pattern with rising trends up to the late 1980s–early 1990s,
where trends become favourable, all the age groups having an 1970 0 50 Women Men 100
Deaths per 100,000 population
150 200 All cancers EU 1980 1990 2000 Calendar year 2010 2020
Figure 2. Age-standardised (world population) total cancer mortality rate trends in quinquennia from 1970–1974 to 2005–2009 and predicted rates for 2015 with 95% prediction intervals (PIs), for men (squares) and women (circles) in the EU.
estimated annual percent change between−2% and −3% for the most recent period.
discussion
In this study, we updated the EU dataset to include Croatia, and the Eurostat population projections were also updated and
include afiner age structure; hence, numbers of deaths and
age-standardised rates for the EU may differ slightly from previous
works and are not directly comparable [2–5,11].
Due to their short-term nature and the large numbers involved in their computation, the EU cancer mortality predic-tions should not be affected by major random variation. However, if a trend reversal were to have occurred within the last few years, it is unlikely that this model would totally account for it.
Due to population ageing, total numbers of cancer deaths are predicted to rise up to 2015, in spite of decreasing
age-standar-dised cancer mortality rates [12]. There are ∼30% more male
cancer deaths, with a rate over 60% higher than that of women. This excess mortality can be partly attributed to different smoking pattern histories between men and women. However, an alarming rise in the incidence of lung and other tobacco-related cancers in women took place over the last two decades in
the EU [13, 14]. In women, lung cancer mortality rates have
been rising throughout the studied period in the EU, reaching
the predicted breast cancer rates (which have been falling
stead-ily) at 14.2/100 000, as suggested previously [4, 5, 13]. The
observation that lung cancer numbers of deaths overtook those of breast cancer in middle-aged women indicates that, in the absence of smoking cessation, these cohorts of European women will maintain upward trends in lung cancer mortality rates in the near future.
Conversely in men, lung cancer death rates have been showing consistent downward trends in all the countries, reach-ing a rate comparable with that recorded in the United States in
2010 (∼36/100 000) [15]. Lung cancer remains thefirst site of
cancer death in EU men, and is also the most frequent cause of
cancer death in both sexes combined, accounting for over afifth
of all cancer deaths. Hence, tobacco, that accounts for over 80% of lung cancers, is still the greatest determinant of cancer deaths
in the EU [16].
Stomach cancer has long been one of the main drivers for the falls in mortality in both sexes, and has been showing consistent falls throughout the studied period. These are probably due to better diet and food conservation, as well as a fall in Helicobacter
pylori infection prevalence [17–19]. Colorectal cancer was the
second cause of cancer mortality overall, and has been showing favourable trends in both the EU as a whole and the individual studied countries with the exceptions of Spanish and Polish men. These favourable trends are likely due to improved diagnostic and
therapeutic practices [20–23]. 1970 0 10 20 30 Colorectum Prostate Pancreas Stomach Leukemias Lung 40
Deaths per 100,000 population
50 60 EU male 1980 1990 2000 Calendar year 2010 2020 1970 0 5 10 Colorectum Uterus Pancreas Stomach Leukemias Lung Breast 15
Deaths per 100,000 population
20
EU female
1980 1990 2000
Calendar year
2010 2020
Figure 3. Age-standardised (world population) EU male and female cancer mortality rate trends in quinquennia from 1970–1974 to 2005–2009 and predicted rates for 2015 with 95% prediction intervals (PIs). Men: stomach (squares), colorectum (circles), pancreas (triangles), lung (crosses), prostate (xs) and leukaemias (inverted triangles). Women: stomach (squares), colorectum (circles), pancreas (triangles), lung (crosses), breast (xs), uterus (diamonds) and leukaemias (inverted triangles).
Table 2. Age-standardised prostate cancer mortality rates for all ages, 35–64, 65–74 and 75+ years in the quinquennia 2000–2004 and 2005–2009 with percentage differences and predicted total rates in the EU and selected countries
All ages 35–64 years 65–74 years 75+ years
ASRa 2000– 2004 ASRa 2005– 2009 % Difference 2000–2004 versus 2005– 2009 Predicted ASRa2015 ASRa 2000– 2004 ASRa 2005– 2009 % Difference 2000–2004 versus 2005– 2009 Predicted ASRa2015 ASRa 2000– 2004 ASRa 2005– 2009 % Difference 2000–2004 versus 2005– 2009 Predicted ASRa2015 ASRa 2000– 2004 ASRa 2005– 2009 % Difference 2000–2004 versus 2005– 2009 Predicted ASRa2015 Men France 14.43 12.11 −16.11 9.08 5.34 4.60 −13.89 4.50 81.35 67.31 −17.25 33.49 435.26 365.62 −16.00 300.56 Germany 13.78 11.96 −13.22 10.92 5.93 5.42 −8.64 4.86 82.72 73.74 −10.86 69.71 390.23 329.55 −15.55 296.28 Italy 10.35 8.88 −14.16 7.48 3.50 3.00 −14.12 2.39 57.75 48.47 −16.07 39.03 317.98 276.15 −13.16 238.83 Poland 13.21 13.02 −1.42 12.16 6.57 6.21 −5.44 7.61 89.44 87.74 −1.89 74.65 334.55 335.03 0.14 303.20 Spain 12.06 10.05 −16.68 8.60 4.27 3.63 −14.93 3.51 66.16 56.76 −14.21 34.59 371.20 303.99 −18.11 288.73 United Kingdom 15.42 14.05 −8.86 12.32 6.17 5.46 −11.49 6.12 94.23 85.19 −9.60 65.41 439.78 404.87 −7.94 357.69 European Union (28) 13.76 12.21 −11.25 10.29 5.53 4.95 −10.49 4.01 81.47 72.97 −10.43 58.50 398.22 351.18 −11.81 306.15 a
ASR standardised using the World Standard Population. ASR, age standardised mortality rate.
| Malv ezzi et al. V olume 26 | No. 4 | April 2015
articles
Annals of OncologyPancreatic cancer is the only major cancer showing unfavour-able trends in both sexes. This neoplasm has a very low survival rate (5% at 5 years). Pancreatic cancer aetiology is still largely
unaccounted for, since smoking (the main identified risk factor)
is responsible for∼30% of cases, while obesity, diabetes, family
history and high alcohol intake barely account for another 10%
of cases [24].
Breast cancer has the highest projected rates for women in most of the examined countries, the exceptions being the UK and Poland that had very high lung cancer rates. Breast cancer has had a favourable trend since the late 1980s/early 1990s, likely due
to improved therapeutic procedures and screening [25]. Thus, in
the EU overall, breast is no longer the cancer site with the highest projected rate in 2015, having a lower rate than lung cancer.
Leukaemias and uterine cancers both show favourable trends,
due to continuous improvements in treatment [26].
Predicted trends for prostate cancer in the EU were favourable throughout subsequent age groups, and trends have been down-ward since the late 1980s/early 1990s, but showed appreciable variation between countries, with the highest rates in the UK being over 50% higher than those of Italy for all ages. This cancer is amenable to treatment and the role of screening prac-tices is still debated, even though favourable mortality trends
support a relevant role [27,28]. The observed falls in mortality
are of similar magnitude in various age groups up to≥75 years,
indicating that appreciable advancements in prostate cancer management have been achieved for the elderly too. The falls in rates were smaller in Poland than in Western European coun-tries, stressing the importance of adopting modern management and treatment protocols for prostatic cancer in Central and
Eastern Europe [27].
Total cancer mortality has shown favourable trends in both sexes throughout the EU, and differences between countries can be largely attributed to differences in lung cancer mortality for both sexes, and hence to historic differences in smoking habits. Exception to the general favourable trends were German, Italian and Spanish women, where a plateau may have been reached. In these countries, the rise in female lung and pancreatic cancer rates is not offset by the favourable trends of other sites.
To summarise, predicted cancer mortality for the EU shows continuing favourable trends in both sexes, similarly to the
United States [1, 15]. Since the 1988 mortality peak, over
325 000 deaths will be avoided for 2015 alone when compared with 1988 rates. However, the mortality differential between Western European countries and former non-market economy ones remains, and the unfavourable trends in female lung cancer and pancreatic cancer in both sexes are worrying. Hence a stronger effort is required on implementing anti-tobacco pol-icies ( particularly for women), and on improving cancer man-agement in Central and Eastern Europe.
1970 0 5 10 Men all ages Men 35–64 years 15
Deaths per 100,000 population
All ages and 35–64 years
1980 1990 2000 Calendar year 2010 2020 1970 0 100 200 300 Men over 75 years Men 65–74 years 400
Deaths per 100,000 population
65–74 and 75+ years Prostate cancer
1980 1990 2000 Calendar year
2010 2020
Figure 4. Annual prostate cancer age-standardised (world population) death rates in the EU per 100 000 for all ages, 35–64, 65–74 and over 75 years age groups from 1970 to 2009, the resulting joinpoint regression models, and predicted rates for the year 2015 with 95% PIs. On the left, men all ages (full squares) and men 35–64 years (empty squares), on the right men 64–75 years (full squares) and men over 75 years (empty squares).
funding
This work was conducted with the contribution of the Swiss League against Cancer, the Swiss Foundation for Research against Cancer ( project No. 2437-08-2009) and the Italian Association for Cancer Research (AIRC, project N. 10264) and within the COST Action (BM1214) EU-Pancreas. MR was sup-ported by an Italian Foundation for Research on Cancer (FIRC) scholarship.
disclosure
The authors have declared no conflicts of interest.
references
1. Siegel R, Ma J, Zou Z, Jemal A. Cancer statistics, 2014. CA Cancer J Clin 2014; 64: 9–29.
2. Malvezzi M, Arfe A, Bertuccio P et al. European cancer mortality predictions for the year 2011. Ann Oncol 2011; 22: 947–956.
3. Malvezzi M, Bertuccio P, Levi F et al. European cancer mortality predictions for the year 2012. Ann Oncol 2012; 23: 1044–1052.
4. Malvezzi M, Bertuccio P, Levi F et al. European cancer mortality predictions for the year 2013. Ann Oncol 2013; 24: 792–800.
5. Malvezzi M, Bertuccio P, Levi F et al. European cancer mortality predictions for the year 2014. Ann Oncol 2014; 25: 1650–1656.
6. World Health Organization Statistical Information System. WHO mortality database. 2014; http://www.who.int/healthinfo/statistics/mortality_rawdata/en/index.html (26 February 2014, date last accessed).
7. Bosetti C, Bertuccio P, Malvezzi M et al. Cancer mortality in Europe, 2005–2009, and an overview of trends since 1980. Ann Oncol 2013; 24: 2657–2671. 8. Doll R, Smith PG, Waterhouse JAH et al. Comparison between registries:
age-standardized rates. Vol. IV. IARC Sci Publ No. 42. In Cancer Incidence in Five Continents. Lion: IARC Press. 1982; 671–675.
9. Kim HJ, Fay MP, Feuer EJ, Midthune DN. Permutation tests for joinpoint regression with applications to cancer rates. (Erratum in: Stat Med 2001; 20: 655). Stat Med 2000; 19: 335–351.
10. Faraway JJ. Linear Models with R. Texts in Statistical Science. Vol. 63. Boca Raton: Chapman & Hall/CRC 2005.
11. European Commission. Eurostat population database. 2014; http://ec.europa.eu/ eurostat/data/database(28 July 2014, date last accessed).
12. European Commission. Population structure and ageing. 2014;http://ec.europa. eu/eurostat/statistics-explained/index.php/Population_structure_and_ageing (15 October 2014, date last accessed).
13. Bosetti C, Malvezzi M, Rosso T et al. Lung cancer mortality in European women: trends and predictions. Lung Cancer 2012; 78: 171–178.
14. Lortet-Tieulent J, Renteria E, Sharp L et al. Convergence of decreasing male and increasing female incidence rates in major tobacco-related cancers in Europe in 1988–2010. Eur J Cancer 2013 Nov 20 [epub ahead of print], doi: 10.1016/j. ejca.2013.10.014.
15. Chatenoud L, Bertuccio P, Bosetti C et al. Trends in mortality from major cancers in the Americas: 1980–2010. Ann Oncol 2014; 25: 1843–1853.
16. Agudo A, Bonet C, Travier N et al. Impact of cigarette smoking on cancer risk in the European prospective investigation into cancer and nutrition study. J Clin Oncol 2012; 30: 4550–4557.
17. La Vecchia C, Franceschi S. Nutrition and gastric cancer with a focus on Europe. Eur J Cancer Prev 2000; 9: 291–295.
18. Plummer M, van Doorn LJ, Franceschi S et al.Helicobacter pylori cytotoxin-associated genotype and gastric precancerous lesions. J Natl Cancer Inst 2007; 99: 1328–1334.
19. Pritchard DM, Crabtree JE.Helicobacter pylori and gastric cancer. Curr Opin Gastroenterol 2006; 22: 620–625.
20. Tong L, Ahn C, Symanski E et al. Relative impact of earlier diagnosis and improved treatment on survival for colorectal cancer: a US database study among elderly patients. Cancer Epidemiol 2014; 38: 733–740.
21. Ciombor KK, Wu C, Goldberg RM. Recent therapeutic advances in the treatment of colorectal cancer. Annu Rev Med 2015; 66: 83–95.
22. Elmunzer BJ, Hayward RA, Schoenfeld PS et al. Effect offlexible sigmoidoscopy-based screening on incidence and mortality of colorectal cancer: a systematic review and meta-analysis of randomized controlled trials. PLoS Med 2012; 9: e1001352.
23. Hewitson P, Glasziou P, Watson E et al. Cochrane systematic review of colorectal cancer screening using the fecal occult blood test (hemoccult): an update. Am J Gastroenterol 2008; 103: 1541–1549.
24. Bosetti C, Bertuccio P, Negri E et al. Pancreatic cancer: overview of descriptive epidemiology. Mol Carcinog 2012; 51: 3–13.
25. Bosetti C, Bertuccio P, Levi F et al. The decline in breast cancer mortality in Europe: an update (to 2009). Breast 2012; 21: 77–82.
26. Bertuccio P, Bosetti C, Malvezzi M et al. Trends in mortality from leukemia in Europe: an update to 2009 and a projection to 2012. Int J Cancer 2013; 132: 427–436. 27. Bosetti C, Bertuccio P, Chatenoud L et al. Trends in mortality from urologic
cancers in Europe, 1970–2008. Eur Urol 2011; 60: 1–15.
28. Cuzick J, Thorat MA, Andriole G et al. Prevention and early detection of prostate cancer. Lancet Oncol 2014; 15: e484–e492.