Annals of Oncology 24: 792–800, 2013 doi:10.1093/annonc/mdt010 Published online 12 February 2013
European cancer mortality predictions for the
year 2013
M. Malvezzi
1,2, P. Bertuccio
1,2, F. Levi
3, C. La Vecchia
1,2* & E. Negri
1 1Department of Epidemiology, Istituto di Ricerche Farmacologiche‘Mario Negri’, Milan;2
Department of Clinical Sciences and Community Health, Universitá degli Studi di Milano, Milan, Italy;3
Cancer Epidemiology Unit, Vaud and Neuchâtel Cancer Registries, Institute of Social and Preventive Medicine (IUMSP), Centre Hospitalier Universitaire Vaudois, University of Lausanne, Lausanne, Switzerland
Received 13 December 2012; accepted 4 January 2013
Background:Estimated cancer mortality statistics were published for the years 2011 and 2012 for the European Union (EU) and its six more populous countries.
Patients and methods:Using logarithmic Poisson count data joinpoint models and the World Health Organization mortality and population database, we estimated numbers of deaths and age-standardized (world) mortality rates (ASRs) in 2013 from all cancers and selected cancers.
Results:The 2013 predicted number of cancer deaths in the EU is 1 314 296 (737 747 men and 576 489 women). Between 2009 and 2013, all cancer ASRs are predicted to fall by 6% to 140.1/100 000 in men, and by 4% to 85.3/ 100 000 in women. The ASRs per 100 000 are 6.6 men and 2.9 women for stomach, 16.7 men and 9.5 women for intestines, 8.0 men and 5.5 women for pancreas, 37.1 men and 13.9 women for lung, 10.5 men for prostate, 14.6 women for breast, and 4.7 for uterine cancer, and 4.2 and 2.6 for leukaemia. Recent trends are favourable except for pancreatic cancer and lung cancer in women.
Conclusions:Favourable trends will continue in 2013. Pancreatic cancer has become the fourth cause of cancer death in both sexes, while in a few years lung cancer will likely become thefirst cause of cancer mortality in women as well, overtaking breast cancer.
Key words: breast cancer, cancer, Europe, mortality, projections, time trends
introduction
Estimates of current cancer mortality statistics, extrapolated from official data of a few years earlier, have long been available for the USA [1–3] and have been published for the years 2011 and 2012 for the European Union (EU) as a total and for its six more populous countries [4,5], based on the World Health Organization (WHO) mortality database [6]. Here, we provide correspondingfigures for the year 2013 using the same methodology and the WHO study database updated to July 2012. This report also focuses specifically on colorectal cancer, presenting the number of deaths and rate estimates separately for various age groups, and discussing reasons for age- and sex-specific trends.
materials and methods
This work is an update to the previous articles on predicted European cancer mortality and is based on similar
methods [4,5].
Official death certification data from stomach, intestines (colon and rectum), pancreas, lung, breast, uterus (cervix and corpus), prostate, leukemias and total cancer mortality were obtained from the WHO database (WHOSIS) [6]. Figures were derived for the EU in the period 1970–2009 and up to the most recent available year for six European countries: France (2010), Germany (2010), Italy (2009), Poland (2010), Spain (2010) and the UK (2010). The EU was defined as the current 27 member states. Data for Cyprus were not available. For the calculation of the EU rates, when data were not available for a country, the nearest available data were replicated (see supplementary Appendix 1, available at Annals of Oncology online). No interpolation was made for missing data in individual countries.
During the calendar period considered, three different Revisions of the International Classification of Diseases (ICD) were used. Cancer deaths were re-coded according to the Tenth Revision of the ICD [7]. ICD-10 encoding of the studied cancers was: stomach cancer (C16), intestinal (mainly colon and rectum) cancer (C17–C21, C26), pancreas (C25), lung (C33–C34), breast (C50), uterus (cervix and corpus) (C53– C55), prostate (C61), leukemias (C91–C95) and total cancers (C00–D48).
*Correspondence to: Prof. C. La Vecchia, Istituto di Ricerche Farmacologiche‘Mario Negri’, Via Giuseppe La Masa 19, 20156 Milan, Italy. Tel: +39-02-39-01-4527; Fax: +39-02-33-200-231; E-mail: [email protected]
© The Author 2013. Published by Oxford University Press on behalf of the European Society for Medical Oncology. All rights reserved. For permissions, please email: [email protected].
Estimates of the resident population were obtained from the same WHO database. France and the UK lacked population data for 2009 and 2010, respectively, which were obtained from Eurostat instead [8]. Population projection estimates for the year 2013 were obtained from Eurostat.
We computed age-specific rates and numbers of deaths for each 5-year age group (from 0–4 to 80+ years) and calendar year. Age-standardized rates (ASRs), per 100 000 men and women, were computed by the direct method, using the world standard population [9]. Quinquennial all-ages standardized (world population) mortality rates were also calculated, as well as quinquennial and annual standardized mortality rates for colorectal cancer for the all-ages, 35–64 and 65–79 age groups.
A logarithmic Poisson count data joinpoint model wasfitted to 5-year age-specific numbers of deaths in order to identify the most recent trend segment. The joinpoint model was set to a maximum of six identifiable segments (five joinpoints) and to have at leastfive data-points from the last available period [10]. A linear regression was then carried out over the identified trend segment in order to compute predicted age-specific numbers of deaths, the corresponding 95% confidence intervals (CIs) and prediction intervals (PIs) [11]. Predicted age-specific and ASRs (with 95% CI and PI) were computed using the predicted population data.
results
Table1shows total numbers of predicted deaths and
standardized death rates for the analyzed neoplasms with 95% PI and CI, in the EU as a whole in 2013 as well as comparison data for 2009. Total predicted number of cancer deaths in the EU in 2013 is 1 314 236 compared with 1 281 694 in 2009. Of these, 737 747 are men and 576 489 women, against 718 478 men and 563 216 women recorded in 2009. Thesefigures correspond to total cancer death rates of 140.1/100 000 men and 85.3/100 000 women in 2013 in the EU, marking a 6% fall in men and a 4% fall in women since 2009. In men, lung cancer was responsible for most cancer deaths (25%) with nearly 187 000 predicted deaths giving a rate of 37.2/100 000 men in 2013, corresponding to a 6% fall since 2009. In women, breast cancer accounted for the largest number of predicted cancer deaths (88 886 deaths, 14.6/100 000 women, 15% of total) in 2013, corresponding to a 7% fall in rates since 2009 in the EU. Female lung cancer deaths come a very close second with 82 640 deaths (14% of total) in 2013 with a rate of 13.9/ 100 000 women, marking a 7% rise since 2009. Pancreatic cancer also had unfavourable mortality rates (8/100 000 men and 5.5/100 000 women) for 2013; these are higher than those of 2009 (7.9/100 000 men and 5.3/100 000 women) even though by a very small margin. Figure1includes bar-plots of standardized death rates and deaths for 2009 and the predicted rates and deaths for 2013 with 95% PIs for total cancer mortality in the EU in men and women. Figure2shows mortality rates in 2009 and 2013 in the EU men and women for the individual cancer sites.
Figures3and4illustrate trends in age-standardized cancer mortality rates for EU men and women in 5-year steps from 1970 to 2009 and the predicted rates for 2013 for all cancers (Figure3) and individual sites (Figure4). Recent trends for the
examined cancer sites in the EU are favourable in both sexes with few exceptions, confirming the favourable trend in total cancer mortality since the late 1980s’ in men and earlier in women. The main drivers of these favourable trends in men are lung cancer, which has been decreasing since mortality peaked in the late 1980s and stomach cancer, which has been decreasing for several decades. In women, the falling rates are mainly influenced by decreases in breast, intestinal and stomach cancer. Breast cancer mortality peaked in the 1990s and has been falling since, while intestinal and stomach cancer mortalities have been falling for the entire period. Pancreatic cancer is the only cancer site with unfavourable trends in both sexes and the only one in men. In women, lung cancer mortality confirms its rising trend.
Supplementary Figure S1, available at Annals of Oncology online, illustrates age-standardized (world population) cancer mortality rate trends for men and women in quinquennia from 1970–1974 to 2005–2009 and the predicted rates for 2013 for cancers of the stomach, intestines, pancreas, lung, breast, uterus, prostate and leukemias in the studied countries and the EU.
Overall cancer mortality trends were favourable all round for both sexes and reflected the differences between countries in individual cancer sites. Male total cancer predicted rates reflected those of lung cancer, Poland having the highest rate (175.3/100 000 men), substantially higher than the EU value. Female overall predicted rates were highest in Poland and the UK (between 95 and 100/100 000 women), while the lowest was in Spain (67.8/100 000 women).
A detailed description of trends for selected cancer sites is given in supplementary Appendix 2, available at Annals of Oncology online.
Further details on country-specific data can be found in supplementary Tables S1–S6, available at Annals of Oncology online, which give total numbers of predicted deaths and standardized death rates for the analyzed neoplasms with 95% PI and CI for men and women, in the six examined European countries in 2013 as well as comparison data from the last available year in each country.
Table2gives age-standardized intestinal cancer mortality rates in the EU and the six most populous member countries, for all-ages, the 35–64 and 65–79 year age groups in the quinquennia 2000–2004 and 2005–2009, with percentage differences, as well as the 2013 predicted rates. Poland and Spain show an unfavourable situation compared with other EU countries and the whole EU, with predicted rates (21.8/100 000 men, Poland all-ages and 18.6/100 000 men, Spain all-ages) that are both higher than those in 2005–2009 in men and higher than those of other European countries and the EU (16.7/100 000 men). In women, Polish rates are still the highest, but the projected rates for 2013 are lower than those of 2005–2009 in the all-ages (10.8/100 000 women) and 65–79 age groups (93.1/100 000 women). Conversely, Polish middle-aged women have a slightly higher 2013 rate compared with 2005–2009. Despite Spanish women having low total predicted colorectal cancer rates (9/100 000 women) compared with the EU (9.5/100 000 women), the middle-aged women’s predicted rate (11/100 000 women) is higher than that recorded for 2005–2009 (10.9/100 000 women), a pattern similar to that of
Annals of Oncology
original articles
Table 1. Number of predicted deaths and standardized mortality rates in the EU for the year 2013, with 95% prediction and confidence intervals, with comparison data from 2009. Sex Cancer Number
of deaths 2009 Predicted number of deaths 2013 Lower prediction limit (95%) Upper prediction limit (95%) Lower confidence limit (95%) Upper confidence limit (95%) World standardized death rate 2009 Predicted world standardized death rate 2013 Lower prediction limit (95%) Upper prediction limit (95%) Lower confidence limit (95%) Upper confidence limit (95%) Men Stomach 36 574 34 767 34 190 35 344 34 383 35 151 7.46 6.59 6.48 6.70 6.52 6.66 Intestine (colon and rectum) 87 818 91 751 90 566 92 937 90 860 92 643 17.30 16.71 16.46 16.97 16.51 16.92 Pancreas 36 713 40 069 39 493 40 645 39 642 40 496 7.85 8.01 7.89 8.13 7.91 8.11 Lung 18 3782 18 6970 18 4434 18 9506 18 5035 18 8904 39.57 37.18 36.66 37.70 36.76 37.60 Prostate 69 069 70 347 69 230 71 465 69 596 71 099 11.38 10.52 10.36 10.67 10.42 10.62 Leukaemias 22 025 22 653 22 080 23 226 22 234 23 072 4.64 4.19 4.02 4.36 4.10 4.28 All cancers
(malignant and benign)
718 478 737 747 730 074 745 419 731 736 743 757 148.37 140.06 138.48 141.65 138.79 141.34 Women Stomach 24 040 21 446 20 788 22 105 21 009 21 884 3.43 2.91 2.80 3.02 2.83 2.98
Intestine (colon and rectum) 75 059 75 360 74 441 76 279 74 748 75 972 10.11 9.54 9.40 9.69 9.44 9.64 Pancreas 36 664 40 197 39 521 40 873 39 727 40 667 5.33 5.54 5.46 5.63 5.48 5.61 Lung 73 616 82 640 81 495 83 785 81 833 83 447 13.03 13.94 13.71 14.17 13.78 14.11 Breast 89 465 88 886 87 700 90 072 88 033 89 739 15.80 14.64 14.40 14.87 14.46 14.81 Uterus
(cervix and corpus)
27 596 27 446 26 913 27 979 27 017 27 876 5.00 4.69 4.57 4.81 4.60 4.79 Leukaemias 17 951 18 288 17 906 18 669 18 013 18 562 2.81 2.56 2.46 2.66 2.50 2.61 All cancers
(malignant and benign)
563 216 576 489 571 864 581 115 572 932 580 047 88.95 85.34 84.56 86.12 84.73 85.96
articles
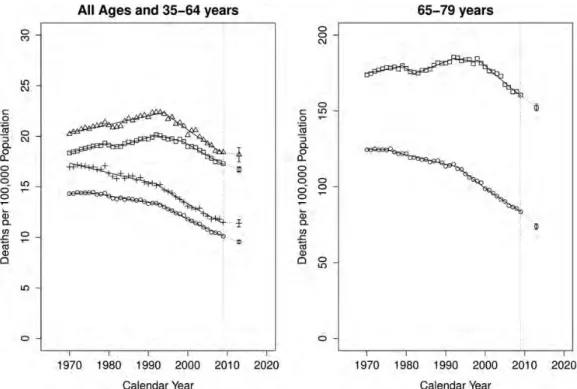
Annals of Oncology | Malv ezzi et al. V olume 24 | No. 3 | Mar ch 2013Polish women, albeit with lower rates. All other countries showed 2013 predicted rates smaller than those from 2005 to 2009. Figure5shows annual colorectal age-standardized death rates in the EU per 100 000 population for all-ages, 35–64 and 65–79-year age groups from 1970 to 2009 and the resulting joinpoint regression models for men and women, in addition to the predicted rates for 2013 with 95% PIs. EU colorectal cancer mortality trends should remain favourable even though the truncated 35–64 age group trend appears less favourable than for the other age groups.
discussion
The predicted number of deaths from cancer in the EU in the year 2013 is 1 314 296 (737 747 men and 576 489 women), slightly higher than the one in 2009. This slight increase in deaths is due to population ageing. Between 2009 and 2013, the age-adjusted mortality rates from all cancers are predicted to fall by 6% in men and 4% in women, thus continuing the favourable trends observed since the late 1980s in men and since earlier in women [12]. Male all-cancer mortality rates are
Figure 1. Bar-plots of standardized death rates per 100 000 population and certified deaths for the year 2009 (dark grey) and the predicted rates and number of deaths for 2013 with 95% PIs (light grey) for total cancer mortality in the EU in men and women.
Figure 2. Bar-plots of standardized death rates per 100 000 population for the year 2009 (dark grey) and the predicted rates for 2013 with 95% PIs (light grey) for the EU in men and women in the studied cancer sites.
Annals of Oncology
original articles
about 65% higher than in women, and the recent greater fall in men only marginally reduces the gap. The slower decrease in female all-cancer mortality rates is largely due to the differential trends between the two sexes in lung cancer mortality, which is decreasing in men and increasing in women. This mirrors the differential trends in smoking prevalence observed in the past between the two sexes [13,14].
The EU rates represent a weighted average of the rates in the 27 individual countries. The six countries considered, being the most populous, have a great impact on the overall rate; however, other EU countries may have an influence on the EU rate. Among the six major countries, the lowest all-cancer mortality rate in men in 2013 is in the UK, 10% lower than the EU rate. The lowest rate in women is found in Spain, 20% lower than that in the EU. Poland shows the highest rates in both sexes, 25% higher than that in the EU in men and 13% higher in women. Within the EU, there are large disparities in cancer mortality, showing that there is still large room for
improvement. On a positive note, all-cancer mortality rates are predicted to continue to decline in both sexes everywhere, although the gap between Poland and the other countries does not appear to decline.
The steady decline in stomach cancer mortality that started several decades ago, in Europe as well as other areas of the world, is still continuing [15]. This may reflect declines in the prevalence of Helicobacter pylori infection, the main identified risk factor for gastric cancer, but dietary habits, as well as the fall of smoking in men, may also have played a role [16]. Still, among the cancer sites considered, stomach is the one that shows the largest variation between countries, with an over threefold difference between the highest rates in Poland and the lowest in the UK, suggesting that a large number of stomach cancer deaths is still avoidable. An age-period-cohort analysis of gastric cancer mortality rates in Europe [17] found that an asymptote may have been reached for cohorts born after 1940 in British and French men and in some Western
Figure 3. Age-standardized (world population) total cancer mortality trends in quinquennia from 1970–1974 to 2005–2009 and the predicted rates for 2013, for men (squares) and women (circles) in the EU.
countries with very low rates in women. Conversely, cohort effects continued to decline in countries with higher rates, suggesting that in the future, rates will converge towards low values.
Steady declines are also predicted in both sexes for leukaemia, in women for breast and uterine cancers and in men for prostate cancer, in the EU and in all six countries considered, again confirming the long-term favourable trends for these sites [4,5,12]. Improvements in therapies, early diagnosis and screening have most likely contributed to these trends, albeit differently for each type of cancer.
The pancreas is the only major cancer site for which no improvement in rates is predicted for either sex and, if anything, a slight increase in rates is expected. Long-term trends have shown increases in both sexes in the EU up to the late 1980s, followed by a levelling off in rates up to the end of the millennium, and possibly a slight increase in most recent years [18]. Albeit diagnostic improvements may, at least in part, account for the early rises, trends in more recent years are difficult to interpret. Cigarette smoking, the best recognized risk factor, cannot account for recent trends in men, given that lung cancer has been declining. Increases in obesity prevalence may play a role in recent trends [18]. The pancreas is presently the fourth cancer mortality site in the EU for both sexes, having recently overtaken stomach cancer rates in both sexes and uterine cancer rates in women.
The steady increase in lung cancer mortality in women in the EU is expected to continue. Breast cancer rates are expected to still be higher than lung cancer rates in women in the EU in 2013, although the difference is small (14.6 versus 13.9/100 000 women). However, if the opposite trends in breast and lung cancer mortality rates continue in the near future, in 2015 lung cancer may become thefirst cause of cancer mortality in women as well. This is already true in the UK and in Poland, the two countries with the highest rates. A joinpoint regression analysis [13] showed that while in Poland rates have steadily increased, in the UK rates increased up to the late 1980s, subsequently declined up to the early 2000s, and increased again in more recent years. An age-period-cohort analysis [13] showed that in most countries, and in the EU as a whole, cohort effects increased in women born between 1940 and 1970, followed by declines for more recent cohorts, albeit based on small numbers. Conversely, in the UK, the highest cohort effects were in women born in the 1920s, followed by declines in risk, and then a plateau for women born in the 1940s, followed by ulterior declines in more recent generations. It is, therefore, possible that the recent increase in lung cancer mortality in UK women is transient, due to the additional rises in smoking prevalence observed in the 1970s; the favourable trends in younger women in the UK as well as in several other European countries suggest that a levelling off with rates around 15/100 000, and possibly some decrease in
Figure 4. Age-standardized (world population) EU male and female cancer mortalities in quinquennia from 1970–1974 to 2005–2009 and the predicted rates for 2013. Men: stomach (squares), intestines (circles), pancreas (triangles), lung (crosses), prostate (xs) and leukemias (diamonds). Women: stomach (squares), intestines (circles), pancreas (triangles), lung (crosses), breast (xs), uterus (diamonds) and leukemias (inverted triangles).
Annals of Oncology
original articles
Table 2. Standardized colorectal cancer mortality death rates for all-ages, 35–64 and 65–79 years in the quinquennia 2000–2004 and 2005–2009 with percentage difference and 2013 predicted all-ages rate in the EU and selected countries.
All ages standardized death rate 2000–2004 All ages standardized death rate 2005–2009 % Difference 2000–2004 versus 2005– 2009 Predicted all-ages standardized rate for 2013 35–64 years standardized death rate 2000– 2004 35–64 years standardized death rate 2005– 2009 % Difference 2000–2004 versus 2005– 2009 Predicted 35–64 years standardized rate for 2013 65–79 years standardized death rate 2000– 2004 65–79 years standardized death rate 2005– 2009 % Difference 2000–2004 versus 2005– 2009 Predicted 65–79 years standardized rate for 2013 Men France 17.33 15.67 −9.62 13.95 17.49 16.25 −7.09 15.49 161.10 141.10 −12.41 113.95 Germany 18.92 16.23 −14.25 13.63 19.96 17.00 −14.82 13.60 177.95 152.16 −14.49 129.43 Italy 18.06 16.38 −9.31 15.29 19.04 16.80 −11.80 15.17 165.27 150.59 −8.89 142.18 Poland 20.17 20.70 2.62 21.75 22.55 22.02 −2.37 24.24 198.85 207.42 4.31 214.48 Spain 18.64 18.30 −1.80 18.64 19.59 19.38 −1.09 19.47 172.30 167.31 −2.90 174.67 UK 17.85 16.76 −6.09 16.31 18.98 17.30 −8.85 17.95 170.15 156.38 −8.09 142.56 European Union (27) 18.78 17.60 −6.25 16.71 20.16 18.74 −7.05 18.18 175.72 163.69 −6.84 152.28 Women France 10.09 9.08 −10.02 8.13 10.95 10.08 −7.99 9.47 81.51 71.43 −12.37 58.46 Germany 11.98 10.03 −16.26 8.50 12.15 10.48 −13.79 8.70 101.26 82.86 −18.17 70.53 Italy 11.13 10.08 −9.36 9.25 13.15 11.85 −9.85 10.64 87.97 80.73 −8.23 73.16 Poland 12.01 11.34 −5.57 10.84 14.09 13.45 −4.53 13.50 107.51 100.42 −6.59 93.14 Spain 10.24 9.44 −7.82 9.02 12.10 10.87 −10.12 10.96 81.34 75.97 −6.60 67.97 UK 11.09 10.69 −3.67 9.82 11.99 11.77 −1.78 11.10 97.80 90.71 −7.26 75.53 European Union (27) 11.42 10.45 −8.50 9.54 12.80 11.80 −7.81 11.39 95.56 86.75 −9.21 73.84
articles
Annals of Oncology | Malv ezzi et al. V olume 24 | No. 3 | Mar ch 2013lung cancer mortality rates in EU women, could occur after 2020 [19].
Mortality from intestinal cancer (chiefly colorectal cancer) is predicted to decline by 3.4% in men and 5.6% in women in the EU between 2009 and 2013, again maintaining favourable trends observed since the early 1990s in men and the early 1980s in women. However, while substantial declines are predicted for all the six major countries in women, ranging from−4% in the UK to −8.7% in Germany, patterns in men are more heterogeneous. Declines around 8% are predicted in France and Germany, around 4% in Italy, but only around 1% in Spain and the UK, while a slight increase in rates (+1.4%) is predicted for Poland. Although there were large differences in intestinal cancer mortality rates in the early 1970s, converging patterns have been observed across various areas of Europe [20]. As a consequence, intestinal mortality rates in 2013 show less variation across major European countries than other cancer sites, particularly in women, where the lowest rate in France is only 25% lower than the highest rate in Poland. A more homogeneous lifestyle (including diet) across Europe may explain the converging pattern in colorectal cancer rates. Improvements in therapies and screening/early diagnosis have had a favourable impact on mortality. It is, however, difficult to explain the different patterns between the two sexes in some, but not all, countries. The earlier more favourable trends in women may be attributed in part to more favourable dietary and lifestyle habits in women, and in part to the introduction of oral contraceptives and other exogenous female hormone preparations in the 1950s and 1960s [21]. Following the early stopping of the Women’s Health Initiative in 2002 [22]
(a randomized trial comparing combined hormone
replacement treatment (HRT) to placebo), because the overall health risks exceeded the benefits, falls in HRT use were reported in the US as well as in several European countries [23]. Falls in breast cancer incidence in some countries have been related to these decreases in HRT use [23]. Given the postulated protective effect of HRT on colorectal cancer, the reduced HRT use should lead to a less favourable pattern in colorectal cancer incidence in women. However, it may still be too early to detect effects on mortality rates.
While until recently (up to 2009) younger age groups appeared to have even more favourable trends [24], suggesting further improvements in the overall rates in the future, the predictions for the year 2013 do not support this observation anymore. Given the uncertainties inherent in prediction models, this should be considered with utmost care. If true, however, this may suggest less favourable trends in the future. On the other hand, organized colorectal cancer screening has been introduced in several European countries relatively recently, and it is generally not offered to younger age groups [25]. Therefore, when the potential benefits of screening start
to affect mortality, an effect is to be expected above a certain age only.
In conclusion, cancer mortality prediction for the year 2013 confirms the favourable trend in overall cancer mortality in the EU, as well as in several major cancer sites, with the notable exceptions of pancreatic cancer in both sexes, and lung cancer in women, which seems set to become, within a few years, the first cause of cancer mortality in women as well, overtaking breast cancer.
Figure 5. Annual age-standardized colorectal cancer death rates in the EU per 100 000 population for all-ages, 35–64 and 65–79 year age groups from 1970 to 2009 and the resulting joinpoint regression models. In addition to the predicted rates for the year 2013 with 95% prediction intervals. On the left, male all-ages (squares), male 35–64 years (triangles), female all-ages (circles) and female 35–64 years (crosses). On the right, male 65–79 years (squares) and female 65–79 years (circles).
Annals of Oncology
original articles
acknowledgements
The authors thank Ivana Garimoldi for editorial assistance.
funding
This work was conducted with the contribution of the Swiss Cancer League and the Italian Association for Cancer Research (AIRC no. 10264).
disclosure
The authors have declared no conflicts of interest.
references
1. Tiwari RC, Ghosh K, Jemal A et al.. A new method of predicting US and state-level cancer mortality counts for the current calendar year. CA Cancer J Clin 2004; 54: 30–40.
2. Jemal A, Siegel R, Ward E et al.. Cancer statistics, 2009. CA Cancer J Clin 2009; 59: 225–249.
3. Chen HS, Portier K, Ghosh K et al.. Predicting US- and state-level cancer counts for the current calendar year: part I: evaluation of temporal projection methods for mortality. Cancer 2012; 118: 1091–1099.
4. Malvezzi M, Arfe A, Bertuccio P et al.. European cancer mortality predictions for the year 2011. Ann Oncol 2011; 22: 947–956.
5. Malvezzi M, Bertuccio P, Levi F et al.. European cancer mortality predictions for the year 2012. Ann Oncol 2012; 23: 1044–1052.
6. World Health Organization Statistical Information System. WHO Mortality Database. 2012;http://www3.who.int/whosis/menu.cfm(9 July 2012, date last accessed). 7. World Health Organization. International Statistical Classification of Disease and Related
Health Problems, 10th revision. Geneva, Switzerland: World Health Organization 1992. 8. European Commission. Eurostat Population Database. 2010;http://epp.eurostat.
ec.europa.eu/portal/page/portal/population/data/database (19 October 2010, date last accessed).
9. Doll R, Smith PG. Comparison between registries: age-standardized rates. Vol. IV. In Waterhouse JAH, Muir CS, Shanmugaratnam K et al.. (eds), Cancer Incidence in Five Continents. Lyon: IARC 1982; 671–675. ; IARC Sci Publ No. 42.
10. Kim HJ, Fay MP, Feuer EJ et al.. Permutation tests for joinpoint regression with applications to cancer rates. Stat Med 2000; 19: 335–351.
11. Faraway JJ. Linear Models with R. Texts in Statistical Science. Vol. 63. Boca Raton: Chapman & Hall/CRC 2005.
12. La Vecchia C, Bosetti C, Lucchini F et al.. Cancer mortality in Europe, 2000– 2004, and an overview of trends since 1975. Ann Oncol 2010; 21: 1323–1360.
13. Bosetti C, Malvezzi M, Rosso T et al.. Lung cancer mortality in European women: trends and predictions. Lung Cancer 2012; 78: 171–178.
14. Bray FI, Weiderpass E. Lung cancer mortality trends in 36 European countries: secular trends and birth cohort patterns by sex and region 1970–2007. Int J Cancer 2010; 126: 1454–1466.
15. Bertuccio P, Chatenoud L, Levi F et al.. Recent patterns in gastric cancer: a global overview. Int J Cancer 2009; 125: 666–673.
16. Kelley JR, Duggan JM. Gastric cancer epidemiology and risk factors. J Clin Epidemiol 2003; 56: 1–9.
17. Malvezzi M, Bonifazi M, Bertuccio P et al.. An age-period-cohort analysis of gastric cancer mortality from 1950 to 2007 in Europe. Ann Epidemiol 2010; 20: 898–905.
18. Bosetti C, Bertuccio P, Negri E et al.. Pancreatic cancer: overview of descriptive epidemiology. Mol Carcinog 2012; 51: 3–13.
19. Bosetti C, La Vecchia C. Cancer mortality in Latin America: implications for prevention. Rev Panam Salud Publica 2005; 18: 1–4.
20. Fernandez E, La Vecchia C, Gonzalez JR et al.. Converging patterns of colorectal cancer mortality in Europe. Eur J Cancer 2005; 41: 430–437.
21. Fernandez E, Bosetti C, La Vecchia C et al.. Sex differences in colorectal cancer mortality in Europe, 1955–1996. Eur J Cancer Prev 2000; 9: 99–104. 22. Rossouw JE, Anderson GL, Prentice RL et al.. Risks and benefits of estrogen
plus progestin in healthy postmenopausal women: principal results from the Women’s Health Initiative randomized controlled trial. JAMA 2002; 288: 321–333.
23. Zbuk K, Anand SS. Declining incidence of breast cancer after decreased use of hormone-replacement therapy: magnitude and time lags in different countries. J Epidemiol Community Health 2012; 66: 1–7.
24. Bosetti C, Levi F, Rosato V et al.. Recent trends in colorectal cancer mortality in Europe. Int J Cancer 2011; 129: 180–191.
25. Power E, Miles A, von Wagner C et al.. Uptake of colorectal cancer screening: system, provider and individual factors and strategies to improve participation. Future Oncol 2009; 5: 1371–1388.