HAL Id: hal-03115108
https://hal.archives-ouvertes.fr/hal-03115108
Preprint submitted on 19 Jan 2021
HAL is a multi-disciplinary open access archive for the deposit and dissemination of sci-entific research documents, whether they are pub-lished or not. The documents may come from teaching and research institutions in France or abroad, or from public or private research centers.
L’archive ouverte pluridisciplinaire HAL, est destinée au dépôt et à la diffusion de documents scientifiques de niveau recherche, publiés ou non, émanant des établissements d’enseignement et de recherche français ou étrangers, des laboratoires publics ou privés.
Quantitative and qualitative approach for shearwave
elastography in superficial lymph nodes
Linda Chami, Alain Giron, Malek Ezziane, Veronique Leblond, Frédéric
Charlotte, Claire Pellot-Barakat, Olivier Lucidarme
To cite this version:
Linda Chami, Alain Giron, Malek Ezziane, Veronique Leblond, Frédéric Charlotte, et al.. Quantitative and qualitative approach for shearwave elastography in superficial lymph nodes. 2021. �hal-03115108�
Quantitative and qualitative approach for shearwave elastography in superficial
lymph nodes
Linda Chami a,b, Alain Giron b, Malek Ezziane a, Véronique Leblond c, Frédéric Charlotte d, Claire
Pellot-Barakat e, Olivier Lucidarme a,b
Affiliations:
a Department of Radiology, Pitié-Salpêtrière Hospital, Sorbonne University, 47-83 Bd de l’Hôpital –
75651 Paris cedex 13, France
b LIB, INSERM, CNRS, UMR7371-U1146, Sorbonne University, 15 rue de l’Ecole de Médecine,
75006 PARIS, France
c Department of Haematology, Pitié-Salpêtrière Hospital, Sorbonne University, 47-83 Bd de
l’Hôpital – 75651 Paris cedex 13, France
d Department of Pathology, Pitié-Salpêtrière Hospital, Sorbonne University, 47-83 Bd de l’Hôpital –
75651 Paris cedex 13, France
e BioMaps, University Paris-Saclay, CEA, CNRS, INSERM, Service Hospitalier Frédéric Joliot, 4
place du général Leclerc, 91401 ORSAY France
Corresponding Author:
Claire Pellot-Barakat, PhD UMR BioMaps
University Paris-Saclay, CEA, CNRS, INSERM 4 place du Général Leclerc
91400 Orsay France
Email : claire.barakat@inserm.fr Tél : +33 01 69 86 77 39
2
Abstract
The diagnostic contribution of 2D-Shear Wave Elastography (SWE) in superficial lymph nodes (LN)
management of any origin was evaluated on 222 patients referred for needle core biopsy. Conventional
B-mode/Doppler ultrasound examinations (Conv-US) and SWE were performed for each patient.
Quantitative SWE parameters and qualitative SWE map features were extracted. Carcinomas were
found significantly stiffer than benign LN (29.5±32.3 kPa versus 6.7±12.3 kPa). Lymphomas exhibited
intermediate stiffness (11.4±5.2 kPa). Qualitative SWE analysis provided color patterns specific to
histopathology (stiff rim, nodular and undetermined patterns related to malignancy and blue pattern to
benignity). Adding SWE to Conv-US improved the sensitivity of LN diagnosis (from 81.1% to 92.0%)
but decreased its specificity (from 73.2% to 67.6%) due to the high prevalence of lymphomas over
carcinomas. Inter-observer agreement of quantitative SWE was good (ICC of 0.82). LN location and
histology type were shown to influence the reported diagnostic performance of SWE.
Keywords
Diagnostic Ultrasound; Shear Wave Elastography; Lymph nodes; Lymphomas; Performance analysis
Introduction
Lymph nodes (LN) might be involved in several pathologies: infectious, malignant, hematological,
immune, systemic and inflammatory diseases. Conventional ultrasound (Conv-US) imaging is
commonly required as the first line modality for diagnostic work-up of superficial LN and US-guided
biopsy remains the most cost-effective procedure for final diagnosis of superficial lesions
(Balakrishnan et al., 2016; Han et al., 2018). Indication for biopsy relies classically on B-mode and
color Doppler analysis however previous studies reported a sensitivity ranging from 78 to 96% and a
specificity from 76 to 98% (Ariji et al., 1998; Sato et al., 1998; Tschammler et al., 1996; Wu et al.,
3
and false positive results (between 2% and 24%) are high enough to frequently indicate a biopsy,
leading to a significant number of unnecessary biopsies. Hence, finding ways to improve the accuracy
of conventional US would be helpful. Elastography could be one of these ways. Indeed, elastography
techniques have emerged to help provide a non-invasive assessment of pathology based on tissue
mechanical properties and improve lesion differentiation. Recent Shear Wave elastography (SWE)
techniques provide an absolute elasticity assessment avoiding shortcomings of strain elastography and
theoretically overcoming operator dependency (Bercoff et al., 2004). Most published studies have been
focusing on SWE elasticity indices extracted in user-selected regions of interest as well as on specific
clinical conditions (specific diseases in specific LN localizations; i.e : breast cancer and axillary LN,
head and neck cancers LN, etc). They all show that malignant lymph nodes are significantly stiffer
than benign LN (Bhatia et al., 2012; Chen et al., 2018; Choi et al., 2013; Desmots et al., 2016; Jung et
al., 2015). However an overlap of stiffness values between the two groups exists, leading to various
accuracies of SWE used alone. The color elasticity map has been very little exploited for LN diagnosis
and only few recent studies showed that some SWE color patterns might be useful to discriminate LNs
according to histology (Chae et al., 2019; Luo et al., 2019).
We hypothesize that the variability of clinical conditions (i.e, different pathologies, different LN
localizations) might explain in part the discrepancy between reported diagnostic performances of SWE
between studies.
The purpose of this study was first to evaluate how different malignant diseases might influence tissue
stiffness estimates as well as SWE color elastograms in various locations and second to evaluate the
added value of quantitative and qualitative SWE to conventional US in routine clinical practice.
Material and methods
This prospective study was approved by the institutional review board of our institution (ID RCB:
4
needle core biopsy under ultrasound guidance for superficial lymph nodes were prospectively
included. Oral informed consent was systematically requested whereas written informed consent was
waived as SWE was part of the routine protocol for patients referred for US-guided biopsy. Patients
with clinical and ultrasound characteristics suggestive of infectious disease such as abscess or
tuberculosis were excluded.
All US examinations and US guided needle core biopsies were performed by the same senior
radiologist with 15 years of expertise in US imaging in oncology. Biopsies were all performed with a
16- or 18-Gauge Adjustable Coaxial Temno® needle (Carefusion, San Diego, CA, USA).
Histopathological results, available for all patients were considered the reference standard.
Conventional Ultrasound
The examinations were performed using an Aixplorer® machine (SuperSonic Imagine Ltd,
Aix-en-Provence, France) with a SL10-2 probe (SuperSonic Imagine Ltd, Aix-en-Aix-en-Provence, France) with a
central frequency of 10 MHz. The following B-mode/color Doppler criteria suspicious of malignancy
were noted: 1) loss of hilum, 2) markedly hypoechoic LN compared to neighboring muscles, 3) hyper
vascularization (central, mixed or peripheral), 4) cystic changes or calcifications. LNs were considered
malignant according to Conventional Ultrasound if at least two of those US suspicious criteria were
present. The long axis/short axis diameter size ratio was also calculated.
2D SWE
For SWE acquisitions, a standardized methodology was performed: the same SL10-2 probe
(SuperSonic Imagine Ltd, Aix-en-Provence, France) was used for all LN and was placed along the
long axis of the LN. The SWE™ box was adjusted to include the LN plus some surrounding tissue.
To ensure the quality of the SWE map, the acquisition was frozen after the stabilization of the 2D
elasticity map display (about 10s), and the elasticity map with the best color filling and temporal
5
Quantitative analysis
A round and as large as possible region of interest (ROI) including the LN was manually delineated
according to the B-mode image while avoiding artifacts. In case of LNs with large and predominant
fatty hilum, the cortex part was privileged as it is the most informative site. The rationale for choosing
a large ROI including most of the LN served two purposes: i) derive quantitative parameters
representative of the whole LN stiffness and heterogeneity, ii) limit the operator dependency, iii) limit
biais. The quantification box provided the following Qbox values expressed in kilopascals (kPa):
average value of stiffness (Emean), maximum value of stiffness (Emax), standard deviation (SD).
Three consecutive measurements were performed, each time repositioning the probe using the
standardized procedure described above, and the average values of each Emean, Emax, and SD were
then calculated from the three repetitions. After manually repositioning the probe, the SWE™ box and
ROI locations differed from one acquisition to another. The size of the SWE™ box as well as the other
physical parameters of the B-mode image did not change (focus, depth, gain, etc.).
Furthermore, a reproducibility study was conducted in a subgroup of 38 patients in whom three
additional 2D SWE maps were obtained by a second radiologist blinded to the previous 2D SWE
acquisitions. This second radiologist had less than one year of experience in SWE imaging. Exams
were selected randomly for the reproducibility test. The histological distribution of this subset of 38
exams was 16 benign LNs, 17 lymphomas and 5 carcinomas. The subset had slightly more benign LNs
(42.1% vs 32%) and less carcinomas (13.2% vs 20.3%) than the full set.
Qualitative analysis
The same colorbar scale ranging from 0 (dark blue) to 100 kPa (dark red) was chosen for all the
6
The presence or the absence of the following color patterns was prospectively accessed by the operator
at the time of acquisition:
- Homogeneous blue pattern: the whole elasticity map (LN and surrounding area) is homogeneously
soft, colored in blue (Fig 1A-B)
- Nodular pattern: the lesion can visually be differentiated from the background (i.e. the target is
softer or stiffer than the surrounding tissues or displayed void areas (uncolored)) (Fig 1C-D)
- Rim pattern: the LN might exhibit void areas or colors different from the neighboring tissue and a
yellow to red rim of harder stiffness surrounding the LN is visible (Fig 1E-F).
- Undetermined pattern: the whole QBox is crossed by soft and stiff disorganized areas and possibly
unfilled regions and none of the previously described patterns are visible (Fig 1G).
Diagnostic strategy
Sensitivities, specificities and accuracies of either separated or combined conventional US and SWE
findings were assessed using different diagnostic work up strategies:
1. Conventional US alone (Conv-US) : LNs considered malignant if at least two suspicious
criteria are present on conventional US (Sc) whatever the SWE findings.
2. Quantitative SWE alone (Quant SWE) : LNs considered malignant if stiffness estimates greater
than an optimal threshold Eth (cut-off value determined using logistic regression).
3. Qualitative SWE alone (Qual SWE) : LNs considered malignant if rim and/or nodular pattern
(nod) or undetermined pattern (undt) and benign if blue pattern.
4. Combination of conventional US with qualitative SWE: LNs found benign on convention US
were reclassified as malignant if rim or nodular pattern or undetermined pattern were present
5. Combination of conventional US with quantitative SWE: LNs found benign on conventional
7
6. For the combined strategies, benign LNs on conventional US were reclassified as malignant if
the stiffness estimates were greater than the threshold and, if not, when the rim or nodular
pattern or undetermined pattern were present.
Table 1 summarizes the different diagnostic strategies.
Statistical Analysis
All statistical analyses were performed using the JMP software (SAS Institute Inc., Cary, NC, USA).
The statistical level of significance was set to p=0.05. Scores were reported as means and standard
deviation and Pearson coefficient was used to evaluate correlations.
Comparison of quantitative parameters (SWE quantitative parameters, age …) as function of the 3 histological groups (benign, lymphomas, carcinomas) were performed with a one-way Anova followed
by post-hoc t-tests to depict origin of differences.
For comparison of categorical data (such as LN localization or SWE pattern) as function of histology,
chi-square tests (4*3) were used to see whether categories are distributed homogeneously among
histology groups or whether a category is more frequent in one histology than the other.
In order to elaborate strategies for diagnosis, logistic regression using the histology classification as
gold-standard (supervised learning) were performed to optimize the thresholds of each SWE
quantitative parameters (ROC analysis). Similarly, logistic models incorporating quantitative,
qualitative and conventional US information were processed in order to improve sensitivity/specificity
balance.
The inter-observer agreement of quantitative and qualitative SWE were assessed using intraclass
correlation and Cohen’s kappa Statistic. The percentage agreement (PA or accuracy: number of
identically-classified by raters / total number) between the observers was calculated. The qualitative
8
corresponding to the 4 patterns (blue, nodule, rim and undetermined) as well as with two classes,
corresponding to benign diagnosis (blue pattern) and malignant diagnosis (the three other patterns) as
described in the diagnostic strategy.
For the quantitative SWE inter-observer agreement, intra-class correlation was computed according
to:
𝐼𝐶𝐶 = 𝜎̂𝑝
2
𝜎̂𝑝2 + 𝜎̂
𝑜2+ 𝜎̂𝑝𝑒2
with 𝜎̂𝑝2 the variance estimated for patients, 𝜎̂
𝑏2 the variance estimated for the two observers) and 𝜎̂𝑝𝑒2
the variance estimated for pure error (based on the intra-observer variability between the 3 measurements).” It is based on a mixed model with patients as random factor and rater as a fixed factor. Intra-observer reliability of quantitative SWE was assessed by computing the Coefficient of Variation
(CV : standard deviation / mean) between the three measurements performed by a same operator on
a patient. It was computed using the following equation:
𝐶𝑉 = 1 𝑁∑ 𝜎𝑖 𝜇𝑖 𝑁 𝑖=1
with N the number of patients, 𝜎𝑖 the standard deviation between the 3 measurements of patient i and
𝜇 the mean of the three patient’s measurements.
Results
Population71 benign and 151 malignant LNs (106 LNs involved by lymphomas and 45 by metastatic carcinomas)
were studied. Table 2 summarizes the characteristics of the population and the LNs studied as a
function of the histological results. The age of the patients and the localization of LNs differed
significantly according to histology. Malignant LNs were significantly more frequent in older patients
9
LNs located in the axilla area were deeper than other LNs with a distance from skin to LNs of 15 mm 13.3-16.8 95% CI for the axilla area, 11.3 mm 10-12.6 95% CI for the head and neck and 13.4 mm 11.5-15.3 95% CI for the inguinal area (p=0.01).
Primary cancers of the carcinoma group originated from breast (24%), lung (13%), thyroid (13%),
prostate (7%), colon (4%), stomach (4%), kidney (4%), and various other types (24%).
Conventional US
Frequencies of Conventional US findings as well as long axis/short axis size ratios are displayed in
Table 3. Benign LNs had significant higher long axis/short axis ratio than malignant LNs although in
most cases malignant LNs also exhibited an oval shape (long axis/short axis ratio >1). Presence of
malignant criteria and long axis/short axis ratio did not differ significantly between lymphomas and
carcinomas. Accuracies, sensitivities and specificities of the presence of at least two malignant criteria
for malignancy, lymphoma or carcinoma are summarized in Table 4.
SWE Quantitative analysis
Average values of all three quantitative 2D SWE parameters (Emean, Emax and SD) obtained as a
function of histology are summarized in Table 3. All three quantitative parameters (Emean, Emax or
SD values) provided the same diagnostic performances and were highly correlated with correlation
coefficients: Emean/Emax: 0.9, Emean/SD: 0.79, Emax/SD: 0.95.
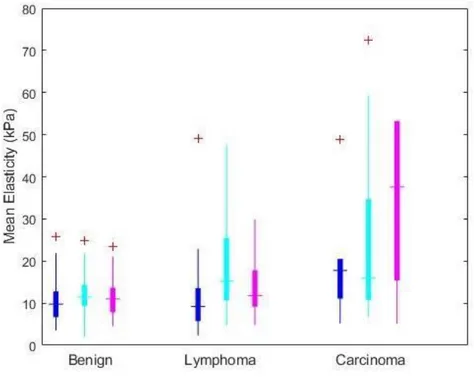
Averaged values of Emean were 11.4±5.2 kPa, 16.7± 12.3 kPa and 29.5 ± 32.3 kPa for benign LNs,
lymphomas and carcinomas respectively. The distribution of the parameter Emean as function of
histology is illustrated on Fig 2.
Accuracies, sensitivities and specificities of the SWE parameters for malignancy, lymphomas or
10
ROC analysis of mean elasticity values (Emean) revealed an optimal threshold around 15.2 kPa (CI:
11.1, 22.3) (Sensitivity: 43.7%, Specificity: 83.1%, AUC: 0.66 (CI: 0.59, 0.73), PPV: 0.85, NPV: 0.42)
for differentiating benign and malignant LNs (Fig 3). Although SWE values of lymphomas were lower
than those of carcinomas, cut-off thresholds for differentiating benign vs. lymphoma and benign vs.
carcinomas were also 15.2 kPa (Sensitivity: 37.7%, Specificity: 83.1%, AUC: 0.63, PPV: 0.78, NPV:
0.48 for differentiating benign LNs and lymphomas and Sensitivity: 57.8%, Specificity: 83.1%, AUC:
0.72, PPV: 0.68, NPV: 0.76 for differentiating benign LNs and carcinomas).
The overall inter-observer agreements of the average values of quantitative 2D SWE parameters
obtained on a subset of data by two independent observers were 0.82, 0.79 and 0.82 (ICC agreement)
for Emean, Emax and SD respectively. For the intra-observer reproducibility, the CV of Emean, Emax
and SD were 15%, 15% and 19% for the first operator (senior radiologist) and 23%, 23% and 33% for
the second operator (junior radiologist).
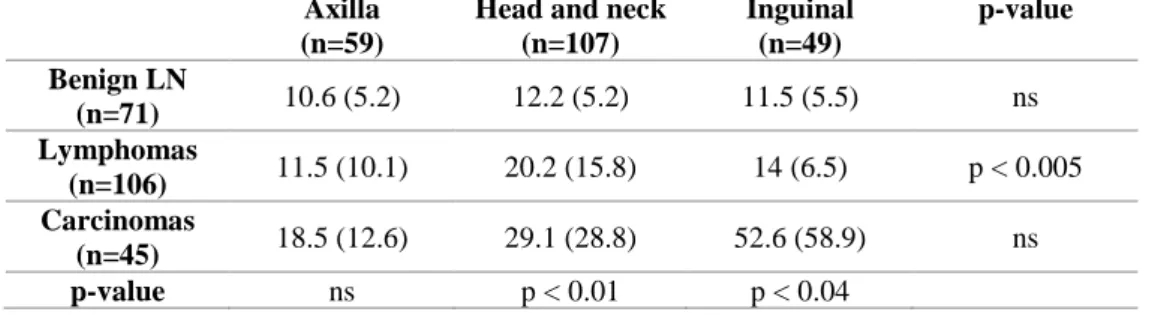
As shown on Table 5, the location of the LNs influenced the diagnostic performances of quantitative
SWE: lymphomas showed higher stiffness values in the neck than in other areas and mean stiffness
values failed to distinguish LNs according to histology in the axilla area.
SWE Qualitative analysis
Each pre-determined SWE color pattern was significantly related to the histology type (Table 3).
Nodular, Rim and undetermined patterns were related to malignancy and blue pattern has been found
to be related to benignity. However, the blue pattern occurrence in lymphomas was also very high as
shown in Fig. 4 as well as in Table 4 with 55 out of 106 lymphomas exhibiting a blue pattern.
Performances of each SWE color pattern for each histology type are summarized in Table 4. Nodular,
11
sensitive. On the other side, the homogeneous blue pattern indicated benignity with accuracy,
sensitivity and specificity of 65.8% (146/222), 57.0% (86/151) and 84.5% (60/71), respectively.
In a randomly chosen sub-population of 145 LNs analyzed by a second radiologist, the number
(proportion) of blue, nodule, rim and undetermined patterns was 46 (32%), 49 (34%), 25 (17%) and
25 (17%) respectively for the first observer and 36 (25%), 52 (36%), 32 (22%), 25 (17%) respectively
for the second observer. The kappa for the observation of the four patterns was 0.48 (CI: 0.37 ; 0.59)
and the percentage agreement was 62.1%. In terms of diagnostic agreement with two classes
(benign/malignant according to the qualitative SWE diagnostic strategy), the kappa was 0.76 (CI: 0.65;
0.88) and the percentage agreement 90%.
Diagnostic work-up
Accuracies as well as sensitivities and specificities for malignancy of different diagnostic work-up
strategies are summarized in Table 6. The combination of conv-US and qualitative SWE, conv-US and
quantitative SWE and conv-US and both qualitative and quantitative SWE showed accuracies of
84.2%, 83.8% and 83.3 % respectively.
Discussion
Reported diagnostic performance of SWE in lymph nodes have mainly focused on quantitative SWE,
head and neck or axillary localizations and on metastatic diseases. Despite including various
pathologies, we found, as already published by several groups, that malignant LNs were significantly
stiffer than benign ones and, additionally, we found that lymphomas showed stiffness values
intermediate between benign LNs and carcinomas. Our results are similar to those obtained by Zhang
et al (Zhang et al., 2017) using a point SWE system and Chae using Toshiba SWE (Chae et al., 2019).
Combination of quantitative SWE with conventional US increased the sensitivity to the detriment of
specificity. However, contrarily to previous reports, the accuracy for diagnosing malignancy did not
12
Our results are consistent with some recent studies that found that quantitative SWE did not add
predictive power to prediction models in the assessment of cervical lymph nodes (Heřman et al., 2019;
Lo et al., 2019). The analysis of these results requires taking into consideration technical as well as
clinical parameters. In our patients, the receiver operating curve identified an optimal threshold of
Emean for malignancy of 15.2 kPa. This value is much lower than the ones published in the literature
(between 18.4 and 31 kPa) (Bhatia et al., 2012; Chen et al., 2018; Choi et al., 2013; Desmots et al.,
2016; Jung et al., 2015; Kim et al., 2018). Two explanations for this lower threshold can be brought
forward: 1) Lymphomas constituted the majority of LNs in our study. The most predominant subtype
of lymphomas were Non-Hodgkin lymphomas such as follicular and B cell lymphomas. These
pathological LNs have a proliferation characterized by less fibrotic changes (desmoplastic reaction)
than carcinomas. Consequently merging both lymphomas and carcinomas in the malignancy group led
to decrease the threshold value compared to a population of exclusively metastatic LNs as usually
considered in the literature (Bhatia et al., 2013, 2012; Chen et al., 2018; Choi et al., 2013; Desmots et
al., 2016; Jung et al., 2015; Kim et al., 2018; Seo and Sohn, 2018; Suh et al., 2017; Ying et al., 2014).
2) To standardize our findings due to variability of the localization of the LNs, we used a lower
frequency probe (10-2 MHz) than that used in most studies which lead to lower stiffness values
(Chami et al., 2016).
Another factor to take into consideration is the stiffness measurement technique itself (i.e the size and
the placement of the ROI) that might differ from one study to another. Indeed, the size of the ROI has
been shown to be related to the diagnostic performance and reproducibility of SWE measurements
(Lee et al., 2013; Moon et al., 2017; Seliger et al., 2017; Skerl et al., 2015). In our study, we preferred
a ROI as large as possible due to the heterogeneity of the LNs and in order to include most of the LNs.
The main advantage of this method is that it standardizes our methodology and limits operator
dependency as the placement and the size of the ROI is adapted to the boundary of the target and not
13
that are averaged in order to minimize spatial and temporal variability. Indeed, our inter-observer
reproducibility for stiffness measurements calculated on a subset of patient was good. The diagnostic
value of each stiffness parameter remains under debate (Bhatia et al., 2012; Chen et al., 2018; Choi et
al., 2013; Kim et al., 2018; Lee et al., 2013). However, using our standardized methodology for the
ROI size and placement, we found that the three parameters (Emean, Emax and SD values) provided
the same diagnostic performance.
Although our study included a relatively small number of cases of LNs of specific histological types
and locations, we demonstrated that while the LNs morphology on gray scale US did not differ as
function of the location, the localization of LNs might influence the diagnostic performance of SWE.
The reason why lymphomas showed higher stiffness values in the neck rather than in other areas
remains unclear. In addition, quantitative SWE failed to diagnose malignancy for the LNs localized in
the axilla area (p>0.05). This result differs from studies which showed a benefit of SWE in the
diagnosis of metastatic axillary LNs in breast cancer (Luo et al., 2019) and might be explained in part
by the deeper location of LNs in the axilla area compared to other locations with a SWE signal loss
and, in another part, by the low rate of metastatic disease (n=9) in this group of patients.
These findings illustrate how the probe frequency, the location of the disease, the technique of SWE
measurements and the histology type might influence the reported diagnostic performance of SWE.
Our results show that in clinical practice, quantitative SWE combined with conventional US allowed
to detect more pathological LNs to the detriment of specificity. Operators should also keep in mind
that some lymphomas which might appear clearly pathological on gray scale US conversely might
provide intermediate stiffness values using quantitative SWE.
A way to improve LN diagnostic would be to consider not only stiffness values, but also to try to take
advantage of the stiffness mapping. Qualitative SWE has been little studied in LNs. In previous
preliminary results, we reported for the first time how qualitative SWE might be related to histology
14
patterns as biomarkers to differentiate LNs (Chae et al., 2019; Luo et al., 2019). In our study, all the
strategies that combined quantitative and/or qualitative SWE to conventional ultrasound exhibited
close performances: they improved the sensitivity with a loss of specificity and thus accuracy
performance close to that of conventional US alone. The highest accuracy was obtained when
combining qualitative SWE to Conventional US (84.2% versus 83.8% and 83.3 % for the other
combinations) although this improvement is very mild. Interestingly this result agrees with the findings
of a recent study by Luo et al showing that qualitative SWE classification combined with conventional
US exhibited better diagnostic performance than quantitative SWE and conventional US for
differentiating metastatic from benign reactive axillary lymph nodes in breast cancer (Luo et al., 2019).
Color patterns can be identified on the elasticity map. Using the same color scale range of 0-100 kPa
to standardize our qualitative acquisitions, we described four SWE patterns that were found to be
suggestive of malignancy or benignity with high specificities but low sensitivities.
Our “nodular pattern” that was found to be related to malignancy could be similar to the “markedly heterogeneous with some unfilled regions” pattern described by Bhatia et al (Bhatia et al., 2016), the “heterogeneous pattern” described by Luo for metastatic disease in breast cancer (Luo et al., 2019), or the “large red area” and “almost red” patterns described by Chae (Chae et al., 2019). The “rim pattern”
that was also suggestive of malignancy has been reported in primary breast cancer. It was interpreted
as a marker of a desmoplastic reaction or the infiltration of cancer cells into the interstitial surrounding
tissues (Chen et al., 2016; Cong et al., 2017a; Lee et al., 2017; Park et al., 2018; Zhou et al., 2014).
Recently Luo et al. (Luo et al., 2019) described “a colored area at the margin” in LNs which is similar
to our “rim pattern”. Finally, the homogeneous blue pattern has been found to be related to benignity
similarly to previous reports (Cong et al., 2017b; Luo et al., 2019; Park et al., 2018) but this sign
showed a limited interest to distinguish benign LNs and lymphomas.
The main criticism that could be addressed to the qualitative analysis is that it is inherently subjective
15
the elasticity map can also appear and disappear. Their signification remains unclear as they represent
regions where shear wave velocity could not be measured, possibly due to the presence of necrosis or
technical limitations. A moderate inter-observer agreement in the description of the four patterns , according to Cohen’s interpretation of kappa values, was found between observers (K = 0.48). However, the diagnostic ability of the technique was not penalized as the evaluation of the
inter-observer diagnostic reproducibility (when considering two color pattern groups corresponding to
benign/malignant), showed a substantial agreement (K = 0.65).
SWE performances for LNs diagnosis are usually reported for a specific location and disease. In the
current study, the same protocol and methods were used for mixed locations and various histologies
allowing to highlight that, in clinical practice, the SWE findings should be interpretated depending on
clinical conditions (location of the LNs, ratio of lymphomas versus carcinomas) and that a standardized
methodology is needed. Our study confirms that SWE color map exhibits some color patterns which
might be an interesting imaging biomarker for LN diagnosis. Indeed, combined qualitative SWE and
conventional US provided the highest effectiveness for LN diagnosis. Operators should also keep in
mind that when the expected prevalence of lymphomas is high, the addition of SWE to conventional
US might have a limited interest. Qualitative SWE should be further investigated either explicitly as
in the current study, through texture analysis and radiomics approaches or through unsupervised
approaches such as deep learning.
Acknowledgments
Research was partly funded by the French program “Investissement d’Avenir” run by the ‘Agence Nationale pour la Recherche’ (grant 'Infrastructure d’avenir en Biologie Santé -ANR-11-INBS-0006’).
16
References
Ariji, Y., Kimura, Y., Hayashi, N., Onitsuka, T., Yonetsu, K., Hayashi, K., Ariji, E., Kobayashi, T.,
Nakamura, T. Power Doppler sonography of cervical lymph nodes in patients with head and
neck cancer. AJNR. American journal of neuroradiology 1998:19:303–7.
Balakrishnan, M., Souza, F., Muñoz, C., Augustin, S., Loo, N., Deng, Y., Ciarleglio, M.,
Garcia-Tsao, G. Liver and Spleen Stiffness Measurements by Point Shear Wave Elastography via
Acoustic Radiation Force Impulse: Intraobserver and Interobserver Variability and Predictors
of Variability in a US Population. J Ultrasound Med 2016;35:2373–2380.
Bercoff, J., Tanter, M., Fink, M.. Supersonic shear imaging: a new technique for soft tissue elasticity
mapping. IEEE transactions on ultrasonics, ferroelectrics, and frequency control
2004;51:396–409.
Bhatia, K.S.S., Cho, C.C.M., Tong, C.S.L., Yuen, E.H.Y., Ahuja, A.T. Shear wave elasticity imaging
of cervical lymph nodes. Ultrasound in Medicine and Biology 2012;38:195–201.
Bhatia, K.S.S., Lam, A.C.L., Pang, S.W.A., Wang, D., Ahuja, A.T. Feasibility Study of Texture
Analysis Using Ultrasound Shear Wave Elastography to Predict Malignancy in Thyroid
Nodules. Ultrasound Med Biol 2016; 42(7):1671-80.
Bhatia, K.S.S., Lee, Y.Y.P., Yuen, E.H.Y., Ahuja, A.T. Ultrasound elastography in the head and
neck. part II. accuracy for malignancy. Cancer Imaging 2013;13:260–276.
https://doi.org/10.1102/1470-7330.2013.0027
Chae, S.Y., Jung, H.N., Ryoo, I., Suh, S., 2019. Differentiating cervical metastatic lymphadenopathy
and lymphoma by shear wave elastography. Sci Rep 2019;9(1):12396.
https://doi.org/10.1038/s41598-019-48705-0
Chami, L., Yue, J.L., Lucidarme, O., Lefort, M., Pellot-Barakat, C. Feasibility of liver shear wave
elastography with different transducers, in: 2016 Ieee International Ultrasonics Symposium
17
Chami L., Pellot-Barakat C., Gabarre J., Giron A., Charlotte F., Leblond V., Lucidarme O.
Usefulness of shearwave elastography in ultrasound imaging of superficial lymph nodes:
Comparison with histological findings. Eur J Cancer 2015;51(S133):720.
Chang, W., Tang, L., Lu, C., Wu, M., Chen, M., 2018. Shear wave elastography in the evaluation of
level VI lymph nodes in papillary thyroid carcinoma: combined with gray-scale ultrasound ex
vivo. BMC Cancer 2018;18(1):1001.
Chen, B.-B., Li, J., Guan, Y., Xiao, W.-W., Zhao, C., Lu, T.-X., Han, F. The value of shear wave
elastography in predicting for undiagnosed small cervical lymph node metastasis in
nasopharyngeal carcinoma: A preliminary study. European Journal of Radiology 2018;103:
19–24.
Chen, Y.-L., Chang, C., Zeng, W., Wang, F., Chen, J.-J., Qu, N. 3-Dimensional shear wave
elastography of breast lesions: Added value of color patterns with emphasis on crater sign of
coronal plane. Medicine 2016;95(39): e4877.
Choi, Y.J., Lee, J.H., Lim, H.K., Kim, S.Y., Han, M.W., Cho, K.J., Baek, J.H. Quantitative Shear
Wave Elastography in the Evaluation of Metastatic Cervical Lymph Nodes. Ultrasound in
Medicine and Biology 2013;39:935–940.
Cong, R., Li, J., Guo, S. A new qualitative pattern classification of shear wave elastograghy for solid
breast mass evaluation. European journal of radiology 2017;87:111–119.
https://doi.org/10.1016/j.ejrad.2016.12.021
Desmots, F., Fakhry, N., Mancini, J., Reyre, A., Vidal, V., Jacquier, A., Santini, L., Moulin, G.,
Varoquaux, A. Shear Wave Elastography in Head and Neck Lymph Node Assessment: Image
Quality and Diagnostic Impact Compared with B-Mode and Doppler Ultrasonography.
18
Han, F., Xu, M., Xie, T., Wang, J.-W., Lin, Q.-G., Guo, Z.-X., Zheng, W., Han, J., Lin, X., Zou,
R.-H., Zhou, J.-R.-H., Li, A.-H. Efficacy of ultrasound-guided core needle biopsy in cervical
lymphadenopathy: A retrospective study of 6,695 cases. Eur Radiol 2018;28:1809–1817.
Heřman, J., Sedláčková, Z., Fürst, T., Vachutka, J., Salzman, R., Vomáčka, J., Heřman, M. The Role
of Ultrasound and Shear-Wave Elastography in Evaluation of Cervical Lymph Nodes.
Biomed Res Int 2019;4318251.
Jung, W.S., Kim, J.-A., Son, E.J., Youk, J.H., Park, C.S. Shear Wave Elastography in Evaluation of
Cervical Lymph Node Metastasis of Papillary Thyroid Carcinoma: Elasticity Index as a
Prognostic Implication. Annals of Surgical Oncology 2015;22:111–116.
Kim, H.J., Choi, I.H., Jin, S.-Y., Park, H.K., Byun, D.W., Suh, K., Yoo, M.H. Efficacy of
Shear-Wave Elastography for Detecting Postoperative Cervical Lymph Node Metastasis in
Papillary Thyroid Carcinoma. Int J Endocrinol 2018:9382649.
Lee, E.J., Jung, H.K., Ko, K.H., Lee, J.T., Yoon, J.H. Diagnostic performances of shear wave
elastography: which parameter to use in differential diagnosis of solid breast masses? Eur
Radiol 2013;23:1803–1811.
Lee, H.Y., Lee, J.H., Shin, J.H., Kim, S.Y., Shin, H.J., Park, J.S., Choi, Y.J., Baek, J.H. Shear wave
elastography using ultrasound: effects of anisotropy and stretch stress on a tissue phantom
and in vivo reactive lymph nodes in the neck. Ultrasonography (Seoul, Korea) 2017;36: 25–
32.
Lo, W.-C., Hsu, W.-L., Wang, C.-T., Cheng, P.-W., Liao, L.-J. Incorporation of shear wave
elastography into a prediction model in the assessment of cervical lymph nodes. PLoS ONE
2019;14:e0221062.
Luo, S., Yao, G., Hong, Z., Zhang, S., Wang, W., Zhang, J., Zhang, Y., Wu, J., Zhang, L., Cheng,
19
Diagnosis Between Benign and Metastatic Axillary Lymph Nodes in Breast Cancer. Front
Oncol 2019:9:533.
Moon, J.H., Hwang, J.-Y., Park, J.S., Koh, S.H., Park, S.-Y. Impact of region of interest (ROI) size
on the diagnostic performance of shear wave elastography in differentiating solid breast
lesions. Acta Radiol 2017;59(6); 657-663.
Park, H.S., Shin, H.J., Shin, K.C., Cha, J.H., Chae, E.Y., Choi, W.J., Kim, H.H. Comparison of
peritumoral stromal tissue stiffness obtained by shear wave elastography between benign and malignant breast lesions. Acta radiologica (Stockholm, Sweden : 1987) 2018;59(10):1168-1175.
Sato, N., Kawabe, R., Fujita, K., Omura, S. Differential diagnosis of cervical lymphadenopathy with
intranodal color Doppler flow signals in patients with oral squamous cell carcinoma. Oral
surgery, oral medicine, oral pathology, oral radiology, and endodontics 1998;86:482–488.
Seliger, G., Chaoui, K., Kunze, C., Dridi, Y., Jenderka, K.-V., Wienke, A., Tchirikov, M. Intra- and
inter-observer variation and accuracy using different shear wave elastography methods to
assess circumscribed objects - a phantom study. Med Ultrason 2017;19:357–365.
Seo, M., Sohn, Y.-M. Differentiation of benign and metastatic axillary lymph nodes in breast cancer:
additive value of shear wave elastography to B-mode ultrasound. Clin Imaging 2018;50:258–
263.
Skerl, K., Vinnicombe, S., Giannotti, E., Thomson, K., Evans, A. Influence of region of interest size
and ultrasound lesion size on the performance of 2D shear wave elastography (SWE) in solid
breast masses. Clin Radiol 2015;70:1421–1427.
Suh, C.H., Choi, Y.J., Baek, J.H., Lee, J.H. The diagnostic performance of shear wave elastography
for malignant cervical lymph nodes: A systematic review and meta-analysis. European
20
Tschammler, A., Wirkner, H., Ott, G., Hahn, D. Vascular patterns in reactive and malignant
lymphadenopathy. European radiology 1996;6:473–80.
Wu, C.H., Chang, Y.L., Hsu, W.C., Ko, J.Y., Sheen, T.S., Hsieh, F.J. Usefulness of Doppler spectral
analysis and power Doppler sonography in the differentiation of cervical lymphadenopathies.
AJR. American journal of roentgenology 1998a;171:503–9.
Wu, C.H., Hsu, M.M., Chang, Y.L., Hsieh, F.J. Vascular pathology of malignant cervical
lymphadenopathy: qualitative and quantitative assessment with power Doppler ultrasound.
Cancer 1998b;83:1189–96.
Wu, C.H., Shih, J.C., Chang, Y.L., Lee, S.Y., Hsieh, F.J. Two-dimensional and three-dimensional
power Doppler sonographic classification of vascular patterns in cervical lymphadenopathies. Journal of ultrasound in medicine : official journal of the American Institute of Ultrasound in Medicine 1998c;17:459–64.
Ying, M., Bhatia, K.S.S., Lee, Y.P., Yuen, H.Y., Ahuja, A.T. Review of ultrasonography of
malignant neck nodes: Greyscale, doppler, contrast enhancement and elastography. Cancer
Imaging 2014;13:658–669.
Yoon, K., Jeong, W.K., Kim, Y., Kim, M.Y., Kim, T.Y., Sohn, J.H. 2-dimensional shear wave
elastography: Interobserver agreement and factors related to interobserver discrepancy. PLoS
ONE 12, 2017;e0175747.
Zhang, F., Zhao, X., Ji, X., Han, R., Li, P., Du, M. Diagnostic value of acoustic radiation force
impulse imaging for assessing superficial lymph nodes A diagnostic accuracy study.
Medicine 2017;96:1–7.
Zhou, J., Zhan, W., Chang, C., Zhang, X., Jia, Y., Dong, Y., Zhou, C., Sun, J., Grant, E.G. Breast
lesions: evaluation with shear wave elastography, with special emphasis on the stiff rim sign.
21
Figures
Figure 1
Qualitative SWE patterns: (A-B) Blue pattern. The elasticity map exhibit a globally blue color with Emean values of 11.5 kPa for (A) and 19.4 kPa for (B). (C-D) Nodular pattern. LN stiffer than the surrounding tissues (C) (the internal heterogeneous areas are stiff (yellow and red) whereas the surrounding tissue is mostly soft (blue)) and LN softer than the surrounding tissue (dark blue LN and yellow, red surrounding tissue (D). (E-F) Rim pattern. The LN and the surrounding tissue exhibit the same SWE color map (predominantly blue) with a discontinuous rim of stiffness surrounding the LN (yellow, red). The surrounding tissue is blue whereas the center part of the lymph node is partially void of SWE signal with a surrounding discontinuous stiff rim. (G) Undetermined pattern. Stiff areas in the top part and lack of signal in the lower part of the SWE map with blue LN. Histology: (A) benign LN, (B) B cell lymphoma, (C) metastasis from oropharyngeal carcinoma, (D) benign reactive lymph node, (E) metastasis from lung cancer, (F) B cell lymphoma, (G) B cell lymphoma.
22 Figure 2: Quantitative SWE estimates
Boxplot diagram of mean elasticity as function of LN histology and localization (blue: Axilla, cyan: Head and Neck, magenta: Inguinal).
Figure 3: Diagnostic performance of quantitative SWE
Receiver Operating Curves of the quantitative SWE analysis for distinguishing benign from malignant LNs (dark blue), benign LNs from lymphomas (light blue) and benign LNs from carcinomas (medium blue).
23 Figure 4: Diagnostic performance of qualitative SWE
Distribution of SWE patterns as function of histology (B: Benign, L: Lymphomas, C: Carcinomas) and location. Nodule, Rim and undetermined patterns were related to malignancy (lymphomas and carcinomas). The blue pattern has a limited interest to distinguish benign LNs and lymphomas.
24
Tables
Table 1: Summary of diagnostic strategies
Strategies Malignant Benign
Conv-US ≥ 2 US Sc < 2 US Sc
Quant SWE Emean ≥ Eth Emean < Eth
Qual SWE rim or nod or undt blue
US + Qual SWE ≥ 2 US Sc or rim or nod or undt < 2 US Sc and blue
US + Quant SWE ≥ 2 US Sc or Emean ≥ Eth < 2 US Sc and Emean < Eth
US + Qual SWE + Quant SWE
≥ 2 US Sc or rim or nod or undt or Emean ≥ Eth
< 2 US Sc and blue and Emean < Eth
Table 2: Summary of data population and LN localization as function of histology
Benign (n = 71) Lymphomas (n = 106) Carcinomas (n =45) p-value
Population Age in year (SD) 50.1 (19.5) 63.3 (18.7) 64.2 (17.3) p < 10-3
Sex: F/M(% of F) 37/34 (52) 45/61 (42) 27/18 (60) ns
Localization Axilla 29 21 9
p < 0.005
Head and neck 29 51 27
Inguinal 13 30 6
Other 0 4 3
SD: standard deviation; F : female ; M : male ; ns: non-significant:
Table 3: Summary of US and SWE findings as function of histology
Benign (n = 71) Lymphomas (n = 106) Carcinomas (n =45) p-value Conventional US
Presence of at least two malignant criteria 19 (26.8 %) 93 (87.7%) 40 (88.9%) p < 10-3 Long / Short axis ratio
(SD) 2.3 (0.8) 1.9 (0.8) 1.7 (0.6) p < 10-3 Quantitative SWE E mean (SD) 11.4 (5.2) 16.7 (12.3) 29.5 (32.3) p < 10-3 E max (SD) 19.9 (9.2) 36.1 (33.7) 62 (58.2) p < 10-3 SD (SD) 3.3 (2) 6.4 (5.7) 11.1 (10.6) p < 10-3 Qualitative SWE Homogeneous blue pattern 60 (84.5 %) 55 (51.9 %) 10 (22.2 %) p < 10-3 Nodular pattern 4 (5.6 %) 14 (13.2 %) 9 (20 %) Rim pattern 1 (1.4 %) 10 (9.4 %) 13 (28.9 %) Undetermined pattern 6 (8.5 %) 27 (25.5 %) 13 (28.9 %) SWE: Shear Wave elastography; SD: standard deviation;
25
Table 4: Accuracy (Acc), sensitivity (Se) and specificity (Sp) of conventional US, quantitative and qualitative SWE
Differentiation Accuracy (%) Sensitivity (%) Specificity (%) Conventional US Malignant/Benign 185/222 83.3 133/151 88.1 52/71 73.2 Lymphomas/Benign 145/177 81.9 93/106 87.7 52/71 73.2 Carcinomas/Benign 92/116 79.3 40/45 88.9 52/71 73.2 Quantitative SWE (Cutoff : 15.2 kPa) Malignant/Benign 155/222 56.3 66/151 43.7 59/71 83.1 Lymphomas/Benign 99/177 56 40/106 37.7 59/71 83.1 Carcinomas/Benign 85/116 73.3 26/45 57.8 59/71 83.1 Q ua lita tiv e SWE Homogeneous blue pattern* Malignant/Benign 76/222 34.2 65/151 43.0 11/71 15.5 Lymphomas/Benign 66/177 37.3 55/106 51.9 11/71 15.5 Carcinomas/Benign 21/116 18.1 10/45 22.2 11/71 15.5 Nodule pattern Malignant/Benign 90/222 40.5 23/151 15.2 67/71 94.4 Lymphomas/Benign 81/177 45.8 14/106 13.2 67/71 94.4 Carcinomas/Benign 76/116 65.6 9/45 20 67/71 94.4 Rim pattern Malignant/Benign 93/222 41.9 23/151 15.2 70/71 98.6 Lymphomas/Benign 80/177 45.2 10/106 9.4 70/71 98.6 Carcinomas/Benign 83/116 71.6 13/45 28.9 70/71 98.6 Undetermined pattern Malignant/Benign 105/222 47.3 40/151 26.5 65/71 91.5 Lymphomas/Benign 92/177 52.0 27/106 25.5 65/71 91.5 Carcinomas/Benign 78/116 67.2 13/45 28.9 65/71 91.5
* Accuracy, Sensitivity and Specificity of qualitative SWE were computed considering all patterns as signs of malignancy. Since blue pattern is an indicator of benignity, the complement to 100% must be considered to access the performance of this index to detect malignancy.
26
Table 5 : Mean and (SD) stiffness values in kiloPascals as function of histology and localization
Axilla (n=59)
Head and neck (n=107) Inguinal (n=49) p-value Benign LN (n=71) 10.6 (5.2) 12.2 (5.2) 11.5 (5.5) ns Lymphomas (n=106) 11.5 (10.1) 20.2 (15.8) 14 (6.5) p < 0.005 Carcinomas (n=45) 18.5 (12.6) 29.1 (28.8) 52.6 (58.9) ns p-value ns p < 0.01 p < 0.04 ns : non-significant
Table 6: Diagnostic performances of different diagnostic work-up strategies
Conv-US Qual SWE Quant
SWE Conv-US + Qual SWE Conv-US + Quant SWE Conv-US+ Qual / Quant SWE Sensitivity (%) 88.1 57.0 43.71 92.0 91.4 92.7 Specificity (%) 73.2 84.5 83.1 67.6 67.6 63.4 Accuracy (%) 83.3 67.8 56.3 84.2 83.8 83.3