HAL Id: cea-02359293
https://hal-cea.archives-ouvertes.fr/cea-02359293
Submitted on 12 Nov 2019
HAL is a multi-disciplinary open access archive for the deposit and dissemination of sci-entific research documents, whether they are pub-lished or not. The documents may come from teaching and research institutions in France or abroad, or from public or private research centers.
L’archive ouverte pluridisciplinaire HAL, est destinée au dépôt et à la diffusion de documents scientifiques de niveau recherche, publiés ou non, émanant des établissements d’enseignement et de recherche français ou étrangers, des laboratoires publics ou privés.
carbonate complex
C. Riglet-Martial, P. Vitorge, V. Calmon
To cite this version:
C. Riglet-Martial, P. Vitorge, V. Calmon. Electrochemical characterisation of the Ce(IV) limiting carbonate complex. Radiochimica Acta, R Oldenbourg Verlag GMBH, 1998, 82, pp.69-76. �cea-02359293�
Electrochemical Characterisation of the Ce(IV) limiting carbonate complex
Chantal Riglet-Martial1, Pierre Vitorge2 and Véronique Calmon1
1CEA-Cadarache, DCC/DESD/SESD, 13108 Saint-Paul-lez-Durance cedex, France.chantal.martial(at)cea.fr) 2CEA-Saclay, DCC/DESD/SESD, 91191 Gif-sur-Yvette Cedex, France.pierre.vitorge(at)cea.fr.
Keywords : cerium (III/IV), actinides (III/IV), carbonate, complex, activity coefficients, cyclic voltametry Abstract
The stoichiometry and the thermodynamic formation constant of the limiting complex of Ce(IV) were determined at 19.3 ± 1.0°C by using cyclic voltametry technique at a hanging mercury drop working electrode in concentrated bicarbonate/carbonate medium. The Ce(IV/III) redox potential was measured at pH varying from 9.3 to 10.6 and [CO32-] varying from 1.0 to 1.5 M by performing a CO
3
2- titration with CO
2 gas. The ionic strength and junction potential effects were taken into account for the potentiometric calibrations and measurements. Quantitative interpretation of the variations of the formal potential EIV/III showed that no polymerisation took place during the redox reaction, and that two CO32- ligands, but no OH- ligand, were
exchanged. As the accepted stoichiometry for the limiting complex of Ce(III) is Ce CO( 3 4)5-, the Ce(IV)
species is Ce CO( 3 6)8-. In a 3.06 molal Na+ carbonate/bicarbonate medium (Ionic strength = 4.33 mol.kg-1), EIV III0 / = 0.161 ± 0.008 V/SHE (in molal units) was measured. This value, combined with the published
Ce CO( 3 4)4- formation constant and the (re-evaluated) (Ce4+/Ce3+) standard potential, is used to calculate the Ce CO( 3 6)8- formation constant log
10(b6IV) = 42.2± 0.5 (defined in molal concentration except for Ce
4+ in activity : see table 1) in the same medium. The values of EIV III0 / and log
10(b6IV) are ionic strength dependant,
e.g. EIV III0 / = 0.182 ± 0.009 V/SHE and log
10(b6IV) = 41.8 ± 0.5 in molar units in a 2.67 M NaClO4 medium
(Na+ molality = molal ionic strength = 3.06 mol.kg-1). The possible formation of Ce CO( 3 5)6- is discussed
under the experimental conditions used, log10(b5IV) £ 41.8 ± 0.5 (in molal units). Introduction
The actinide chemistry in reducing aqueous solutions is important for many waste disposal issues. In a recent bibliographic review [1], we pointed out contradictory interpretations for the speciation of actinide(IV) elements in bicarbonate/carbonate media, and showed that the limiting complex can be a starting point to determine aqueous speciation in environmental conditions. From redox measurements involving the known U(VI), Np(V), Pu(VI) and Am(III) limiting carbonate complexes, the stoichiometry An CO( 3 5)6- has been proposed for the actinide(IV) limiting carbonate complex ([2, 3] for U(IV), [4] for Np(IV), [5] for Pu(IV) and [6, 7, 8] for Am(IV)). This stoichiometry has been confirmed from the published redox data and the stability of the limiting complex has been accurately determined for uranium only. Recently, this stoichiometry has been confirmed for the Pu(IV) limiting carbonate complex from EXAFS measurements [9]. Surprisingly, among analogue elements, both Ce CO( 3 5)6- and Ce CO( )
3 6
8- [10, 11, 12, 13, 14, 15] have been proposed for
the Ce(IV) limiting complex. As the chemistry of Ce(III) [16] and Am(III) [7, 8] in carbonate medium is well known, the reversible (or quasi-reversible) M(IV/III) redox couple may be used to study the chemistry of Ce(IV) and Am(IV) in concentrated bicarbonate/carbonate media. Convincing evidence, based on potentiometric measurements, of the esacarbonato cerium(IV) stoichiometry was proposed in reference [15] in a 8 molal Na+ medium and in a carbonate concentration range from 2.084 to 4.00 mol/kg. But since the authors used an Na+ specific electrode as a reference electrode, they had to correct their data for the Na+ activity variations to determine the number of carbonate ions exchanged during the redox reaction. In the present work, the stoichiometry of the Ce(IV) limiting carbonate complex was checked by measuring the Ce(IV/III) formal potential in 3.06 m Na+ solutions of much lower sodium carbonate concentrations (1.00 to 1.45 mol/kg) using cyclic voltametry with a different electrochemical cell and a different methodology in order to avoid the Na+ activity coefficient corrections. The liquid junction potentials were measured and taken into account in the treatment of the data.
Experimental
All bicarbonate/carbonate solutions, prepared from crystallised NaHCO3 (Merck, p.a.) and concentrated NaOH (Merck, p.a., d=1.35), were checked by acid-base titration using H2SO4 (Merck Titrisol). A 0.1 M Ce(III) stock solution was prepared from crystallised Ce(ClO4)3,6H2O (Johnson Mattey, purity > 99.9%). The test solutions were obtained by adding an aliquot of the Ce stock solution to the previous sodium bicarbonate/carbonate aqueous solutions. The solutions used in the reference electrodes were prepared from crystallised NaCl and NaClO4 (both Merck, p.a.). The response of the glass electrode was checked by using commercial buffer solutions (Merck Titrisol) of pH 2, 7, 9 and 12. Demineralized water delivered by a Millipore Milli-Q plus purifier was used for all the dilutions.
The redox potential of the Ce(IV/III) couple was measured by cyclic voltametry, using a classical three electrode device - including an Ag/AgCl reference electrode (Radiometer XM630/D8), a hanging mercury drop electrode (HMDE Metrhom E410) as a working electrode and a platinum wire (Radiometer Pt11/CMP) as a counter electrode - connected to an electrochemical analyser (Radiometer Voltalab 32) including a programmable interface with the Voltamaster 2 software. In order to avoid the possible damage of the reference electrode by the carbonate ions, it was isolated from the test solution by means of a capillary extension (Radiometer FDL2/CMP) filled with a 0.02 M NaCl, (I-0.02) M NaClO4 solution, of same ionic strength I as that of the test solution. The potential of this electrode (noted REF) was checked once a day. Differences higher than 0.2 mV were never observed. The formal potential of the REF electrode was calculated from Nernst law: EREF = EAgCl Ag0 / + A log10(aCl-). Activity coefficients were estimated by applying the SIT formula : log10(gi) = - z2i D(Im) + e(i, X) mX for an ion i of charge zi in a X medium, where X is an ion of charge opposite to that of i [3,8, 17]. Numerical values and definitions used are given in table 1.
The voltamograms were recorded between +0.240 and -0.020 V/SHE at a scanning speed of 0.002 V/s. The upper limit of +240 V/SHE was imposed by the oxidation wall of mercury. Ten millilitres of the c0 M Na2CO3, (I-3c0) M NaHCO3 test solution was first added to a thermostated (at 19.3 ± 1.0°C) electrochemical cell (of type Tacussel RM06-C + CRSR) and then deoxygenated with argon (HP45 Carboxyque) for one hour. After deoxygenation, a voltamogram of the electrolyte was recorded in order to verify the absence of any electroactive impurities.
In order to determine whether the redox reaction under study involved a polymer or not, a first set of experiments was first carried out with a cerium total concentration [Ce]t varying from 2.5 10-4 to 2 10-3 M. Two compositions of test solutions P1 (1.42 M Na2CO3, 0.13 M NaHCO3, pH = 10.36) and P2 (1.33 M Na2CO3, 0.37 M NaHCO3, pH = 9.86) were investigated. Five determinations of the E1/2 potential (the mean value of the oxidation and reduction peak potentials) were performed for each Ce concentration. In order to determine the stoichiometry of the Ce(IV) complex, a second set of experiments was made as follows : [Ce]t was kept constants but pH and [CO32-] were varied simultaneously by stepwise acidification of the initial (P1 + 10-3 M Ce) test solution by means of CO2 (Air Products, quality 4.5). The gas was previously passed through a NaClO4 solution of same molar ionic strength as that of P1. At each step of acidification, the test solution was left for stabilisation with an argon cover at the surface until constant pH (variation < 0.05 pH unit during 10 minutes) was obtained. The voltamogram of the solution was then recorded and the pH was checked again. Five determinations of the E1/2 potential were performed for each pH step.
For both sets of experiments (with test solutions of general initial composition c0 M Na2CO3, (I-3c0) M NaHCO3), the junction potential arising between the test solution and the REF electrode was measured by means of the cell REF || 0.02 M NaCl, c0 M Na2CO3, (I-0.02-3c0) M NaHCO3 || REF’, where REF = Ag/AgCl | 0.02 M NaCl, (I-0.02) M NaClO4 |, REF’ is an Ag/AgCl wire, || denotes a liquid-liquid junction (capillary extension) and | denotes liquid-solid contact. The variations of the junction potential as a function of pH were investigated by stepwise acidification of an initial 0.02 M NaCl, c0 M Na2CO3, (I-0.02-3c0) M NaHCO3 solution with CO2 gas, and measuring the electromotive force of the cell rapidly after stabilisation (to avoid the damage to the REF’ electrode in direct contact with carbonate ions). After each measurement, the REF electrode was controlled by means of the cell REF’ || 0.02 M NaCl, (I-0.02) M NaClO4 || REF0, where REF0 is an electrode of same type as REF. Differences higher than 0.2 mV were never observed. A linear variation of the junction potentials versus pH (with a slope of about 1 mV/pH unit) was found in the pH range under study. The measured E1/2 potentials of the Ce(IV/III) couple in carbonate media were corrected for the junction potentials calculated from the experimental regression straight line at the pH of the corresponding test solutions.
The pH was measured with a Radiometer XC161 combined glass electrode connected to a Tacussel ISIS 20000 pH-meter. The Ag/AgCl reference electrode compartment was filled with a 0.02 M NaCl, (I-0.02) M
NaClO4 solution of same molar ionic strength I as that of the initial NaHCO3/Na2CO3 test solution. As the acidification by CO2 gas involved a gradual variation of the ionic strength of the test solution, the glass electrode was standardised in activity units (pH = -log10 aH+ and not -log10 [H+]) by means of two NaHCO3/Na2CO3 buffer solutions of same Na+ concentration (3.0 M) as that of the initial NaHCO3/Na2CO3 test solution. The theoretical pH of these buffer solutions were calculated on the basis on their chemical compositions, determined by acid-base titration, and by using the equilibrium constants and SIT coefficients from table 1. The precision of the pH measurement for the buffer solutions was about 0.05 pH unit. In addition, the accuracy of the pH electrode response was controlled by means of a standardisation between pH 7 to 12. The pH range from 8.2 to 12 was checked by a titration of a 1 M NaHCO3 solution with a 1 M NaOH solution, while the pH range under 8.2 was controlled by measuring the pH of a 1 M NaHCO3 solution in equilibrium with CO2 gas. The slope of the glass electrode (figure 1) was found to be the theoretical one (58.03 mV/pH unit at 19.3°C) within a precision of 0.05 pH units in the pH range between 7.5 to 10. Above pH=10, a systematic error varying between 0.05 to 0.6 pH unit was observed. Because of the limited solubility of NaHCO3 (about 1 M), the control of the accuracy of the pH electrode could not be carried out with concentrated carbonate solutions (about 1.5 M) similar to that used for the electrochemical study of cerium.
Treatment of the data
Preliminary experiments showed that the interval between the oxidation and reduction peaks of Ce(IV/III) increased with the potential scanning rate, which was an indication of a quasi-reversible redox system. For reversible or quasi-reversible systems, the cyclic voltametry curves are theoretically symmetrical around the (constant) half-wave potential E1/2, whatever the potential scanning rate. This feature was observed for scanning rates varying from 0.002 to 0.008 V.s-1 (at higher scanning rates, the shift of the oxidation peak towards the oxidation wall of mercury was such that the oxidation peak potential could not be measured any more). In addition, the current intensity of the oxidation and reduction peaks varied linearly as a function of the square root of the scanning rate, with similar absolute values of the slope during oxidation (+0.16) and in reduction (-0.11). We then assumed that the Ce(III) and Ce(IV) diffusion coefficients were similar and that the experimentally measured E1/2 potential could be used as an estimate of the formal redox potential EIV/III of the Ce(IV/III) couple.
The speciation at varying pH and [CO32-] was calculated from the experimental conditions ( c
Na CO2 3, cNaHCO3,
pH) using equations (1 to 8) and the definitions and numerical values listed in table 1. The Na2CO3 and NaHCO3 initial (molal) total concentrations are denoted mNa CO2 3 and mNaHCO3. Since mH+ could always be
neglected, the approximation gH+= 1 was used in the mass balance equation (4) and in the definition of the
ionic strength I (Table 1).
log10 p » qNa CO2 3 mCO 3 2- + qNaHCO3 mHCO3- (1) log10 2 aH O » rNa CO 2 3 mCO32- + rNaHCO3 mHCO3- (2) mNa+ = (2 mNa CO2 3 + mNaHCO3) 1 2 1 2 3 2 3 2 + + -m m HCO H O NaHCO H O M M / / (3) mNa+ + mH+ = 2 mCO 3 2- + mHCO 3- + mOH- (4) K’m1 = Km1 / Kme = m m m CO HCO OH 3 3 -- -(5) D(Im) = 0 5050 1 15 . . I I m m + (6)
log10 Kme(Im) = log10 Kme(0) + D(Im) - e(Na+,OH-) mNa+ + log10aH O2 (7)
log10 Km1(Im) = log10 Km1(0) + 3 D(Im) - ([e(Na+, CO32-) - e(Na+, HCO3-)]) mNa+ (8)
Previous studies of the Ce III( )-CO - -H O
3 2
2 system indicate that the limiting carbonate complex of Ce(III),
of stoichiometry Ce CO( 3 4)5-, is the major soluble species in media of [CO ] 3
2- > 1.0 M [16]. The electro-chemical equilibrium between Ce(III) and Ce(IV), and its equilibrium potential are :
Ce CO( 3 4)5- + ( j n- 4) CO32- + i n H2O Û 1 n Ce OHn i CO j n i ( ) ( 3)4 - + i n H + + e- (9)
E = EIV III0 / + A log 10 a a a a a IV n H i n III COj n H Oi n 1 4 3 2 2 / / / / + -- (10)
Introducing the expression of activity coefficient (Table 1) into equation (10) :
E = EIV/III + A log10 m m IV n III 1/ (11) where EIV/III = EIV III0 / (I) + A [ i
n log10mH+ - (
j
n - 4) log10mCO32-] (12)
and EIV III0 / (I) = E
IV III/ 0 (0) + A log 10 g g g g IV n H i n III CO j n H O i n a 1 4 3 2 2 / / / / + -- (13)
In cyclic voltametry, the half-wave potential E1/2 corresponds to equal concentrations of the two oxidation states at the working electrode. As the difference between the diffusion coefficients is usually negligible (as we shall verify that the Ce(IV) complex is mononuclear, this approximation is certainly valid), E1/2 is assumed to be equal to EIV/III (equation 11).
Similarly, if CeIV polynuclear species are formed, we have :
(mIII)1/2 = n (mIV)1/2 = mCe / 2 (14)
where mCe is the Ce total molal concentration. The introduction of equation (14) into the Nernst relation (11) gives : E1/2 = EIV/III + A[(1 - 1 n) log10 2 - 1 nlog10 n] (1 -1 n) A log10 mCe (15)
The plot of the experimental data E1/2 as a function of log10 mCe gives (equation 15) a straight line with slope (1-1/n) which we shall use for the determination of the stoichiometric coefficient n of the Ce(IV) complex. For n = 1, E1/2 = EIV/III (equation 15). When n is known, equation 12 and the data (EIV/III, mCO
3
2-, pH) give the
stoichiometric coefficients i and j, and the formal potential EIV III0 / (I) at ionic strength I. Results and discussion
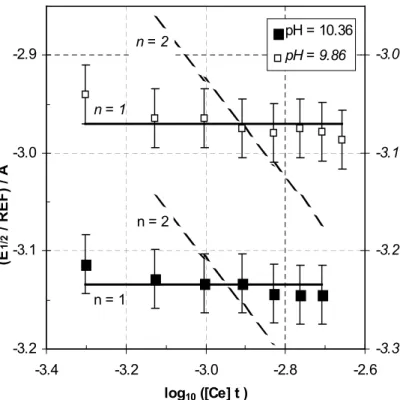
As [Ce]t had no influence on E1/2 (figure 2), the Ce(IV) complex is mononuclear (that is n = 1). The experimental data were then interpreted with the simplified equation (12a) :
EIV/III = EIV III0 / (I) + A (i log10 mH+ - (j - 4) log10mCO 3
2-) (12a)
The effects of the ionic strength variations during the experiments were estimated to be relatively small : among all the chemical conditions investigated during the redox measurements, the Debye-Hückel term D(Im) varied from 0.255 to 0.259 and the Na+ molal concentration varied from 3.03 to 3.10 mol/kg. This induced a maximum variation of log (10 )
3 2
gCO- of 0.015 (from -1.280 to -1.265) which corresponds to a variation of the
potential of less than 1mV (which is negligible). In addition, all the attempts to fit the experimental data according to equations (12) and (13) by taking into account the variations of the activity coefficients (by using the SIT formula) proved to be unsuccessful because the ionic strength changes were not large enough. Hence, all activity coefficients and the EIV III0 / (I) potential, could be considered as constant. The small ionic strength
variations were neglected in the qualitative slope analysis (figures 3 and 4) but not for the following calculations. All the experimental data could be interpreted with the simplified equation (12a) where the i and (j - 4) coefficients had clearly to be set to 0 and 2 respectively (figures 3 and 4). Nevertheless, other sets of (i, j) coefficients were tried e.g. the Ce CO( 3 5)6- species which gave poorer standard deviation and some
systematic deviations, while species such CeHCO CO3( 3 4)5-, CeHCO CO
3 3 5
7
( ) -, CeOH CO( )
3 5 7- or
CeOH CO( 3 6)9- gave theoretical curves completely erroneous when compared with experimental data. Finally
the following interpretation is proposed : Ce CO( 3 4)5- + 2 CO
3
2- Û Ce CO( ) 3 6
8- + e- (9a)
and EIV/III = EIV III0 / (I) - A 2 log10mCO
3
2- (12b)
A value of EIV III0 / (I) = 0.155
3 ± 0.0023 V/SHE (where the uncertainty is 1.96 times the standard deviation) was fitted. Assuming partial dissociation of the Ce(IV) limiting complex did not significantly improve the fitting, which gave log10k6IVm = 0.459 and E
IV III/
0 (I) = 0.161
consistent with the first estimation, the uncertainty was increased and kIV6m was considered as a maximum possible value (table 1).
The Ce(IV/III) redox potential shift between carbonate and non complexing media is determined by the ratio of the Ce(III) and Ce(IV) complexing constants. To avoid ionic strength correction we used the bmIII4( ) andIm
bmIV6( ) definitions given in table 1. For these constants, as for EIm IV III0 / (I )m , the numerical values are valid for
a given ionic strength and a given Na+ concentration (here 3.06 mol.kg-1), whatever the major anion in the aqueous solution. The thermodynamical cycle is calculated in the following way using the definitions given in table 1. E = EIV/III + A log10 m m IV III (11a) = ECe4 Ce3 0 +/ +(0) + A log10 a a Ce Ce 4 3 + + = ECe4 Ce3 0
+/ +(0) + A [log10bmIII4( ) - logIm 10bmIV6( ) - 2 logIm 10mCO 3 2- + log10 m m IV III ] Comparing with equation (12b) the potential shift is
EIV III0 / (I )
m - ECe4 Ce3
0
+/ +(0) = A [logbmIII4( ) - logIm bmIV6( ) ]Im (16)
This last formula was used to estimate the formation constant of the Ce(IV) limiting carbonate complex (table 1).
Cyclic voltametry was successfully used at high ionic strength but some difficulties arose at lower ionic strength, probably due to precipitation when the Ce(IV) limiting carbonate complex is dissociated. This work confirms that Ce(IV) forms the Ce CO( 3 6)8- complex, while the U and transU limiting carbonate complexes
are rather An CO( 3 5)6- in similar chemical conditions (0.7M< [CO ] 3
2- <2M. This result corroborates the conclusions of Salvatore et al. [15] obtained at higher ionic strength, but the interpretation of our data is more straightforward since our method avoided any Na+ activity coefficient correction. However, our methodology did not allow the determination of the Na+ content of the Ce CO( 3 5)6- complex, as suggested in reference [15].
The estimation of the Ce CO( 3 5)6- formation constant value (table 1) is one order of magnitude or slightly
higher than for actinide(IV) [1]. The chemical form, Ce CO( 3 6)8-, of the limiting carbonate complex of Ce(IV)
is consistent with the known coordination chemistry of Ce(IV) and Th(IV), e.g. the NO3- group, which is
isoelectronic with the CO32- group, gives rise to 12-coordinated nitrate complexes like Ce NO( ) 3 6
2- and
Th NO( 3 6)2- in which the 6 bidentate groups define a nearly regular icosahedron [22,23] (In that respect, it
seems that the size of the metal is not necessarily a dominant factor [22]). In addition, the same icosahedral coordination geometry was found for the Th CO( 3 6)8- anion in the solid state structure of tuliokite
Na6BaTh(CO3)6.6H2O [14]. Further information about the molecular and solid state structure of the limiting carbonate complex of Ce(IV) could be obtained by using XRD and EXAFS spectroscopy techniques, which have already been used successfully to clarify the structure of the limiting complex Pu CO( 3 5)6-[9]. The ratio
b6IV/b4III of 28.6 calculated in the present work at Im = 4.33 mol.kg-1 seems consistent with the reported estimation of 25 (using very approximate ionic strength corrections) at Im = 12 mol.kg-1 [15] : the difference is in the order of magnitude of the activity coefficient (or ion-pairing, as proposed in [15]) corrections. As for Ce(IV), no evidence of any mixed OH-- CO32- or polynuclear Ce(IV) complex was found. For quantitative
comparison with actinides(IV), further work could consist in studying the Ce CO( 3 6)8- dissociation into
Ce CO( 3 5)6- (probably), and performing a similar investigation on the Am(IV)/Am(III) system [6] with proper
junction potential measurements and I corrections [7, 8]. Similar electrochemical studies referring to the Np(IV) [4] and Pu(IV) [5, 18] limiting carbonate complexes would be more tedious as those species are involved in irreversible redox couples only.
References
[1] Vitorge, P. : CEA-BIB-246 (1995).
[3] Grenthe, I., Fuger, J., Konings, R.J.M., Lemire, R.J., Muller, A.B., Nguyen-Trung, C., Wanner, H. :
NEA-TDB Chemical thermodynamics of uranium. Elsevier Science Publishers B.V., 1992, 715p.
[4] Delmau, L.H., Vitorge, P., Capdevila, H. : CEA-N-2807 (1995). [5] Capdevila, H., Thèse de l’Université de Paris-Sud (05/06/1992).
[6] Bourges, J.Y., Guillaume, B., Koehly, G., Hobart, D.E., Peterson, J.R. : Inorg. Chem., 22 (1983) 1179-1184.
[7] Robouch, P. : Thèse de l’Université Louis Pasteur, Strasbourg (13/11/1987).
[8] Silva, R., Bidoglio, G., Rand, M., Robouch, P., Wanner, H., Puigdomenech, I. : NEA-TDB Chemical
thermodynamics of americium. Elsevier Science Publishers B.V., 1995, 374p.
[9] Clark, D.L., Conradson, S.D., Keogh, D.W., Neu, M.P., Palmer, P.D., Rogers, R.D., Runde, W., Scott, B.L., Tait, C.D. : communication T3-A1 and Neu, M.P., Clark, D.L., Conradson, S.D., Scott, B.L., Palmer, P.D., Reilly, S.D., Runde, W.H., Tait, C.D. : communication T3-B5, Actinides ’97 International
Conference, Baden-Baden, Germany, September 21-26, 1997.
[10] Dervin, J. : Thèse de l’Université de Reims, France (1973).
[11] Dervin, J., Faucherre, J. : Bull. soc. chim. France n°542 - 11 (1973) 2926-2929. [12] Dervin, J., Faucherre, J. : Bull. soc. chim. France n°543 - 11 (1973) 2930-2933. [13] Haltier, E., Fourest, B., David, F. : Radiochim. Acta 51 (1990) 107-112
[14] Clark, D. L., Hobart, D. E., Neu, M. P. : Chem. Rev. 95, (1995) 25-48. [15] Salvatore, F., Vasca, E. : J. Coord. Chem., 1990, Vol.21, 237-246.
[16] Ferri, D., Grenthe, I., Hietanen, S., Salvatore, F. : Act. Chem. Scand., A37 (1983) 359-365
[17] Grenthe, I., Plyasunov, A.V., Spahiu, K. : Modelling in Aquatic Chemisty. pages 325-426 edited by Grenthe, I. and Puigdomenech, I. OECD-NEA Paris (1997).
[18] Capdevila, H., Vitorge, P. : Radiochim. Acta 68, 51-62 (1995).
[19] Pitzer, K.S. : Activity Coefficients in Electrolyte Solutions , 2nd edition, edited by Pitzer K.S., pages 73-153 (1991).
[20] Bard, A.J., Parsons, R., Jordan J. : Standard Potential in Aqueous Solutions, Dekker M. Inc., New York (1985), NY 10016, p. 304.
[21] Sillén, L.G., Martell, A.E. : Stability constants of metal ion complexes. Special Publ. No.17, 1964, 754p and Suppl. No. 1, Special Publ. No. 25, 1971, 865p. The Chemical Society, London ; Högfeldt, E. :
Stability constants of metal ion complexes, part A : inorganic ligands. IUPAC chemical data series (21),
1982, 310p, Oxford.
[22] Greenwood, N.N., Earnshaw, A. : Chemistry of the Elements, Pergamon Press, 1984. [23] Cotton, S., Lanthanides and Actinides, Macmillan Physical Science Series, 1991.
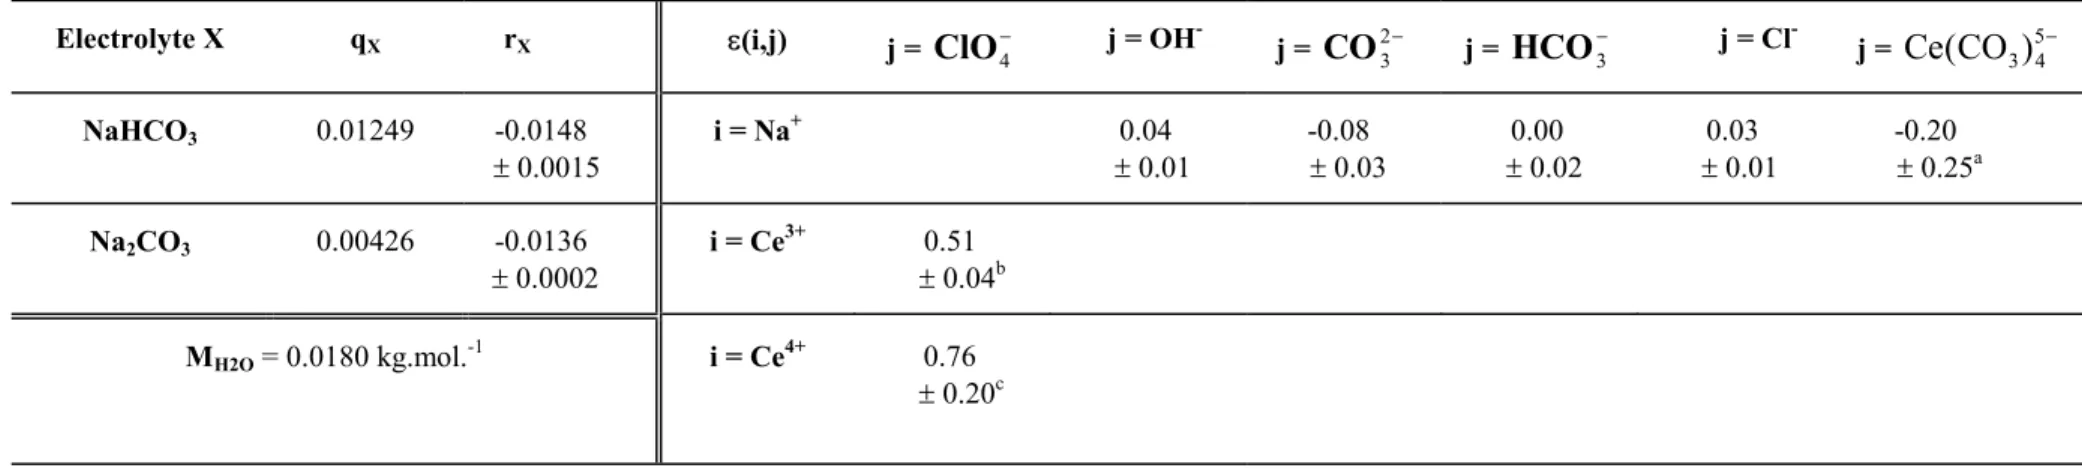
Table 1. Physical and chemical parameters used or determined in this study.
For a pure electrolyte : log10aH O2 » r m , p = m / c and log10 p » q m ; where c and m denote the molar (mol.l-1 or M) and molal (mol.kg-1) concentrations of the salt in solution. When the electrolyte is a mixture of two salts (Na2CO3, NaHCO3), the approximations log10 p » q1m1 + q2m2 and log10aH O2 » r1m1 + r2m2 are used, where qx and rx are the q and r parameters for the pure salt x, and mx is the molal concentration of the salt x in the mixture. p values (l.kg-1) are taken from [8]. The q and r values are
calculated in this work. The log10aH O2 values (to obtain r) are calculated from Pitzer parameters [19]. ci, mi, ai and gi denote respectively, the molar (mol.l-1 or M)
concentration, the molal (mol.kg-1) concentration, the molal activity and the activity coefficient of the species i : ai = mi gi and p = mi / ci. The coefficients gi. are calculated by using the SIT formula [3, 8, 1]. The SIT coefficients e(MzM,AzA) (kg.mol-1) are taken from [8] ; the uncertainty is increased for the SIT coefficients which are estimated by analogy.
Electrolyte X qX rX e(i,j) j = ClO
4 - j = OH -j = CO32- j = HCO3- j = Cl- j = Ce CO( 3 4)5 -NaHCO3 0.01249 -0.0148 ± 0.0015 i = Na+ 0.04 ± 0.01 -0.08 ± 0.03 0.00 ± 0.02 0.03 ± 0.01 -0.20 ± 0.25a Na2CO3 0.00426 -0.0136 ± 0.0002 i = Ce3+ 0.51 ± 0.04b MH2O = 0.0180 kg.mol.-1 i = Ce4+ 0.76 ± 0.20c
aEstimated by analogy with U CO( )
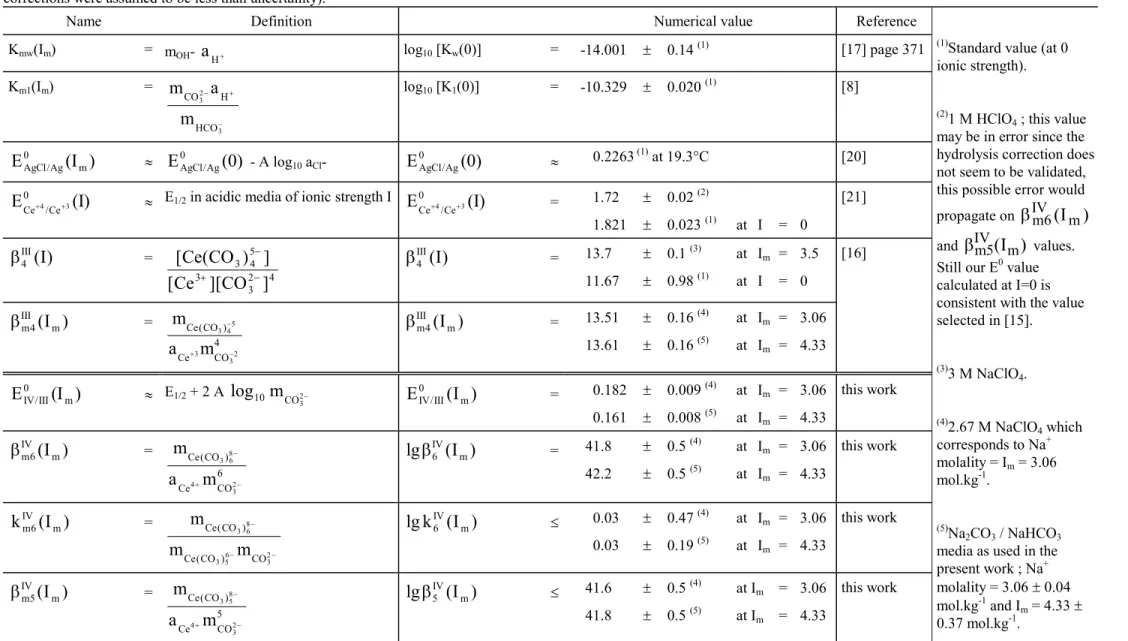
Table 2. Thermodynamic equilibrium constants and redox potentials used or determined in this work.
The equilibrium constants are defined in molal units (as in the text, and when nothing else is stated for numerical values). Subscript m is used for molal units (only when needed in order to make the difference with molar units). Im = 1
2 z mi i 2
å
is molal ionic strength. A = R T ln10 / F, typically 0.05916 and 0.05803 V at 25 and 19.3°C. IV and III denote the Ce(IV) and Ce(III) limiting carbonate complexes. For each constant, the first value is usually the numerical datum taken from the corresponding reference, while values at other ionic strengths are calculated in this work by means of the SIT formula [3] by using the e values listed in table 1. The EIV III0 / (4.33m) (V/SHE) value was measured in this work in a0.46 m NaHCO3 1.29 m Na2CO3 aqueous solution at 19.3°C. bIVm6( .4 33m) is calculated with equation (16) by using the necessary auxiliary data at about 25°C (the temperature
corrections were assumed to be less than uncertainty).
Name Definition Numerical value Reference
Kmw(Im) = mOH- aH+ log10 [Kw(0)] = -14.001 ± 0.14 (1) [17] page 371 Km1(Im) = m a m CO H HCO 3 2 3 - + -log10 [K1(0)] = -10.329 ± 0.020 (1) [8] EAgCl Ag0 / (I )
m » EAgCl Ag0 / (0) - A log10 aCl- EAgCl Ag0 / (0) » 0.2263
(1) at 19.3°C [20]
ECe+4Ce+3
0
/ (I) » E1/2 in acidic media of ionic strength I ECe+4Ce+3
0 / (I) = 1.72 ± 0.02 (2) 1.821 ± 0.023 (1) at I = 0 [21] b4 III( )I = [ ( ) ] [ ][ ] Ce CO Ce CO 3 4 5 3 3 2 4 -+ -b4 III( )I = 13.7 ± 0.1 (3) at Im = 3.5 11.67 ± 0.98 (1) at I = 0 [16] bm III m I 4( ) = m a m Ce CO Ce CO ( 3 4)5 3 32 4 -+ -bm III m I 4( ) = 13.51 ± 0.16 (4) at I m = 3.06 13.61 ± 0.16 (5) at I m = 4.33 EIV III0 / (I ) m » E1/2 + 2 A log10mCO32- EIV III/ Im 0 ( ) = 0.182 ± 0.009 (4) at Im = 3.06 0.161 ± 0.008 (5) at I m = 4.33 this work bmIV6( )Im = m a m Ce CO Ce CO ( 3 6)8 4 3 2 6 -+ -lgb6IV( )Im = 41.8 ± 0.5 (4) at I m = 3.06 42.2 ± 0.5 (5) at I m = 4.33 this work kmIV I m 6( ) = m m m Ce CO Ce CO CO ( ) ( ) 3 68 3 56 32 -- -lgkIV( )I m 6 £ 0.03 ± 0.47 (4) at I m = 3.06 0.03 ± 0.19 (5) at I m = 4.33 this work bm IV m I 5( ) = m a m Ce CO Ce CO ( 3 5)8 4 3 2 5 -+ -lgb5 ( ) IV m I £ 41.6 ± 0.5 (4) at Im = 3.06 41.8 ± 0.5 (5) at I m = 4.33 this work
(1)Standard value (at 0
ionic strength).
(2)1 M HClO
4 ; this value
may be in error since the hydrolysis correction does not seem to be validated, this possible error would propagate on bIVm6(Im) and bmIV5(Im) values. Still our E0 value
calculated at I=0 is consistent with the value selected in [15]. (3)3 M NaClO 4. (4)2.67 M NaClO 4 which corresponds to Na+ molality = Im = 3.06 mol.kg-1. (5)Na 2CO3 / NaHCO3
media as used in the present work ; Na+ molality = 3.06 ± 0.04 mol.kg-1 and I m = 4.33 ± 0.37 mol.kg-1. Footnotes :
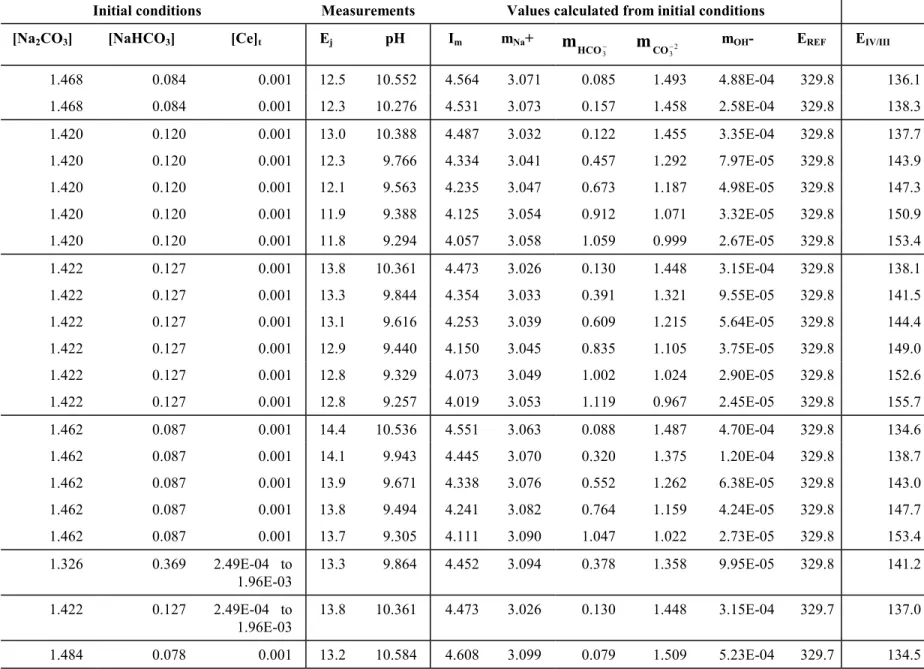
Table 3: Ce(IV/III) formal potential measured in concentrated carbonate/bicarbonate media
From the Na2CO3 and NaHCO3 initial concentrations (noted [Na2CO3] and [NaHCO3]) and the pH values measured while the acidic titration with CO2 gas, the speciation is calculated
by solving the system of equations (1 to 8) with the parameters listed in tables 1 and 2. [i] and mi denote the molar (mol.l-1 or M) and molal (mol.kg-1) concentrations of the species i.
The glass electrode is calibrated in activity unit, with buffers at the same molar ionic strength as that of the initial test solutions. The potential E1/2, mean value of the oxidation and
reduction peaks, is measured on the voltamograms. It is then corrected for the junction potential Ej (mV), and the reference electrode potential EREF (mV/SHE) (calculated with the
parameters of table 1 as indicated in the text) to give EIV/III (mV/SHE).
Initial conditions Measurements Values calculated from initial conditions
[Na2CO3] [NaHCO3] [Ce]t Ej pH Im mNa+ m
HCO3- mCO3-2 mOH- EREF EIV/III 1.468 0.084 0.001 12.5 10.552 4.564 3.071 0.085 1.493 4.88E-04 329.8 136.1 1.468 0.084 0.001 12.3 10.276 4.531 3.073 0.157 1.458 2.58E-04 329.8 138.3 1.420 0.120 0.001 13.0 10.388 4.487 3.032 0.122 1.455 3.35E-04 329.8 137.7 1.420 0.120 0.001 12.3 9.766 4.334 3.041 0.457 1.292 7.97E-05 329.8 143.9 1.420 0.120 0.001 12.1 9.563 4.235 3.047 0.673 1.187 4.98E-05 329.8 147.3 1.420 0.120 0.001 11.9 9.388 4.125 3.054 0.912 1.071 3.32E-05 329.8 150.9 1.420 0.120 0.001 11.8 9.294 4.057 3.058 1.059 0.999 2.67E-05 329.8 153.4 1.422 0.127 0.001 13.8 10.361 4.473 3.026 0.130 1.448 3.15E-04 329.8 138.1 1.422 0.127 0.001 13.3 9.844 4.354 3.033 0.391 1.321 9.55E-05 329.8 141.5 1.422 0.127 0.001 13.1 9.616 4.253 3.039 0.609 1.215 5.64E-05 329.8 144.4 1.422 0.127 0.001 12.9 9.440 4.150 3.045 0.835 1.105 3.75E-05 329.8 149.0 1.422 0.127 0.001 12.8 9.329 4.073 3.049 1.002 1.024 2.90E-05 329.8 152.6 1.422 0.127 0.001 12.8 9.257 4.019 3.053 1.119 0.967 2.45E-05 329.8 155.7 1.462 0.087 0.001 14.4 10.536 4.551 3.063 0.088 1.487 4.70E-04 329.8 134.6 1.462 0.087 0.001 14.1 9.943 4.445 3.070 0.320 1.375 1.20E-04 329.8 138.7 1.462 0.087 0.001 13.9 9.671 4.338 3.076 0.552 1.262 6.38E-05 329.8 143.0 1.462 0.087 0.001 13.8 9.494 4.241 3.082 0.764 1.159 4.24E-05 329.8 147.7 1.462 0.087 0.001 13.7 9.305 4.111 3.090 1.047 1.022 2.73E-05 329.8 153.4 1.326 0.369 2.49E-04 to 1.96E-03 13.3 9.864 4.452 3.094 0.378 1.358 9.95E-05 329.8 141.2 1.422 0.127 2.49E-04 to 1.96E-03 13.8 10.361 4.473 3.026 0.130 1.448 3.15E-04 329.7 137.0 1.484 0.078 0.001 13.2 10.584 4.608 3.099 0.079 1.509 5.23E-04 329.7 134.5
7.5 8.5 9.5 10.5 11.5 7.5 8.5 9.5 10.5 11.5 pH = - log10 [aH+] M easured pH pH = 10
Fig. 1. Glass electrode calibration. The calibration was checked by two titrations of a
1 M NaHCO3 solution with a 1 M NaOH solution at T = 19.3 ± 1.0°C. The theoretical pH (-log10 aH+ and not -log10 [H
+]) values were calculated by using the equilibrium
constants and SIT coefficients listed in tables 1 and 2. The observed deviation at pH>10 was taken into account in the treatment of the experimental data of the Ce(IV)/Ce(III) redox potential. No deviation (of the glass electrode slope) was observed at pH<8.2 where NaHCO3/CO2(g) buffers were used for the pH calibration.
-3.2 -3.1 -3.0 -2.9 -3.4 -3.2 -3.0 -2.8 -2.6 log10 ([Ce] t ) -3.3 -3.2 -3.1 -3.0 pH = 10.36 pH = 9.86 n = 1 n = 2 n = 2 n = 1 (E 1/ 2 / REF) / A
Fig. 2.Influence of the cerium total concentration on the Ce(IV)/Ce(III) redox
potential in concentrated carbonate/bicarbonate media. Two sets of experiments were
performed: [Na+] = 3.0 (or 3.1) mol.kg-1, [ CO32-] = 1.45 (or 1.36) mol.kg-1, [HCO
(or 0.38) mol.kg-1 and pH = 10.36 (or 9.86) respectively, T = 19.3 ± 1.0°C, A = 58.03 mV/log10 unit. This figure shows that the measured redox potential EIV/III is independent of the Ce total concentration. Since in these conditions the Ce(III) major aqueous species is mononuclear [16], the Ce(IV) species is also mononuclear (equation 15). Theoretical curves are plotted for n = 1 (solid line) and n = 2 (dotted line), where n is the Ce
stoichiometric coefficient in the Ce(IV) aqueous species (for n > 2 the deviation between the experimental data and the theoretical lines are even greater than for n = 2).
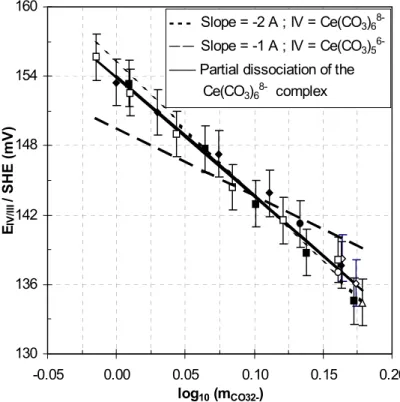
130 136 142 148 154 160 -0.05 0.00 0.05 0.10 0.15 0.20 log10 (mCO32-) EIV/III / SH E ( m V) - - - Slope = -2 A ; IV = Ce(CO3)6 8-__ 8-__ Slope = -1 A ; IV = Ce(CO 3)5
6-_____ Partial dissociation of the
Ce(CO3)68- complex
Fig. 3.Influence of the CO32- concentration on the Ce(IV/III) formal potential in concentrated carbonate/bicarbonate media. [Na+] = 3.06 mol.kg-1,
1.00 < [ CO32-] < 1.45 mol.kg-1, [Ce]
t = 0.001 M, 9.2 < pH < 10.6, T = 19.3 ± 1.0°C, A = 58.03 mV/log10 unit. This figure shows that, within experimental uncertainties, the
measured data falls into a single straight line (dotted line), with a slope corresponding to the theoretical one assuming that two CO32- ions are exchanged during the redox reaction.
Since in these conditions the Ce(III) major species is Ce CO( 3 4)5- [16], the Ce(IV) species is
Ce OH( ) (i CO ) i
3 6- -8 ; As the pH influence plot (figure 4) confirms that i=0, the major Ce(IV)
complex is then Ce CO( 3 6)8-. That species is possibly partially dissociated into Ce CO( ) 3 5
-10 -5 0 5 10 9.0 9.5 10.0 10.5 pH = -log10 aH+ EIV/III -E 0 IV/III (I ) +2 *A*l og 10 (m CO3 2 -) ( m V/SH E) _____ Slope = 0 ; IV = Ce(CO3)6 8-- 8-- 8-- Slope = 8--1 A ; IV = Ce(CO3)6(OH)
9-__ 9-__ Slope = +1 A ; IV = Ce(CO3)5(HCO3)
7-Fig. 4.
Fig. 4.pH influence on the Ce(IV/III) formal potential in concentrated
carbonate/bicarbonate media. [Na+] = 3.06 mol.kg-1, 1.00 < [ CO32-] < 1.45 mol.kg-1, [Ce] t = 0.001 M at T = 19.3 ± 1.0°C, A = 58.03 mV/log10 unit. The experimental data are the same as in figure 3. This figure shows that the corrected redox potential EIV/III - EIV III0 / ( )I + A 2 log10m
CO3
(equation 12a) is independent of pH. The Ce(IV) and Ce(III) aqueous species have then the same OH- stoichiometric coefficient (i = 0) : since the Ce(III) and Ce(IV) major species are Ce CO( 3 4)5- [16] and Ce OH CO
i
i
( ) ( 3 6)- -8 (Figure 3), the formula of
the the Ce(IV) complex is finally Ce CO( 3 6)8-, which is in agreement with the interpretation