Publisher’s version / Version de l'éditeur:
Canadian Geotechnical Journal, 12, 3, pp. 271-288, 1975-08
READ THESE TERMS AND CONDITIONS CAREFULLY BEFORE USING THIS WEBSITE.
https://nrc-publications.canada.ca/eng/copyright
Vous avez des questions? Nous pouvons vous aider. Pour communiquer directement avec un auteur, consultez la première page de la revue dans laquelle son article a été publié afin de trouver ses coordonnées. Si vous n’arrivez pas à les repérer, communiquez avec nous à PublicationsArchive-ArchivesPublications@nrc-cnrc.gc.ca.
Questions? Contact the NRC Publications Archive team at
PublicationsArchive-ArchivesPublications@nrc-cnrc.gc.ca. If you wish to email the authors directly, please see the first page of the publication for their contact information.
NRC Publications Archive
Archives des publications du CNRC
This publication could be one of several versions: author’s original, accepted manuscript or the publisher’s version. / La version de cette publication peut être l’une des suivantes : la version prépublication de l’auteur, la version acceptée du manuscrit ou la version de l’éditeur.
Access and use of this website and the material on it are subject to the Terms and Conditions set forth at
Thermal conductivity laboratory studies of some MacKenzie Highway
soils
Penner, E.; Johnston, G. H.; Goodrich, L. E.
https://publications-cnrc.canada.ca/fra/droits
L’accès à ce site Web et l’utilisation de son contenu sont assujettis aux conditions présentées dans le site LISEZ CES CONDITIONS ATTENTIVEMENT AVANT D’UTILISER CE SITE WEB.
NRC Publications Record / Notice d'Archives des publications de CNRC:
https://nrc-publications.canada.ca/eng/view/object/?id=140a4ec1-361b-4ada-91fd-9153d6eceafc https://publications-cnrc.canada.ca/fra/voir/objet/?id=140a4ec1-361b-4ada-91fd-9153d6eceafc
Canadian
Geotechnical
Revue
canadienne de
Journal
geotechnique
Published b y Prrblie'e par
THE NATIONAL RESEARCH COUNCIL OF CANADA LE CONSEIL NATIONAL DE RECHERCHES DU CANADA
Volume 12 Number 3 August 1975 Volume 12 numtro 3 aoDt 1975
Thermal Conductivity Laboratory Studies of Some Mackenzie Highway Soils1
Division oj'Brrilding Reseurch, Nrrtiot~ctl Resecrrclz Coltncil of Cnnndn, Ottnwc~, Cnnctdn K I A OR6
Received August 23, 1974 Accepted March 24, 1975
Thermal conductivities were determined for 10 fine-grained soils obtained from potential borrow pit areas along the proposed route of the Mackenzie Highway, N.W.T., and from the nearly completed section of the Mackenzie Highway, just south of Inuvik. The moisture contents and densities of the test specimens were based on the standard Proctor density curves. The measurements were made by the transient heat-flow method using a line heat source. The values were in good agreement with Kersten's data obtained by the steady-state heat flow method.
Grain-size, mineralogical analyses of the clay-size fraction, Atterberg limits, and standard Proctor density determinations are given for all 10 soils.
La conductivit.6 thermique a kt6 determinke sur 10 sols a grains fins provenant, de zones d'emprunt possibles le long du track propose de la route du Mackenzie, T.N.O., et d'une section presque achevke de cette route, immkdiatement au sud d'Inuvik. Les teneurs en eau et densites des Cchantillons ktaient basees sur les courbes de densite Proctor standard. Les mesures ont kt6 faites par la mkthode du flux de chaleur transitoire en utilisant une source de c h a l e ~ ~ r linkaire. Les valeurs obtenues Ctaient en accord avec les donnees de Kersten obtenues i I'aide d'une mkthode
flux de chaleur en regime permanent.
La granulomktrie, les analyses minkralogiques de la fraction argileuse, les limites d'Atterberg et les densitks Proctor standard sont donnees pour les 10 sols6tudiCs.
[Traduit par la Revue]
An important problem of highway design over ice-rich permafrost is to estimate accu- rately the thickness of the embankment re- quired to prevent thawing and the subsequent settlement that causes road unserviceability
and costlv maintenance. A reasonable medic- I
tion of the change in ground temperature can be made for a given location if climatic data are available and the thermal and physical properties of the road fill and underlying permafrost are known. This paper is concerned with the determination of the thermal conduc-
'Presented at the 27th Canadian Geotechnical Con- ference "New Frontiers" held in Edmonton, Alberta, November 7-9, 1974.
tivity of embankment materials that are likely to be used in the construction of the Mackenzie Valley Highway.
The investigations were initiated at the request of the Mackenzie Highway Environmental Working Group (EWG). The EWG, an inter- departmental committee of the Federal Gov- ernment, was formed to review designs for the Mackenzie Highway and to assess its impact on all aspects of the environment.
Initial explorations along the proposed route for the highway indicated that coarse-grained materials, usually used for embankment con- struction, would not be readily available in some areas. It was considered important, there-
272 CAN. GEOTECH.
fore, that the thermal behavior of the available fine-grained materials be established in order that the proposed designs could be properly evaluated.
Information on the thermal characteristics of soils is sparse; much less is known for north- ern soils. The Division of Building Research of the National Research Council of Canada was invited for this reason to undertake a study of the thermal conductivities of some of the fine- grained soils that might be used for the con- struction of the Mackenzie Highway.
It was intended, originally, that soils for the study would be taken from established borrow sites. This was not possible in most cases, but it is believed that the samples collected are representative of some large fine-grained de- posits found in the Mackenzie Valley. It was not necessary to retain the natural structure, in situ moisture content, or temperature of the soils because these would change in any case during the construction phase.
Detailed information was not available con- cerning the conditions that would prevail dur- ing construction in particular areas or on the state of the material after placement, e.g., time of year of construction, method of place- ment (in well-compacted layers or as compacted frozen lumps), and soil moisture content/den- sity relationships. It was decided, therefore, to use the standard Proctor curves to select the sample density and associated moisture content for thermal conductivity determinations in order to give the study greater engineering sig- nificance.
Selection of Thermal Conductivity Test Method
Steady-state Method
For the steady-state method a uniform tem- perature gradient is applied and the sample is allowed to condition thermally until constant heat-flow conditions are attained. Kersten
(1949) used this method yith a AT of 10 F
deg (5.6 C deg) across a sample 4.25 in. (10.8 cm) thick. Such conditions can induce ther- mally activated diffusion of water in both
frozen and unfrozen unsaturated soils
(Hutcheon 1958). If the sample is of finite thickness, water or ice accumulates at the cold end and drying occurs at the warm end, but the extent to which this occurs depends on the
J . VOL. 12, 1975
duration and magnitude of the imposed tem- perature gradient, the nature of the soil, and the degree of saturation. The process is nor- mally more unpredictable in the field than under precisely controlled laboratory condi- tions (Hutcheon 1958).
The ice-water ratio imposes further difficul- ties in thermal conductivity measurements since it is a function of temperature in fine-grained soils (Penner 1970). When samples are sub- jected to a temperature gradient (as in the steady-state method) the soil sample does not have a constant ice-water ratio throughout its length. Because the thermal conductivity of ice is more than four times greater than that f o r water, the thermal conductivity of the sample would also not be constant.
Probe Method
The use of the transient heat-flow method for determining thermal conductivities of un- saturated soils is also not without difficulties. The thermal probe or needle is the most com- mon apparatus used in the transient heat-flow technique. The problem of induced moisture flow in an unsaturated system is similar to the steady-state method but may be more critical as thc temperature gradients next to the probe can be much greater than those that usually occur in
the steady-state method. Woodside ( 1958)
suggested that increasing the diameter of the probe and using low heat inputs would reduce the thermal gradients and thus decrease the induced moisture flow. Large diameter probes arc usually not sufficiently long to satisfy the requirement of a line heat source assumed for the development of the simple theory describ- ing their behavior.
Method Employed
In recognition of the difficulties associated with the two main mcthods, particularly for un- saturated soils, the line heat source probe tech- nique was considered the preferred method. The method and the probe (Fig. 1 ) used were similar to those used by D'Eustachio and Schreiner (1952), Woodside (1958), and
Penner (1963, 1970). The temperature
gradient in the vicinity of the probe was kept as small as possible by maintaining a low power input to the heater but consistent with the ability of the temperature measuring equip- ment to detect temperature changes in the
PENNER ET AL.: THERMAL CONDUCTIVITY LABORATORY STUDIES
r
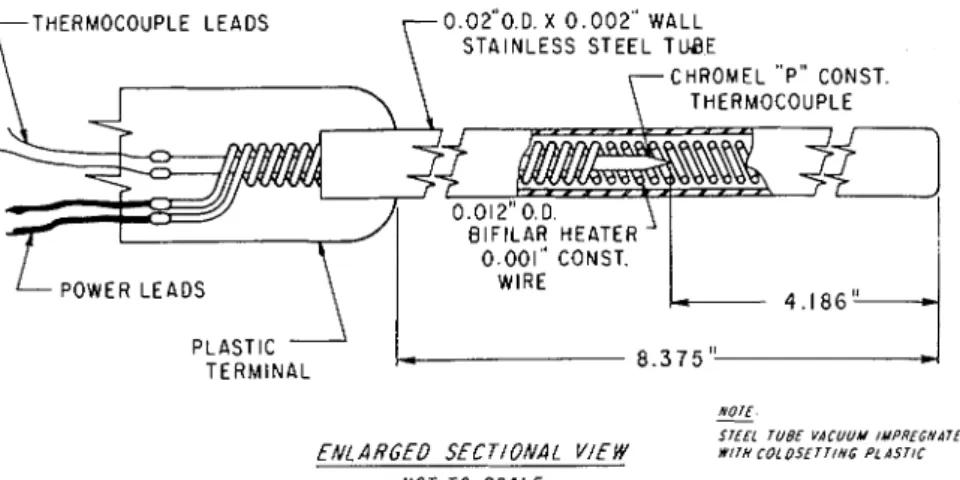
THERMOCOUPLE LEADS 0.02-O.D. X 0 . 0 0 2 " WALL STAINLESS STEEL TUBE\
CHROMEL " P " CONST. THERMOCOUPLET
I 0.001" CONST. I i POWER LEADS\
1
1
-1 . -1 8 6 ' 4 PLASTIC T E R M I N A L NOIE -SIEEL TUBE VACUUM IMPREGNATE0
ENL ARGEO SECTIONAL V/EW X I I X COL OSETTING P L A S T I C
NOT TO SCALE
FIG. 1. Schematic diagram of thermal probe (courtesy Custom Scientific Instruments, Inc.). probe with acceptable limits of accuracy. An
advantage of the probe method, compared with the steady-state method, is that the ther- mal conductivity determination is of short duration. This is a time-saving feature which also reduces the time that the sample is sub-
jected to thermal gradients
-
the cause ofthermally activated diffusion. In general the apparatus is less expensive than steady-state equipment and is simpler to operate.
The line heat source was a hollow probe,2 8.375 in. (21.27 cm) long, with an outside diameter of 0.02 in. (0.051 cm). It contains a uniformly spaced spiral heating coil with a nominal electrical resistance of about 1600 ohms. A constantan-chromel P thermocouple is located inside the spiral heater halfway along the probe. Some of the probe thermocouples were calibrated by the Division of Physics, National Research Council of Canada. Probes acquired more reccntly were calibrated by com- paring them at several temperatures with those previously calibrated. A further calibration check was made later in the study using a calibrated platinum resistance thermometer and a G2 Mueller bridge with a temperature measuring capability of ?0.001 C deg.
Power to the probe was supplied with an electronically controlled constant current source. Current constancy was checked by continuously monitoring the voltage across the heater ter- minals. The voltage output of the probe ther- mocouple, referenced to an ice bath, was mea-
'The probe shown in Fig. l was obtained from
Custom Scientific Instruments Inc., N.J., U.S.A.
sured at 20 to 30 s intervals with a multipoint data acquisition system. The signal was pre- amplified by a factor of 100 to obtain greater precision in voltage measurements.
The level of power supplied to the probe
heater d e ~ e n d e d on the thermal conductivitv
of the soil. For low thermal conductivity sam- ples it was as low as 0.72 W/m;3 for high con- ductivities it was never greater than about 1.7 W/m. The power supply had to be maintained at a level sufficiently high to give temperature changes that could be measured with reason- able precision and accuracy. A probe tempera- ture change of about 0.06 C deg during the conductivity determination was considered to be the lowest acceptable for satisfactory accu- racy. Later in the study an improved signal amplifier was acquired that permitted the tem- pcrature rise of the probe to be reduced to 0.024 C deg.
Conductivity was calculated from the tem- perature rise of the probe using the following equation:
Q
[I] k =- 471.AT(ln t 2 / t l ) = - * 4x
Q
slopewhere t2 and t l are the times corresponding to
the probe temperature change A T and Q is the power input. Plotting the change in temper- ature against the logarithm of the time gives a straight-line relationship. The initial tem- perature rise in the period from 0 to 2 min was not used in the thermal conductivity cal- culation because the In time temperature plot
CAN. GEOTECH. J. VOL. 12, 1975
EQUIVALENT
G R A I N DIA., MMI
M E S H E S P E R I N .I
O P E N I N G ,IN.^
GRAIN SIZE, M M
C L A Y
I
F I N EI
S I L TICGARSE
I
F I N EI
S A N D ~ C O A R S EI
F I N EGRAVEL
ICOARSE
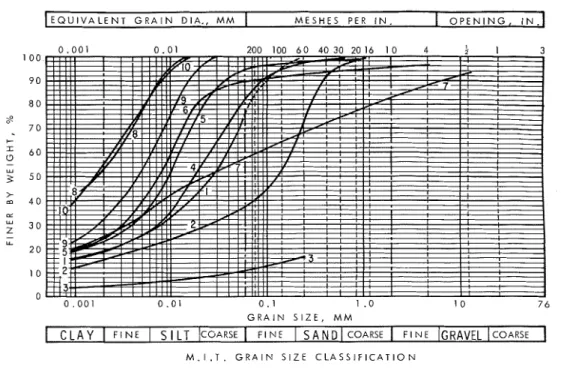
M . I . T . GRAIN SIZE CLASSIFICATIONFIG. 2. Grain-size analysis of soils.
is not linear immediately after the power is turned on.
The computer was used to determine the least squares fit to the In t versus temperature mea- surement, the standard error (S.E.) of mea- surement, the probe temperatures from the
e.m.f. - temperature equations, and the thermal
conductivity, k. Pertinent information such as
current, power supply per unit length of probe, and standard error in the slope of the linear fit to the measurements are given in tabular form along with the thermal conductivity results.
Material
Soil Sampling
Samples were obtained in late May 1973 at thrce locations on the newly completed section of the Mackenzie Highway just south of Inuvik,
N.W.T. Soil No. 1 was taken from a highway
cut at Station 1073
+
00, mile 944; No. 2 fromBorrow Pit No. 7, Station 654
+
00, mile 95 1.5;and No. 3 from the south shoulder of the high-
way at Station 339
+
00, mile 957.5. In earlyJuly 1973, sample No. 4 was obtained from Norman Wells, N.W.T., Nos. 5, 6, and 7 from the Mackenzie Highway 'Training Section' at the Lake of Two Mountains, N.W.T., and Nos.
8, 9, and 10 from the Mackenzic Highway north of Fort Simpson, N.W.T.
Soil Tests
Grain-size Analyses
Hydromcter and sieve analyses (where re- quired) werc carried out according to standard Division of Building Research methods which closely follow A.S.T.M. procedures. Sodium metaphosphate was thc dispersant and samples werc soaked overnight because of previous air drying. Difficulties were encountered in making grain-size analysis for soil No. 3, as it consisted of a poorly cemented friable sandstone. It was not possible to achieve complete breakdown of the material and because of this the hydro- meter part of the combined analysis given for this material is not considered to be particularly reliable. Grain-size distribution curves for the
10 soils are given in Fig. 2. Atterberg Limits
The limits are given in Table 1 for soils Nos.
4 to 10; soils Nos. 1, 2, and 3 were too coarse to give meaningful limits.
Mineralogy of Clay-size Fraction
Samples of the clay-size fraction (<0.002 mm) were separated by sedimentation using Na2C03 as the dispersant. Exchange sites on
PENNER ET AL.: THERMAL CONDUCTIVITY LABORATORY STUDIES 275
TABLE 1 . Atterberg limits
Liquid limit
Soil at 25 blows, Plastic limit, Plasticity index, N o . WL(% MC) WP (% MC) 1, (% M e ) N o plasticity index N o plasticity index N o plasticity index 16 7 9 14 18 11 25
the clays were saturated with M g + + ions by flocculation with MgC12 solution followed by washing in the centrifuge to remove excess salts. X-ray diffraction analyses were carried out on oriented samples by allowing a suspen- sion of the clay to dry slowly on a glass slide. A standard procedure involving four series of diffractograms was followed in the X-ray analyses of the oriented specimens. In the initial series the specimens were X-rayed at a high relative humidity. For the second series the specimens were saturated with a 50/50 glycerol-water mixture and again X-rayed after overnight soaking. For the third series the specimens were heated to 300 OC for an hour in a muffle furnace, cooled, and X-rayed. In the last of the series, samples were reheated to 600 OC for 1 h and again X-rayed on the diffractometer.
Mineralogical analyses were not made on a quantitative basis. Table 2 was prepared, how- ever, to indicate the relative amounts of each mineral species identified.
Compaction
Standard Proctor moisture content/density curves were determined to relate the thermal conductivity values to some standard and rec- ognized engineering test. In addition, the curves provided a method of estimating the moisture content on the dry side of optimum, which aided the selection of moisture content and density for measurements. The unsaturated condition was considered to be the moisture condition that would actually prevail in the constructed road. Figure 3 gives the relation- ship between moisture content and wet and dry density for all 10 soils.
Thermal Conductivity Determinations
Sample Preparations
The thermal conductivity for each of the 10 soils was determined (with apparatus shown in Fig. 4 ) at three moisture content/density conditions selected from the Proctor compac- tion curves. The lowest moisture content for all soils was about 5 % by weight; the second was selected about one-half way up the dry side of the Proctor compaction curve; the third moisture content was just short of optimum. These three density and moisture content sam- ples will be referred to as samples 1, 2, a n d 3 respectively for each soil.
The moisture content of the samples was
established by adding the appropriate amount of water as a fine spray and mixing. They were then stored in plastic bags for several weeks in a constant temperature, high relative humid- ity chamber to attain moisture uniformity.
Samples for the conductivity measurements were prepared in molds using the same com- pactive effort per unit area of the container
TABLE 2. Relative proportions of minerals in the <0.002 mm size fraction Soil Quartz Illite Chlorite Kaolinite Vermiculite
276 CAN. GEOTECH. J. VOL. 12, 1975
M O l S T U R E C O N T E N T , % O F D R Y W T
FIG. 3. Standard Proctor compaction determinations.
and the same soil layer thickness as in the standard Proctor procedure. The sample molds
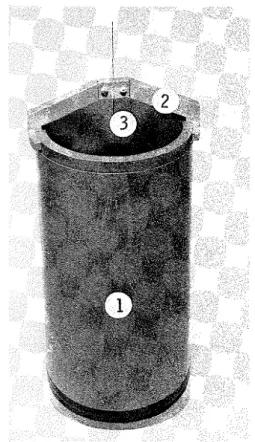
were PVC pipes (Figs. 5 and 6 ) 12 in. (30.48
cm) high and 5.7 in. (14.48 cm) in diameter
with a 0.5 in. ( 1.27 cm) wall thickness. The
diameter of the mold was shown (by calcula- tion) to be large enough so that no temperature rise was experienced at the outer edge of the
sample during the 15 min thermal conductivity
determination.
T o facilitate insertion of the thermal con- ductivity probe after the samples had been pre- pared, a stainless steel wire was tightly held along the center line of the mold between a clamp at the bottom and a rotatable brass yoke at the top during sample preparation. The yoke
was rotated between successive blows during compaction to ensure a uniform density through- out the sample. The sample was built up in layers in this way until it was higher than the length of the thermal conductivity probe. A layer of molten petroleum wax was poured on top of the sample to prevent moisture loss. As indicated earlier, three samples of different density and moisture content were prepared in this way for all soils.
Pro be Insertion
The thermal probes were coated with a sili- con grease and inserted into the sample from the top as the stainless steel wire was withdrawn from the bottom of the mold (Fig. 5 ) . The
P E N N E R E T AL.: T H E R M A L CONDUCTIVITY LABORATORY S T U D I E S 277
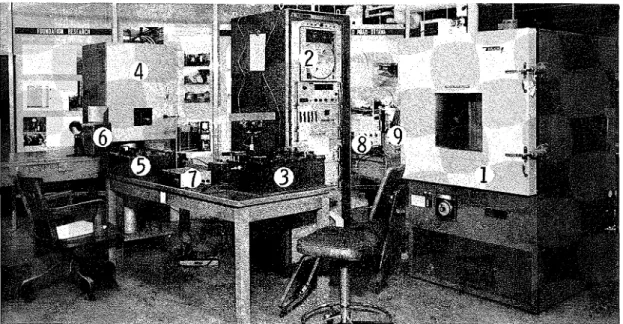
FIG. 4. Apparatus used in thermal conductivity measurements. (1) Constant temperature chamber. ( 2 ) Hewlett Packard data logger. (3) Mueller temperature bridge. (4) Galvanometer (Mueller bridge). (5) K3 universal potentiometer. (6) Galvanometer (K,)
.
( 7 ) Power source (Mueller bridge). ( 8 ) Constant current source (thermal conductivity probes). (9) Ice bath (reference junctions). WIRE H E A T E R P A l R T H E R M O C O U P L E P A l R C H R O M E L P - C O N S T A N 1 0 1 D U R I N G " k " TEST T A N E ( A ) A F T E R S A M P L E P R E P A R A T I O N278 CAN. GEOTECH. J. VOL. 12, 1975
FIG. 6. Sample mold for specimen preparation.
( 1 ) PVC sample mold. ( 2 ) Wire centering yoke. ( 3 ) Stainless steel wire.
hole in the bottom was sealed with wax or gr-easc after thc wire had bcen rcmoved. Aftcr waxing the plastic terminal block to fix it in position, the samplc and assembly wcre placed in a constant temperature chamber for con- ditioning.
Sciiilple Conditioning
All three samples of each soil, after prepara- tion in thc molds, werc placed in thc constant temperature chamber and conditioned to a pre- selected temperaturc. The samples were insu- lated at both ends so that thermal conditioning would be attained by radial heat flow. The chamber temperature variation was within *0.03 C deg but the variation inside the speci- men was less because of the thermal lag caused by the mold wall.
Thermal conductivities were measured at three nominal temperatures, 5, -5, and -15
"C. It required 24 to 36 h to bring the samples
from room temperature to +5 "C, about 48 h
T I M E . M I N U T E S 0 . 1 3 0 . 1 2 0 . 1 1 0 . 1 0 0 . 0 9 0 . 0 8
F I G . 7. Temperature change, A T , In time rela- tionship. I I I I 1 1 1 1 1 1 - - 1. S O I L 1 . S A M P L E 1 J* - 2 . I N I T I A L T E M P E R A T U R E z - 1 5 ' C /.' - 4 w, = 6 . 1% 3 . yd = 1 0 3 . 5 L B . F T - ~ - 5. P O W E R I N P U T T O P R O B E a* - = 0 . 7 6 1 W A T T S . M E T R E - 1
*'
- d -from 5 to -5 "C, and a further 2 4 t o 36 h
from -5 to -15 "C. The longer period between 5 and -5 "C was due to the latent heat release during the freezing process.
Density and Moisture Content
The moisture content of each of the samples was determined during preparation by sampling the bagged soil in two or three different places. The wet density was determined from the vol- ume of soil in the mold and the weight of the wet sample after the thermal conductivity runs had been completed.
Results
Figure 7 presents the temperature increase measured at 30 s intervals, during a thermal conductivity run for sample 1, soil 1, at a tem-
perature of -15 "C. The S.E. of the slope,
*0.65%, is close to the average for all the
determinations. It should be emphasized that
the S.E. applies only to the slope of the line
through the time-temperature measurements. It does not indicate the overall accuracy with
which the thermal conductivity, k, has been de-
termined, which at present cannot be evaluated
for unsaturated soils. Of the 90 runs, six had
S.E. values in excess of 2 % ; the lowest S.E.
was 0.17%.
The conductivity results for all soils a r e given
PENNER E T AL.: THERMAL CONDUCTlVITY LABORATORY STUDIES m o o - a m - m m - o o o - m 0 0 o q o 0 o w w o ~ w ~ w o w w ~ o w
. .
w m m w m o w m o . a ; m G a ; m + a ; m 4 ~ ~ w ~ ~ w ~ ~ w - o - 0 ~ -G r - a ; \ d r - o ~ r - o o ~ - o w O N ~ O N ~ O- m m - m m - m m - ~ m - ~ m - ~ m N ~ - N O - N O - m o - m--- - - -
- -
- - - 3 - - W W N . . . o \ - m y o " ? d o m ~ m m w m &a;+ o o w - m m r n N W ~-
m r- o d w - m rn6r.i N V ~TABLE 3. (Concluded)
$
z
DU Wet S.E. of Temperature of soil ("C) rn
W. Current Power K slope ia
Saturation density density
(W/m) (W/m K) (%I Nominal Actual rn
Soil Sample ( ) (lb/ft3) (Ib/ft3) (%I (mA) -I
> 1 18.9 89.3 94.9 6.31 10 0.773 0.507 k 2 . 4 9 4.90 r
1
+ 5 2 39.8 94.3 105.4 11.84 10 0.717 0.849 k 7 . 4 6 4.90 -I 3 72.2 102.2 120.3 17.79 10 0.762 1.430 k 7 . 0 1 4.94 z rn 1 89.3 94.9 6.31 12 1.114 0.511 k 0 . 6 5 -6.38 9 2 94.3 105.4 11.84 12 1.033 0.982 k 0 . 9 8I
-6.40 -5E
> 3 102.2 120.3 17.79 15 1.714 1.591 +1.43 -6.29 r 1 89.3 94.9 6.31 12 1.113 0.498 t 0.28 - 14.72 0 -}
-15 0 2 94.3 105.4 11.84 12 1.033 1 ,075 - +0.92 - 14.78 Z 3 102.2 120.3 17.79 12 1 ,095 2.094 -+
1.70 -14 67 0 C 0 1 20.3 87.4 93.6 7.08 10 0.762 0.504 k 1 . 1 9 4.23 =! 2 38.2 91.2 102.3 12.21 10 0.744 0.683 k 1.40I
4.225
+.
3 53.1 93.1 108.2 16.23 10 0.717 0.818 + 1 85 4.24 -I .e 4 80.7 101.7 122.2 20.11 11 0.915 1 ,400 k 0 . 9 8 4.93 r 1 87.4 93.6 7.08 12 1.100 0.497 k 1 . 3 8 - 5.89 m > 10 2 91.2 102.3 12.21 10 0.774 0.743 + 1 . 1 9 -1
-5 -5.90 3 93.1 108.2 16.23 12 1.033 0.984 + 1 . 9 3 -5.81B
4 101.7 122.2 20.11 12 1.093 1.901 2 1 . 0 7 -4.70%
10 0 1 87.4 93.6 7.08 0.761 0.483 2 1 . 3 1 -25.87 ia 2 91.2 102.3 12.21 11.2 0.777 0.750 f 1.49 - 25 -25.40 < 3 93.1 108.2 16.23 10 0.717 1.196 k 2 . 7 41
-25.89 4 V) -15 4 101.7 122.2 20.11 12 1 .095 1.948+
1.06 -15.78 C u-
!2
282 CAN. GEOTECH. J. VOL. 12, 1975
.
-
-
-
-
- --
-*----.
X. 0. 8 Yd " 1 0 3 . 5 S A M P L E 1 a, . 6 . 1 8 4 0 - 4 - 8 - 1 2 - 1 6 - 2 0 - 2 4 - 2 8 T E M P E R A T U R E . C ,' ,, ,, y d - 9 7 . 8 S A M P L E-
--.
2 ._-Yn-.L4'-.---- y d . 8 6 . 61
z n 5 . 6 S R M P L E I 7 - - - - 0 - - - . ' 8 4 0 - 4 - 8 - 1 2 - 1 6 - 2 0 - 2 4 - 2 8 T E M P E R A T U R E , CFIG. 8. Temperature - thermal conductivity re- lationship for soil No. 1.
FIG. 9. Temperature - thermal conductivily re- lationship for soil No. 8.
tics. Power input, S.E. of the slope, and initial soil tcmperaturc are also listed.
The thermal conductivity of soil No. 1 at the various densities and moisture contents for the three nominal temperatures, 5, -5, and -15 OC, arc shown in Fig. 8. In general, the same pattern characterized most of the soils but therc were differences. Most of these differ- ences, however, appear to be consistent with
the probable effect of soil-water-ice inter-
actions on thermal conductivity.
Most soils (Nos. 1, 2, 5-8, and 10) showed a lower thermal conductivity in the frozen state at thc lowest moisture content. The reduction is believed to be due to the location of the ice within the soil matrix. Before freezing, water forms a bridge between soil particles due to surface tension and provides an effective path for heat conduction. During freezing, some of the bridge water is removed. The ice crystals are thought to partially fill the voids between
soil particles; the wide conductivity path be- tween particles is removed during the phase change.
At high moisture contents and densities (greater degree of saturation) the samples showed increased conductivities in the frozen state, probably because the ice now fills the pores more completely. As ice has a higher thermal conductivity than water this leads to
an overall increase in k.
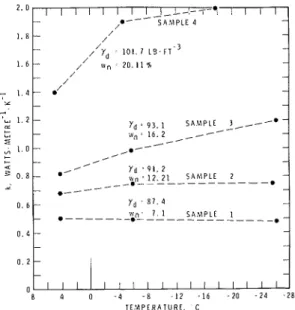
Soil No. 1 (Fig. 8 ) is a coarse-grained soil, 25% clay size, 33% silt size, 25% sand, and 1 7 % in the gravel size range. It would be ex- pected to have much less unfrozen water at below-zero temperatures than a soil, such as No. 8, with 54% clay size and 46% silt. Figure 9 gives the thermal conductivity values for all densities and moisture contents at the three temperatures of soil No. 8. Again, the decrease in conductivity is noted at the low moisture content, when the soil water is frozen. T h e im- portant difference between these two soils is that at thc higher moisture contents (samples 2 and 3 ) the conductivity increases as the tem- perature is lowered from -5 to -15 OC be- cause of the corresponding increase in the ice- water ratio. The samc applies to soil No. 10 whosc thermal conductivity values are shown in Fig. 10.
It should bc noted that it is not permissible
y d s 93. 1 S A M P L E 3 ,-'* i v , - 1 6 . 2
--
_ - - /-
-
,,.---
, , , ' 0 , Yd : 91. 2 w, - 1 2 . 2 1 S A M P L E 2 - 0 - - ----.
.---
y d 8 7 . 4 : ~ 1 1 , 1 1 , , 1 1 , , 1 1 1 1 1 1 ~ 0 8 4 0 - 4 - 8 - 1 2 - 1 6 - 2 0 - 2 4 - 2 8 T E M P E R A T U R E . CFIG. 10. Temperature - thermal conductivity re- lationship f o r soil No. 10.
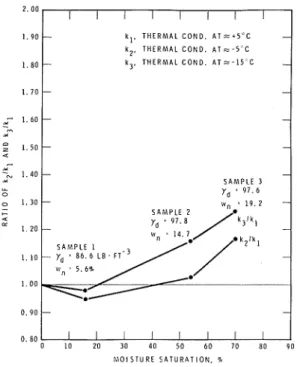
PENNER ET AL.: THERMAL CON[ IUCTIVITY LABORATORY STUDIES 283 - kl. T H E R M A L C O N D . A T = + 5 " C k 2 . T H E R M A L C O N D . A T = - 5 C - k 3 . T H E R M A L C O N D . A T = - 1 5 C S A M P L E 3 y, ' 9 7 . 6 w,
.
1 9 . 2 S A M P L E 2 S A M P L E 1 y, , 8 6 . 6 L B . F T - ~ wn ' 5 . 6 % 0 . 8 0 0 1 0 20 30 4 0 5 0 6 0 7 0 8 0 9 0 h i O l S T U R E S A T U R A T I O N . %FIG. I I . Ratio of k?/kl and k:,/kl as a function of saturation percentage for soil No. 8.
to interpolate values o f thermal conductivity between 5 and -5 "C because of the ice-water phase change at thc freczing point. The dashed lines in Figs. 8, 9, and 10, connecting the points, are drawn merely for the sake of clarity. Thermal conductivities of soil in the unfrozen state do not increase by more than about 0.17% per degree Centigrade as the temper- ature is lowered based on the conductivity of the soil solids. Interpolation is probably per- missible between -5 and -15 "C, but not necessarily in the straight-line fashion indicated in the graphs by the dashed lines. The increase of thermal conductivity in the frozen state for clay soil has been studied previously for the saturated state (Penner 1970).
The thermal conductivity change in unsat- urated soil after freezing is clearly shown in Fig. 11 for soil No. 8. The ratios plotted, k,/kl and k,/k,, where kl is the unfrozen thermal conductivity at 5 "C, k, at -5 "C, and k, at
- 15 "C, are less than 1 at the low saturation
level but increase to greater than 1 at the higher level of saturation. It may be noted also that the ratio k,/k1 is greater than k,/k, for all saturation levels. Although the relationships were not nearly as clear-cut for all soils, in general, the pattern was the same.
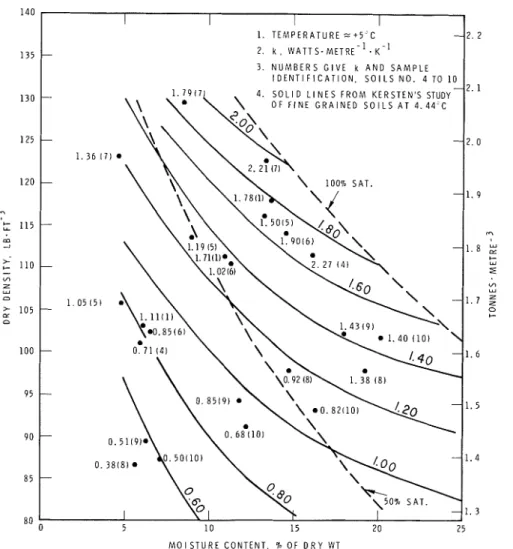
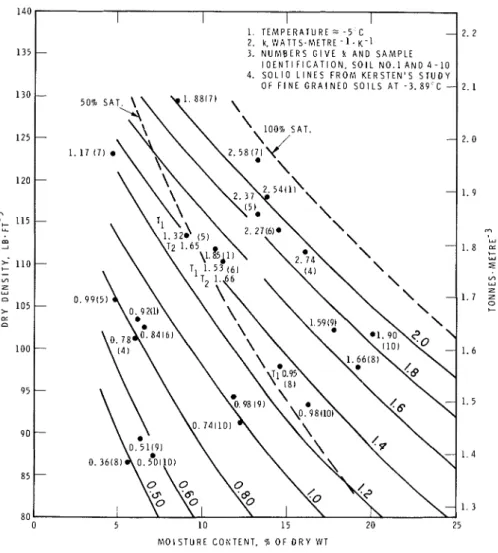
Some years ago, Kersten (1949) published graphs showing lines of constant thermal con- ductivity on a plot of moisture content and soil dry density. These graphs have been widely used in practice to obtain values of thermal conductivity for heat-flow studies in the field. Kersten stated that conductivities estimated from such graphs were reliable to within 22.5 %. Figures 12 and 13 show the values for the eight fine-grained soils of the Mackenzie High- way plotted on the appropriate Kersten graphs. Both the frozen and unfrozen conductivity values fall essentially within *25% of Kersten's values and in most cases the agreement is much better. It would appear, therefore, that although the absolute accuracy of Kersten's values (or of the present data) has not been established, there is a reasonable agreement between the two studies. Kersten's conductivity values were
determined at 40 O F (4.4 "C) and 2 5 O F
(-3.9 " C ) . The values from the present study used for the comparison were for approximately 5 "C and -5 "C.
Reproducibility of Sample Preparation and Thermal Conductivity
Time restrictions during the main part of the project did not permit adequate checks t o be made on the reproducibility of sample pre- paration and the thermal characteristics of the various probes used. Such a study was carried out using soils Nos. 1, 9, and 10 (Fig. 2 ) with the main emphasis on a comparison of the probes and the influence of the level of power input on the thermal conductivity determina- tion.
Equipment and sample preparation tech- niques were the same as those already de- scribed. A n improved signal preamplifier was used, however, when more precise temperature measurements were required for power inputs lower than those applied during the main study. The lowest heater power inputs used in the main study were in excess of 0.72 W/m; in the reproducibility experiments described here the lowest power inputs were as low as 0.374 W/m giving a temperature rise of 0.024 C deg in the usual 2 to 15 min interval. The results of the reproducibility experiments are given in
Tables 4, 5, and 6.
Moisture contents and wet and dry densities are included in each table. Little difficulty was
CAN. GEOTECH. J. VOL. 12, 1975 FIG. 12. (unfrozen) - Z. I 4. S O L I D L I N E S F R O M K E R S T E N ' S STUDY O F F I N E G R A I N E D S O I L S A T 4 . 4 4 - C - 2 . 0 - 1 . 9 - 1 . 8 2. k , W A T T S . M E T R E C ' . K - I 3. N U M B E R S G I V E k A N D S A M P L E I D E N T I F I C A T I O N . S O I L S N O . 4 TO 1 0 0 5 1 0 1 5 2 0 2 5 M O I S T U R E C O N T E N T . 70 O F D R Y WT _ .
Thermal conductivity, k, of unsaturated fine-grained Mackenzie Valley
encountered in obtaining similar densities with the same compactive effort. The largest density difference occurred in soil No. 10 (Table 4 ) for which the difference between the highest and lowest wet density was 0.55 lb/ft3 (0.009
g/cm". These differences, although usually
considered rather small, could not be statisti- cally assessed since only one sample was pre- pared for each probe for each particular soil.
Table 4 gives comparisons of thermal con- ductivity determined with two probes at the same power input and at temperatures of ap- proximately 5, -5, and -15 "C. The standard deviations of three repeats at 5 OC, five at -5 OC, and four at -15 OC are given for each average thermal conductivity value. Consider-
soils
ing all 12 conductivity runs for both probes, no statistical differences were found to exist at the 5 % probability level.
Table 5 gives conductivities determined at the same temperature but with different power inputs ranging from 0.374 to 1.496 W/m, a factor of four. There was no statistical dif- ference between readings at the 5 % probability level for these tests.
Table 6 gives the results of different power inputs at various temperatures; again, on the basis of paired comparisons at the 5 % prob- ability level, no significant differences could be detected between the probes for the tempera- tures involved.
PENNER ET AL.: THERMAL CONDUCTIVITY LABORATORY STUDIES
FIG. 13. Thermal conductivity, k, of unsaturated fine-grained Mackenzie Valley soils (frozen )
.
TABLE 4. Comparison of thermal conductivity measurements-soil No. 9 (No. of samples: 2, similarly prepared; soil temp.: differing; power input: constant; No. of probes: 2)
Approx. Thermal conductivity (W/m K)
probe
Starting temp. temp. No. of Power input Probe 6, Probe 7,
("c) rise ("C) runs (W/m) sample 1 sample 2
5.04 to 5.10 0.074 3 -4.63 to -4.68 0.055 5 -14.13 to -14.21 0.053 4 - Total 12 Moisture content (%)
Dry density, yd (Ib/ft3) Wet density, y, (Ib/ft3)
0.763-0.765 1.656k0.020 0.763-0.765 2.188+0.010 0.764-0.766 2.295k0.020
-
av. 2.046* 19.66 106.89 127.90 1.610k0.020 2.202+0.031 2.277k0.037-
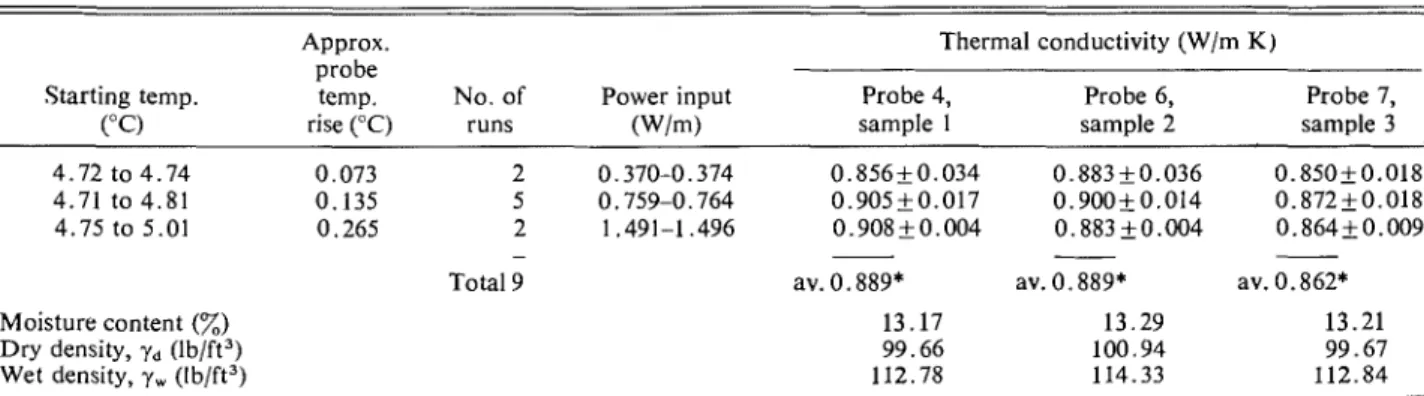
av. 2.030* 19.49 106.70 127.85TABLE 5. Comparison of thermal conductivity measurements-soil No. 10 (No. of samples: 3, similarly prepared; soil temp.: constant; power input: differing; No. of probes: 3)
Approx. Thermal conductivity (W/m K )
robe
Starting temp. temp. No. of Power input Probe 4, Probe 6, Probe 7,
PC) rise ("C) runs (W/m) sample 1 sample 2 sample 3
4.72 to 4.74 0.073 2 0.370-0.374 0.856+0.034 0.883+0.036 0.850+0.018 4.71 to 4.81 0.135 5 0.759-0.764 0.905&0.017 0.900+0.014 0.872+0.018 4.75 to 5.01 0.265 2 1.491-1.496 0.908&0.004 0.883_+0.004 0.8642Z0.009 - Total 9 Moisture content (%)
Dry density, yd (Ib/ft3) Wet density, y, (Ib/ft3)
-
-
-av. 0.889* av. 0.889* av. 0.862*
PENNER ET AL.: THERMAL CONDUCTIVITY LABORATORY STUDIES 287
TABLE 6. Comparison of thermal conductivity measurements-soil No. 1 (No. of samples: 2, similarly prepared; soil temp.: differing; power input: differing; No. of probes: 2)
--
A p p r o ~ . Thermal conductivity (W/m K) probe
Starting temp. temp. No. of Power input Probe 6, Probe 7,
("c) rise ("C) runs (W/m) sample 1 sample 2
5.03 to 5.07 0.030 5 0.374-0.375 2.010_+0.023 1.974k0.011 5.05 to 5.08 0.103 2 1.292-1.294 1.994k0.011 1.962?0.006 -4.72 t o -4.77 0.024 3 0.374-0.375 2.512k0.020 2.460_+0.006 -4.72 to -4.77 0.060 2 0.923-0.926 2.516+0.005 2.450k0.025 -4.77 to -4.78 0.086 3 1.293-1.295 2.379k0.030 2.430+0.040 - -- -
Total 15 av. 2.282* av. 2.255*
Moisture content (%) 16.31 16.37
Dry density, y, (Ib/ft3) 109.95 110.10
Wet density, y, (Ib/ft3) 127.88 128.10 * N o s t a t ~ s t ~ c a l difference a t the 5Z probability level could be f o u n d between averages o f probes 6 a n d 7 in samples 1 a n d 2 o f soil No. I.
with respect to sample preparation was good and that the probes could be interchanged without introducing unreasonable experimental errors. Differences resulting from the level of power input to the probe heater within the range studied did not significantly alter the
conductivity values at the 5 % level.
The thermal conductivities in the main study were determined at the lowest power input possible that would still result in reliable tem- perature readings. The results of the repro- ducibility trials indicated that the power level used did not introduce statistically significant errors.
Discussion
The agreement between the thermal conduc- tivity values determined by the probe method and those determined by Kersten with the
steady-state method is encouraging. The
authors believe that the reliability of thermal conductivity values available in the literature (mostly derived from Kersten's study) has been enhanced by the agreement shown.
Mass transfer associated with heat transfer remains a problem, for the unsaturated case, that cannot be readily evaluated under the laboratory test conditions described here or in the case of the steady-state method. Although heat transfer by conduction should be indepen- dent of temperature gradient, that associated with vapor transfer is greatly dependent on this gradient. The continually changing gradients that occur in nature are seldom the same as
those imposed in the measurement of thermal conductivity. Caution should be exercised, therefore, when using laboratory determined values for unsaturated soils under field condi- tions.
Sample uniformity, rather easily achieved in the laboratory, seldom occurs in nature. I n ice- rich permafrost even greater heterogeneity may exist because of nonuniform ice distribution.
The authors consider that comparisons of field
thermal conductivities with laboratory mea- sured values could be a useful study.
Conclusions
Since sample densities were fairly repro- ducible, it could be shown that the use of different probes did not introduce significant errors in the measured conductivities. Similarly, power input did not appear to be a critical
factor in the range from 0.370 to 1.490 W/m.
These studies, although covering only a fairly narrow range of soils, show that at low values of moisture contents, the thermal con- ductivity for seven of the soils was less in the frozen state than in the unfrozen state. This was reversed at higher moisture contents. The factors that determine the moisture content at which this 'change-over' occurs have not been established.
There are no unusual features about the thermal conductivity data determined in this study. The influence of moisture content and density of the soil and ice content were con- sistent with anticipated behavior.
288 CAN. GEOTECH. J . VOL. 12, 1975
Acknowledgments
The authors wish to express their gratitude for the assistance provided by members of the Geological Survey of Canada, Department of Energy, Mines and Resources in Ottawa, and the field staff of the Department of Public Works in obtaining soil samples. Mineral analyses of the clay-size fraction were carried out by the Materials Section of the Division of Building Research, for which appreciation is also expressed. The project was partially funded by the Environmental Working Group, an interdepartmental committee of the Federal Government, to cover some of the direct labora- tory expenses, travel costs to field sites for soil sampling, and freight charges for sample ship- ment.
This paper is a contribution from the Divi-
sion of Building Research, National Research Council of Canada, and is published with the approval of the Director of the Division.
D'EUSTACHIO, D., and SCHREINER, R. E. 1952. A study of a transient heat method for measuring thermal con- ductivity. Heat. Piping Air Cond. 24(6), pp. 113-117. HUTCHEON, W. L. 1958. Moistureflow induced by thermal
gradients within unsaturated soils. I n Water and its conduction in soils. Highw. Res. Board Spec. Rep. 40, pp. 113-133.
KERSTEN, M. S. 1949. Thermal properties of soils. Univer- sity of Minnesota, Eng. Exp. Stn. Bull. 28,227 p. P'LNNER, E. 1963. Anisotropic thermal conduction in clay
sediments. Proc. Int. Clay Conf., Stockholm, Vol. 1, pp. 365-376.
1970. Thermal conductivity of frozen soils. Can. J. Earth Sci. 7(3), pp. 982-987.
WOODSIDE, W. 1958. Probe for thermal conductivity measurement of dry and moist materials. Heat. Piping Air Cond. 30(9), pp. 163-170.