Cell Patterning Technology for Controlling the Stem Cell Microenvironment
by
Adam Rosenthal
B.S. Massachusetts Institute of Technology, 2001 M.Eng. Massachusetts Institute of Technology, 2002
Submitted to the Harvard-MIT Division of Health Sciences and Technology in partial fulfillment of the requirements for the degree of
Doctor of Philosophy at the
Massachusetts Institute of Technology June 2007
© 2007 Massachusetts Institute of Technology All rights reserved
Signature of Author ... v .--..-.. : ....- .-r... ... . ... Division of Health Sciences and Technology
A /1 . January 26t, 2007
Certified by ... . ... ... .. ... ... Joel Voldman Associate Profes f Electrical Engineering and Computer Science
/ Thesis Supervisor Certified by... .. r .. ,. B.t. .
B
L "Siangeeta Bhatia
Associate Professor of ~e cien es and Technology and
Elect:d n'Computer Science
Thesidsiir C ertified by... ... ... .t- - ...
George D y Associate Professor of Biological Chemistry and Molecular Pharmi ology
Harvard Medical School and Pediatrics Children's Hospital Boston Thesis Committee Member Accepted by ... ...
-If Martha L. Gray
Edward Hood Tanlin Professor nfM dical and Electrical Enrineering Director, Harvard-MIT Division of Health Sciences and Technology
ARCHIVES
MASSACHUSETTS INSTMA-OF TECHNOLOGY
MAR
2 1
2007
LIBRARIES
Cell Patterning Technology for Controlling the Stem Cell Microenvironment by
Adam Rosenthal
Submitted to the Harvard-MIT Division of Health Sciences and Technology
on January 2 6 th , 2007
in partial fulfillment of the requirements for the degree of Doctor of Philosophy in Electrical and Biomedical Engineering
Abstract
Embryonic stem cells serve as powerful models for the study of development and disease and hold enormous potential for future therapeutics. Yet, over two decades after mouse embryonic stem cells (mESCs) were first isolated, there is still little known about the role of cell-cell signaling in self-renewal. Since traditional cell-culture techniques do not provide significant control of the stem cell microenvironment, the goal of this thesis was to develop a cell patterning technology that allows us to precisely control stem cell
signaling and monitor cell proliferation over time.
In the first aim of this thesis, we describe the development of our first cell patterning technology using dielectrophoresis (DEP). DEP uses nonuniform electric fields to trap cells on or between electrodes. We first used beads as model particles to validate the strength of our DEP square trap, and then demonstrated efficient cell patterning with multiple cell types.
In the second aim of this thesis, we describe the development of a novel cell patterning technology that we created, called the Bio Flip Chip (BFC). The BFC is a microfabricated polymer chip, containing thousands of microwells, that enables cell patterning with single-cell resolution anywhere on a substrate and onto any substrate.
In the last aim of this thesis, we used our BFC technology to control the stem cell microenvironment, allowing us to incrementally and independently modulate cell-cell contact. We present the first quantitative evidence that cell-cell contact depresses mESC colony formation and show that E-cadherin signaling is responsible for this negative regulatory pathway.
Thesis Supervisor: Joel Voldman
Title: Associate Professor of Electrical Engineering and Computer Science Thesis Chair: Sangeeta Bhatia
Title: Associate Professor of Health Sciences and Technology and Electrical Engineering and Computer Science
Thesis Committee Member: George Daley
Title: Associate Professor of Biological Chemistry and Molecular Pharmacology at Harvard Medical School and Pediatrics Children's Hospital Boston
Acknowledgments
I would first like to thank Joel for being an incredible mentor throughout my PhD. While it was painful at times, Joel you always pushed me to perform at my highest potential. Through your example, you taught me how to communicate effectively and think critically, along with the true meaning of the words efficiency and multitasking. Thank you for accepting me as your first student and allowing me to participate in the lab-building process.
I would also like to thank all the Voldman babies. Thanks to Brian for being a great officemate. I will miss your eclectic choice in music, your adventures in dating, the Pika stories, the leg lamp, and your dirty sense of humor. Thanks to Lily for sharing the HST experience with me, for always being willing to chat about politics or career stuff, and for understanding my pain when we had to come in during the weekend to feed our hungry stem cells. Thanks to Mike for being so generous, with everyone in the lab, and for being a supermodel-er. Thanks to Salil for being the master of microscopy, for constantly feeding me new music, and for being a worthy movie critic. Thanks to Joseph for challenging my political viewpoints, sharing the Baker House experience with me, and for being a good cowboy. Thanks to Pat for his enthusiasm about stem cells and sharing his love of Thailand. Thanks to Nick for his hard work on the DEP Microwells, not DEPelles 0, and for bringing his physics perspective to the lab.
And thanks to the rest of the Voldman lab graduate alums: Nitzan, Katya, Nina, and Rikki, who have made the lab such a nice environment to work. I would also like to specially thank my UROPs, who have helped me enormously throughout the years: Maia for your help on the DEP trapping, Alice for being vital to the development of the BFC and for teaching me how to play Sudoku, and Steph for helping to carry the torch into the future of the BFC technology. And to the people in the MTL, thank you for transforming me from a young kid who knew nothing about fab into an old man who knows a little more about fab. Special thanks to Kurt for sharing all your knowledge and for making my long hours in the fab entertaining.
And lastly, and most importantly, I'd like to thank my family. My Mom for her spirituality, my Dad for his infectious curiosity, Paulette for her caring and generosity, Renuka for her for wisdom, and Brinda for her love.
Table of Contents
Chapter 1: Introduction... 10
1.1 Mouse Embryonic Stem Cell Self-Renewal ... 10
1.2 Cell-Cell Signaling in mESC Self-Renewal ... 11
1.3 C ell Patterning ... ... 12
1.4 D ielectrophoresis ... ... 13
1.4.1 DEP Trap Requirements ... 14
1.4.2 Modeling DEP Trap Behavior ... 16
1.4.3 Modeling Software Overview... 17
1.4.4 The D EP Force... ... 19
1.4.5 The Other Forces... 20
1.5 Microwells and the Bio Flip Chip... ... ... 21
1.6 Scope of the Thesis ... 24
Chapter 2 : DEP Bead Trapping ... 25
2.1 The nDEP Square Trap ... 25
2. 1.1 nDEP Square Trap Design ... 25
2.1.2 nDEP Square Trap Operation ... 26
2.2 Materials and Methods... 27
2.2.1 Beads and Bead Stock Solutions... 27
2.2.2 Electrode Traps ... 27
2.2.3 Flow Chamber, Packaging, and Fluidics ... ... 29
2.2.4 Optics and Measuring Chamber Height... ... 30
2.2.5 Determining Peak Holding Diameter... ... ... 31
2.2.6 Electrical Excitation...31 2.2.7 Bead Experiments ... 31 2.2.8 Modeling Parameters ... 31 2 .3 R esu lts... 32 2.3.1 Bead Experiments ... 33 2.3.2 Size-Selectivity Behavior... 34
2.3.3 Multiple- and Single-Bead Trapping ... ... 35
2.3.4 Design Rules ... 36
2.4 D iscussion ... 38
Chapter 3 : DEP Cell Trapping... 40
3.1 Materials and Methods... 40
3.1.1 C ell C ulture... ... 40
3.1.2 C ell Solution ... ... 40
3.1.3 Cell Trapping Electrodes ... 40
3.1.4 Flow Chamber, Packaging, and Fluidics ... ... 41
3.1.5 O ptics ... 4 1 3.1.6 Electrical Excitation...41
3.1.7 Resistor-On-Chip Experiments and Modeling... ... 42
3.1.8 Cell Health Modeling... 42
3.1.9 Initial Cell Trapping Experiments ... ... 43
3.1.11 Cell Loading Experiments and Modeling ... ... 44
3.2 R esults... 44
3.2.1 Resistor-on-Chip Experiments... ... ... 44
3.2.2 Cell Health Modeling... 45
3.2.3 Initial Cell Trapping Experiments ... ... 46
3.2.4 The DEP Microwell ... 47
3.2.5 Cell Loading Experiments ... 48
3.3 D iscussion ... ... 49
3.3.1 Future Improvements for the DEP Microwells... ... 49
3.3.2 Cell Proliferation and Movement in the DEP Microwells ... 50
3.3.3 Challenges Using DEP for Cell Patterning... ... 51
Chapter 4 : The Bio Flip Chip... 53
4.1 Materials and Methods... 53
4.1.1 Fabrication of the Bio Flip Chip ... 53
4.1.2 Bio Flip Chip Operation... 53
4.1.3 Preparation of the Substrates ... 55
4.1.4 Calculating Cell Patterning Efficiency and Precision... 55
4.1.5 C ell C ulture... ... 56
4.2 R esults... 56
4.2.1 Initial Challenges with BFC Patterning ... ... 56
4.2.2 Large-Scale and Precise Cell Patterning... ... 58
4.2.3 Cell Patterning onto Any Substrate... 59
4.2.4 Multi-Day Cell Tracking: Proliferation and Migration ... 59
4.2.5 Modulating the Cell Seeding Density ... 60
4.3 D iscussion ... 6 1 Chapter 5 : Using the BFC to Control mESC Signaling... ... 63
5.1 Materials and Methods... 63
5.1.1 Controlling Starting Cell Number... .... ... 63
5.1.2 C ell C ulture ... ... ... . 64
5.1.3 mESC Pluripotency Staining ... 64
5.1.4 Testing the Effects of Anti-E-Cadherin Antibody ... . 64
5.2 R esults... 65
5.2.1 Precise Control of the Stem Cell Microenvironment... ... 65
5.2.2 Removing the Effects of Cell-Cell Contact ... ... . 65
5.2.3 Molecular Determinants of Cell Contact-Mediated Depression... 66
5.2.4 mESC Pluripotency in the BFC ... ... 67
5.3 D iscussion ... 68 5.3.1 Diffusible Signaling ... 68 5.3.2 Contact-Mediated Signaling ... 71 5.3.3 Signaling Pathways ... 74 Chapter 6 : Conclusions ... 78 6.1 Thesis Contributions ... 78
6.2 Ongoing Collaborations with the BFC ... ... 78
6.3 Future Applications of the BFC ... ... ... 80
Appendix A: Modeling Software Functionality ... ... 84
Modeling Parameters ... 84
M ultipolar DEP Force Effects ... 85
Trap Size-Selectivity... 87
Chamber Height Effects... ... 89
Comparing Various DEP Trap Geometries ... ... 91
Table of Figures
Figure 1-1: Intracellular and extracellular factors involved in mESC self-renewal ... 11
Figure 1-2: The two kinds of DEP trapping... ... ... 13
Figure 1-3: Comparison of substrate modification techniques and DEP... 14
Figure 1-4: mESCs exposed to pDEP media for different times ... 15
Figure 1-5: DEP trap requirements ... 16
Figure 1-6: Overview of the modeling software... ... 17
Figure 1-7: Particle stream lines ... 18
Figure 1-8: Microwells can be made from a variety of materials... 22
Figure 1-9: Fabrication and operation of microwells ... ... 22
Figure 1-10: Using microwells for monitoring cell behavior ... 23
Figure 1-11: Flipping cells in microwells to recover their cell-secreted products ... 24
Figure 2-1: nDEP square trap design ... 26
Figure 2-2: nDEP square trap operation. ... ... 27
Figure 2-3: nDEP square trap fabrication ... ... 28
Figure 2-4: Overview of the DEP trap and trap array ... 29
Figure 2-5: Overview of the flow chamber, packaging, and fluidics. ... 30
Figure 2-6: Electric-field magnitude inside a DEP trap... ... 32
Figure 2-7: Experimental and simulated results for 5 different diameter beads ... 33
Figure 2-8: Size-selectivity behavior... 35
Figure 2-9: Size-selectivity behavior due to changing inner square side length ... 37
Figure 2-10: Size-selectivity behavior due to changing spacing between electrodes... 38
Figure 3-1: Resistor-on-chip (ROC) devices ... ... 42
Figure 3-2: DEP microwell operation... ... 44
Figure 3-3: RO C experim ents ... ... 45
Figure 3-4: Cell health modeling ... 46
Figure 3-5: Our nDEP square trap. ... ... ... 47
Figure 3-6: Cell loading experiments and modeling... ... 49
Figure 3-7: Cells sticking to the substrate in the areas outside the IDE arrays ... 50
Figure 3-8: Cell proliferation and movement in the DEP Microwells... 51
Figure 3-9: Cell-cell sticking in large DEP arrays... ... 51
Figure 4-1: BFC device and operation... 55
Figure 4-2: Using the BFC without a spacer gasket causes cells to die ... 57
Figure 4-3: Cells proliferating in the BFC environment ... 57
Figure 4-4: Cells sticking in the microwells ... ... 58
Figure 4-5: Large-scale and precise cell patterning ... ... 58
Figure 4-6: Patterning onto any substrate ... ... 59
Figure 4-7: Multi-day cell tracking... 60
Figure 4-8: Modulating the cell seeding density... ... 61
Figure 5-1: Controlling starting cell number ... ... 64
Figure 5-2: Precise control of the mESC microenvironment... ... 65
Figure 5-3: Removing the effects of cell-cell contact... ... 66
Figure 5-4: Investigating the effects of anti-E-cadherin antibody ... 67
Figure 5-6: Cell seeding density effects on mESC pluripotency ... 68
Figure 6-1: hESC colony formation after BFC patterning... ... 79
Figure 6-2: BFC patterning of lung cancer cells... ... 80
Figure 6-3: BFC patterning of hESCs to control colony formation... 81
Figure 6-4: BFC patterning for studying differentiation... ... 81
Figure 6-5: BFC patterning for chemotaxis assays or cell migration studies ... 82
Figure 6-6: BFC to be used for a novel cloning technology... ... 82
Figure 6-7: SEM images of the plastic posts. ... ... 83
Figure A-i: The three simulated trap geometries ... ... 85
Figure A-2: Trapping behavior for the three DEP traps. ... 87
Figure A-3: pDEP size-selectivity scaling analysis ... .... 89
Chapter 1: Introduction
In this thesis, we describe the development of two cell patterning technologies. The first uses dielectrophoresis (DEP) to trap and position cells. The second is a cell patterning technology that we created, called the Bio Flip Chip (BFC). Using the BFC, we then
answer an important biological question - how do the seeding conditions of mouse
embryonic stem cells (mESCs) affect their proliferation? More specifically, why do mESCs need to be seeded as single cells?
In this chapter, we will first describe the factors affecting mESC self-renewal and further discuss the role of cell-cell signaling in this process. Then, in order to answer the above biological questions, we describe the types of experiments that are required, thus motivating the need for new types of cell patterning tools. We will then discuss our two cell patterning technologies and conclude with an outline of the rest of the thesis.
1.1 Mouse Embryonic Stem Cell Self-Renewal
Embryonic stem cells (ESCs) serve as powerful models for the study of development and disease and hold enormous potential for future therapeutics. Stem cells can generally be manipulated in culture in two ways. The first is to drive them to differentiate to a specific phenotype - such as cardiomyocytes', hematopoietic cells2, hepatocytes3, pancreatic
islets4, neurons5'6, etc. The second is expand ESCs thru self-renewal, allowing
proliferation and maintaining pluripotency so that they can form derivatives of all three embryonic germ layers .
While ESCs have been isolated from a number of organisms, the most useful applications have come from studying mouse and human ESCs. However, mouse embryonic stem cell (mESC) biology is more mature, primarily because mESCs were isolated almost two decades before human embryonic stem cells (hESCs) were first derived in 19987. mESC self-renewal is thought to involve both intracellular and extracellular factors (Figure 1-1). Intracellularly, Oct4 and Nanog are thought to be the two most important transcription factors. Both factors are required in order to maintain self-renewal, although the level of Oct4 expression must be tightly controlled8'9,10
Extracellularly, there have been a number of signals that are necessary for self-renewal. It was discovered that mESCs remain undifferentiated when grown in the presence of Leukemia Inhibitory Factor (LIF) and serum". LIF binds to its receptor
(LIFR), complexes with gpl30 , and activates the STAT3 pathway. While there is
evidence to suggest STAT3 activation alone is sufficient for self-renewal' 3-15, these
analyses where done in serum or at relatively high cell densities, and thus serum or autocrine diffusible signaling could have been involved in affecting self-renewal'0.
Recently, other important extracellular mediators of self-renewal have been identified. Researchers have shown that culturing with LIF and Bone Morphogenetic Protein (BMP) can cause mESCs to self-renew in the absence of serum, by inducing the Id family of genes via the Smad pathway' 6. The Id proteins block lineage-specific transcription
factors, enabling the self-renewal response to LIF/STAT3. The Wnt family of proteins also seems to be important in self-renewal, as researchers have been able to cause mESCs to self-renew by using a small-molecule inhibitor of glycogen synthase kinase-3 (GSK-3), facilitating efficient Wnt pathway activation .
Extracellularly, there is another important component of mESC self-renewal, cell-cell signaling - consisting of diffusible signaling and cell-cell contact (e.g., juxtacrine
signaling). The contribution of cell-cell signaling in mESC self-renewal is described in detail in the next section.
Figure 1-1: Intracellular and extracellular factors involved in mESC self-renewal. Extracellularly, the
effects of cell-cell signaling - including diffusible signaling and cell-cell contact
-also contribute to self-renewal.
1.2 Cell-Cell Signaling in mESC Self-Renewal
Cell-cell signaling can be modulated in vitro in several ways, using molecular inhibitors 17" 9 or genetic approaches8'9,14, but both are limited to manipulating single or
known molecules. Alternatively, one can manipulate the general class of cell-cell interactions by modulating the cells' relative positions, which has generally been accomplished by modulating the cell seeding density.
Several examples have demonstrated that cell seeding density affects stem cell behavior. Central nervous system stem cells differentiate into neurons, astrocytes, and oligodendrocytes when plated at high density, but generate smooth muscle at low density20
. Rat mesenchymal stem cells have been shown to expand more rapidly and formed more single-cell-derived colonies as the cell seeding density was decreased21,
while rat osteogenic cells expanded more rapidly as the cell seeding density was increased22.
In serum without LIF, ESCs differentiate less as the cell seeding density is increased'9
, supporting the belief that ESCs secrete autocrine diffusible factors that maintain self-renewal . However, these cells were seeded at densities up to 25,000 cells/cm2
, allowing cells to combine, confounding their results with effects from cell-cell contact.
There are several possible candidates for the diffusible factors involved in self-renewal. Even without LIF supplementation of the medium, some cells stay undifferentiated, consistent with the fact that ESCs are known to secrete LIF 9,23, which
has shown to be activated upon early differentiation24
secretion is further supported by the fact that the addition of anti-LIF antibody to media
without LIF increases differentiation'9 and LIF-deficient clones exhibited more
differentiation than normal ESCs23. However, the fact that ESC self-renewal is not
completely abolished in these two cases suggests that soluble factors other than LIF might prevent ESC differentiation and that they are synthesized by both wild type and LIF-deficient cells. This factor has been given the name ES cell renewal factor (ESRF)23.
Although ESRF is present in conditioned medium, it has not been identified using
standard protein purification and COS cell expression cloning strategies'0. Another
candidate for autocrine factors involved in self-renewal is BMP. ESCs have the receptors for BMP and may have the potential for autocrine stimulation via BMP production6.
Furthermore, some suggest there may also be ESC secretion of a differentiation-inducing
19
agent .
Unfortunately, even less is known about the effects of cell-cell contact on mESC self-renewal. Convention has dictated that mESCs should be seeded as single
cells8,9,13,16,25,26 - anyone propagating mESCs follows these protocols and is certain to triturate down to single cells during cell seeding. However, these strict recommendations are based on qualitative observations that seeding mESCs as clusters decreases self-renewal. Of the studies that have quantitatively investigated this phenomena, they showed that seeding mESCs as clusters of thousands of cells can cause differentiation2
Therefore, most of the research exploring the importance of the cell seeding conditions on self-renewal (e.g., whether or not cell-cell contact has an effect) only investigated mESC behavior at both extremes of cell seeding conditions, as single cells or clusters of thousands of cells. However, there have been no reports quantitatively studying the effects of seeding smaller cell clusters, such as a few cells, allowing incremental changes in cell-cell contact. Traditional cell-culture techniques cannot reliably seed small groups of cells in a scalable fashion, with or without cell contact. To do this, we require cell patterning.
1.3 Cell Patterning
Cell patterning - the ability to place cells in a desired location - has become an increasingly important tool for control of the cellular microenvironment. Cell patterning can be used to manipulate cell-cell interactions, varying the contact area between two cell types in co-culture2
. Cell patterning can also be used to direct cell-matrix interactions, controlling the amount of contact area with the extracellular matrix (ECM)29 or the type
of ECM that the cell sits on30. Techniques have even been developed to extend these planar interactions into a three-dimensional cellular matrix 3 . Cell patterning also has the
potential to improve devices like cell-based biosensors - using living cells as sensing elements for applications like toxin detection32 and defense monitoring33. Cells have
successfully been interfaced to sensing elements to form cell-based biosensors and recent advances in cell patterning may enable reproducible and manufacturable biosensor devices34
Several techniques exist for patterning cells. Some techniques use physical barriers to place cells, such as elastomeric stencils35'36 or microwells ,38. The substrate
that the cells sit on can also be modified to selectively pattern cells. Microcontact printing uses a PDMS stamp to pattern matrix proteins onto a substrate29'39while electroactive
substrates use an applied voltage to switch the surface properties of a substrate, both allowing cells to selectively attach in specific areas4
0,4 1.Electromagnetic forces can also
be used to pattern cells. Electrophoresis utilizes the negative charges of cell-membrane proteins to exert forces on cells in a constant (DC) electric field, creating patterned cellular arrays42. Optical tweezers use optical frequency non-uniform electromagnetic fields to manipulate cells43,44, while dielectrophoresis (DEP) uses non-uniform AC
electric fields in the range of 10 kHz-100 MHz to position cells on or between
electrodes45,46
When choosing a cell patterning technology, there are several capabilities to consider: patterning cells with single-cell resolution, patterning large numbers of cells, allowing the patterned cells room to grow and move, being gentle on the cells, and being easy to use. To answer our questions about the seeding conditions of mESCs, we need to be able to create patterns of single (or small numbers of) cells onto a variety of substrates and monitor their proliferation over time. Therefore, first we need a technique that can pattern with single-cell resolution. Second, since mESCs divide rapidly (with a doubling time of -14 hoursl9), we also need to be able to pattern cells onto an unconfined area, allowing the patterned cells room to proliferate. ptCP, for instance, restricts motility and proliferation by chemically patterning the substrate, leading researchers to develop switchable substrates that in turn require chemical synthesis41 or uncommon materials40 (e.g., ultrapure gold). Third, to ensure meaningful results, we need to perform our experiments with significant numbers of cells, so we require a cell patterning technique that is scalable. Lastly, since mESCs are so sensitive to their microenvironment, we need a technology that is gentle on the cells. Both of our chosen cell patterning technologies, DEP and the Bio Flip Chip, can be operated to meet these requirements.
1.4 Dielectrophoresis
Dielectrophoretic (DEP) traps use the interaction of an induced multipole with a nonuniform electric field to create forces that will stably position particles .DEP traps can use either positive dielectrophoresis (pDEP) - pulling cells toward the electrodes
(Figure 1-2A) - or negative dielectrophoresis (nDEP) - pushing cells away from the
electrodes (Figure 1-2B). DEP forces can be used to trap a variety of particles -including micron and submicron polymer beads48'49, cells50-52, viruses53,54, and bacteria55'56.
B3 i P~~+ + induced -dipole * electric field I # t d I
Figure 1-2: The two kinds of DEP traps: (A) pDEP trapping, where the cells are pulled towards the electrodes and (B) nDEP trapping, where the cells are pushed away from the electrodes.
DEP fulfills many of our requirements in a cell patterning technique. Since DEP traps consist of scalable electrode arrays, they can be designed to pattern thousands of
I i -11·. I
cells on a single glass slide and be made small enough to ensure single-cell resolution57. In addition, DEP can be used to place cells without the need for patterning the substrate58, thus giving the cells room to proliferate52'58. This ability to simultaneously pattern single
cells and allow them room to proliferate is not possible using many other scalable, cell patterning techniques (Figure 1-3). Lastly, the effects of DEP on cell health can be quantitatively modeled, allowing DEP trap operation that minimizes damage to the cells while still maximizing trap performance.
Wash
Time to
divide
single-cell resolution
room for proliferation
single-cell resolution room for proliferation
Figure 1-3: Comparison of substrate modification techniques and DEP. DEP can pattern with single-cell resolution and allow room for cells to proliferate, while substrate modification techniques cannot simultaneously enable both of these capabilities.
1.4.1 DEP Trap Requirements
Prior single-cell DEP traps include nDEP octopole 59, nDEP cages6 0, nDEP posts61, pDEP
circles58, and a pDEP points-and-lid geometry52,57. Previous single-cell DEP traps designed for cell patterning all use pDEP, which require the cells to be immersed in an artificial low-conductivity media5 2'57,58. Although these pDEP traps only need to use this
low-conductivity media while trapping, which can be accomplished within minutes, overnight exposure to this media caused cells to detach more frequently and proliferate more slowly than controls"7. mESCs were even more sensitive and showed decreased proliferation after only thirty minutes of exposure to this low-conductivity media (Figure 1-4). nDEP traps, however, allow the use of normal cell-culture media. Therefore, in order to avoid any negative interactions with the pDEP media, we chose to restrict ourselves to the use of nDEP to pattern mESCs.
sma ECM islan,
Iarg,
ECM islan
Figure 1-4: Effects of conductivity media exposure on proliferation. mESCs were exposed to
low-conductivity media (21% of 50% w/v sucrose solution in 18.2-Mf)-cm deionized water, 1% ES-qualified fetal bovine serum (Invitrogen, 16141-079), 78% 18.2-MO-cm deionized water) for 30-90 min and then transferred to normal mESC media and grown for five days. At day 5, cell numbers were counted using a Coulter counter (Beckman Coulter, Z2), measured three times for each of three separate wells. The 5-day cell expansion was calculated by dividing the number of cells on day 5 by the starting cell number, showing that the pDEP media significantly affects mESC proliferation even for exposures as short as 30 min. Bars on experimental data indicate I standard deviation from the mean.
In addition to using nDEP, we require a trap that has multidirectional stability (in
x, y, and z), allowing the particle to remain stably held in the trap. And while some DEP
traps can operate without using flow52,58,62-65, most scalable, single-cell DEP traps require
this wash step to remove untrapped cells. Therefore, the DEP traps need to be strong enough to hold particles against this fluid flow. Stability in the plane of the electrodes (x and y) had been achieved with previous single-cell nDEP traps by surrounding the
trapped particles with electrodes, usually in a quadrupole geometry5 9 6 1,66,67. This creates
a stabilizing force that pushes the particle back into the center of the trap, awa from the
electrodes (Figure 1-5A). However, these planar quadrupole geometries 66 have an
upward DEP force everywhere in the trap (Figure 1-5B) and are not stable in the z-direction. Once a certain voltage is reached, the upward DEP force exceeds the gravitational force, causing the particles to be levitated into higher velocity flows and washed away. This causes the maximum flow rate, the highest flow rate where a particle is stably held in the trap, to decrease with increasing voltage67
One can add trap stability in the z-direction by building the trap in three dimensions, either by using electrodes on a top and bottom substrate, forming an octopole59,68 (Figure 1-5C), or by extruding the actual electrodes into posts61 (Figure 1-5D). However, the octopole trap positions cells in the center of the chamber, away from the bottom substrate, making it less appropriate for cell patterning. In addition, if the top and bottom quadrupoles are not precisely aligned, trap performance is compromised, making packaging difficult. The DEP posts, on the other hand, are difficult to fabricate and would not allow unobstructed cell proliferation. Overall, we need a strong, planar, single-cell nDEP trap. These requirements necessitate a quantitative modeling tool capable of designing a trap to meet these increased demands.
C
6
.0 ,
'D3
a)
2 2 M w n ----o 2~ -T i0 min 30 min 60 min 90 min
I
---f~l
Upward
DEP force
A B C D
Figure 1-5: DEP trap requirements. (A) The planar quadrupole has stability in the x and y direction, but (B)
does not have stability in the z-direction, since the DEP force is upward everywhere in the trap. To provide the planar quadrupole with stability in the z-direction, the trap can be made 3-D, into either (C) an octopole trap68 or (D) extruded quadrupole posts61
1.4.2 Modeling DEP Trap Behavior
For a variety of reasons, much of the DEP-based trap design to date has been qualitative in nature. Most current microscale DEP traps are meant to capture many particles at once. The electrostatic interactions between the many particles in such a trap make the trapping behavior very difficult to quantitatively analyze. Additionally, traps for large particles, such as cells, are relatively simple to design and fabricate - many electrode configurations and experimental conditions will generate some kind of trapping, and thus detailed analysis may not be necessary. However, the maturation of DEP-based microsystems necessitates a quantitative modeling tool that enables trap designs that can meet these increased demands.
Before the creation of our modeling software, several groups had performed quantitative analysis of DEP-based microsystems. Pioneering work in validating the shape of the force fields was first reported by the German group for quadrupole6 and octopole DEP traps59. DEP forces have also been quantified using gravity as a counterforce, by measuring particle levitation over quadrupoles66,69 or interdigitated electrodes6 5'07. Several other groups have analyzed the balance of DEP forces and hydrodynamic drag. Watarai et al. measured the migration velocity of a particle traveling through a quadrupole trap 7 . Similar experiments where later done by the German group measuring the particle displacement in an octopole trap against flow72 and the critical flow velocity needed to break through paired electrodes on the top and bottom of the flow chamber73 - both correlating modeling predictions to experiments. Hughes et al. quantified the DEP force by using quadrupole traps to confine motile bacteria 4. From the DEP trapping force, they calculated the bacterial swimming velocity and found good agreement compared to published values. While all of these quantitative analyses have worked well for their specific applications, they investigate only limited aspects of DEP trapping behavior - such as particle levitation, velocity, or displacement within a DEP trap. Therefore, we created a novel modeling software, described below, that could perform comprehensive analysis of DEP trapping and allow us to create the types of highly-functional DEP traps that we require.
The software was originally created by Joel Voldman in his PhD thesis75, which he validated with both beads6 1'67 and cells76, allowing him to create the extruded
quadrupole electrodes, the strongest-known 3-D, nDEP trap61. Since then, we have made
further improvements to the modeling software, increasing its performance and ease-of-use, described below in Section 1.4.3:Modeling Software Overview.
Furthermore, since the initial creation of our modeling software, other groups have started to comprehensively model DEP trapping for other applications. Li et al. used a 2-D model, very similar to ours, to create a microfluidic DEP filter for yeast, spores, and bacteria48.
1.4.3 Modeling Software Overview
We wrote the software using Matlab (The Mathworks, R14) to take advantage of the diverse numerical and visualization algorithms available within. The modeling software, though general, was written expressly for analyzing the problem of DEP trapping of single particles against fluid flows. An overview of the software is given in Figure 1-6. The software takes electric-field data and other experimental parameters and computes each of the five forces on the particle - the multi-order DEP force (Eq. 1-3), the hydrodynamic drag force (Eq. 1-6 and 1-7), the gravitational force (Equation 1-8), the hydrodynamic lift force (Equation 1-9), and the normal force from the top and bottom substrates.
YES NO
The particle will The particle will be be trapped under released under these conditions these conditions
Figure 1-6: Overview of the modeling software, showing the major steps. From user-provided electric field data and other experimental parameters, the forces on the particle (DEP, HD drag, gravitational, HD lift, and normal) are computed everywhere in space. The total force on the particle is used to generate streamlines that determine if the particle is stably held in the trap.
The DEP force can be in the x, y, and z directions, depending on the trap geometry. The HD drag force is applied in the +x direction in our microsystem. The gravitational force pushes down on the particle in the -z direction, since the particles are more dense
than the surrounding media. The HD lift force is caused by low-Reynolds-number viscous flow over an object near a solid plane, which tries to levitate the particle in the +z
direction 77 78.Our final force is the normal force in the -z and +z direction, respectively defined by the top and bottom of the flow chamber.
After each force is individually calculated, the total force in all directions (x, y, and
z) is summed on a uniformly spaced grid. Streamlines are then generated from these total force calculations, mapping its trajectory from a specified starting position, allowing us to determine whether the particle is stably held in the trap. If the particle is held at that flow rate, the program continues to step up the flow rate to determine the maximum flow rate
- the highest flow rate where the particle is still stably held in the trap. Any increase in flow above this rate will knock the particle out of the trap, producing streamlines highlighting this removal (Figure 1-7).
In calculating the maximum flow rate, we can easily vary certain parameters in the microsystem to determine their effects on the trapping behavior. Such parameters may include the applied voltage, the applied signal frequency, the particle diameter, the flow chamber geometries, and a number of other variables. In its current form, the program allows for the simultaneous variation of two parameters at once, so that for instance, sweeps in voltage and frequency can be performed, thus enabling the user to rapidly test a large range of experimental conditions simultaneously.
B I17PI~-(CT\~y I" I %7".Ai.2I "W flow z, _ Y• i _
Figure 1-7: Particle streamlines. (A) The cell is stably held in the DEP trap. (B) The flow exceeds the
maximum flow rate and the cell is pushed out of the trap. The color bar on the bottom substrate shows the electric field intensity in a given DEP trap.
Since its initial creation, we have improved the modeling software, using streamlines to make the program more efficient and visually-interactive. Originally, the software calculated the particle's stable points by using Matlab's isosurface function, finding the surface for each component of total force (Fx, Fy, Fz) where that force is zero75. Then, by determining if the three-way intersections of these points are stable, the software determined if the particle was held in the trap for a given set of experimental conditions. The use of streamlines obviates the need for these isosurfaces, since the streamlines generate the particle's trajectory directly from the total forces, automatically determining if a stable point exists. Brian Taff first explored using streamlines to investigate DEP trapping behavior. Then, to make the improved version of the software, we incorporated the streamline function into the automated software, replacing the
isosurface subprogram to solve for the maximum flow rate. Currently, everyone in the
Voldman Lab now uses this improved version to do their DEP modeling and trap design.
In addition, we used this improved version to create our nDEP square traps, the strongest-known planar, nDEP trap (see Section 2.1.1: nDEP Square Trap Design) and demonstrated its functionality by comparing this trap to two other common traps in the literature79 (see Appendix A). We have made this latest version of the software freely available to the scientific community at: www.rle.mit.edu/biomicro.
1.4.4 The DEP Force
The dielectrophoretic force in its simplest implementation is the interaction of a nonuniform electric field with the dipole moment it induces in an object. The typical case is the induced dipole in a lossy dielectric spherical particle. The force in this case, where the particle is much smaller than the electric field nonuniformities, is given by:
F = 2;r7R 3 Re[CM(o). -VE2 (r,) (1-1)
where F refers to the dipole approximation to the DEP force, em is the permittivity of the medium surrounding the sphere, R is the radius of the particle, o is the radian frequency of the applied field, r refers to the spatial coordinate, and E is the complex applied electric field. CM is the Clausius-Mossotti (CM) factor, which, for a lossy dielectric uniform sphere, such as a bead, is given by:
CM =
-2
1 (1-2)£2 + 2e1
where E, and 62 are the complex permittivities of the medium and the particle, respectively, and are each given by e = e + a /(jco), where e is the permittivity of the medium or particle, aois the conductivity of the medium or particle, andj is r-1 . If the
CM factor is positive, then the DEP force pulls particles toward the electric-field maxima
(positive DEP, or pDEP). If the CM factor is negative, the DEP force pushes the particles towards the electric-field minima (negative DEP, or nDEP).
Most previous analyses incorporate only the dipole approximation to the DEP force51'5 7 which does not account for higher-order components, where the field is
sufficiently spatially nonuniform (in comparison to the size of the particle) to induce significant quadrupole and higher-order moments in the object. Analyses including higher-order multipoles have shown that these terms often make significant contributions to the total DEP force4 8
,79,80 (see Appendix A: Multipolar DEP Force Effects). In the mid-nineties, Washizu and Jones8183 developed a computationally accessible approach to calculating higher-order DEP forces. A compact tensor formulation of their result8' is:
where n refers to the force order (n=1 is the dipole, n=2 is the quadrupole, etc.), p(") is the multipolar induced-moment tensor, and []" and (V)" represent n dot products and gradient operations. Thus, we see that the n-th force order is given by the interaction of the n-th-order multipolar moment with the n-th gradient of the electric field. This expression can be rewritten more explicitly for the time-averaged force in the i-th direction as:
F )>
=
27,R
3Re CM( E'E E
(2) CR' Re CM(2) E EE (1-4)
3 &Xm axnaXM
for the dipole (n=l) and quadropole (n=2) force orders81. The Einstein summation
convention has been applied in Eq. 1-4. The multipolar CM factor for a uniform lossy dielectric sphere, such as a bead, is given by:
CM"_ = _2 -E (1-5)
ne2 + (n + 1)E1
while the CM factor for cells, viruses, and bacteria is calculated using expressions from the literature84
1.4.5 The Other Forces
In our modeling software we include four other forces - the hydrodynamic (HD) drag force, the HD lift force, the gravitational force, and the normal force from the rigid substrate top and bottom boundaries.
The HD drag force imposed on a stationary particle by a moving fluid is governed by low-Reynolds-number flow because of the small dimensions and low flow rates involved in these microsystems. When the particle sits close to the substrate, we are justified in using a shear flow approximation. The HD drag force is then similar to
Stokes' drag on a sphere, with a correction for the effects of the wall85:
Fdrg = 6q1RjfF*drg z = 6ru R (6Q/wh2 ) F *d,g z (1-6)
where p is the viscosity of the liquid, F*drag is a nondimensional factor incorporating the wall effects, z is the distance from the particle center to the substrate, and
f
is the shear rate at the wall in a parallel plate flow chamber, where Q is the flow rate, w is the chamber width, and h is the chamber height . Li et al. showed that this shear flow approximation is valid even when the particle diameter occupies a significant fraction of the chamber height48.When the particle is not near the substrate, we use a parabolic Poiseuille flow profile. The HD drag force is then 7:
Fdrag = 6;rpRVeF(z) = 6zpR (1.5Q/wh) F(z) (1-7)
where Vc is the centerline velocity in the flow chamber and F(z) is a nondimensional factor incorporating the height of the particle in the chamber. Other analytical or non-analytical flow profiles can also be implemented.
The magnitude of the gravitational force is given by:
F = 3 4v 47rR'(pp -pm)g (1-8)
where p, and pp refer to the densities of the medium and the particle, respectively, and g is the gravitational acceleration constant.
The HD lift force is caused by low-Reynolds-number viscous flow over an object near a solid plane, which tries to levitate the particle. For a stationary sphere in contact with the plane, the lift force becomes77'78:
Fl, = 9.22 2p mR4 = 9.22(36Q2 /w2h4 ) PmR4 (1-9)
At lower flow rates, the lift force is negligible compared to the z-directed DEP force and gravity. However, since the lift is proportional to Q2 and R4 , the lift force could become
significant for higher flow rates and larger bead diameters.
Our final force is the implementation of a normal force produced by the top and bottom substrates. We implement this force using an algorithm that automatically adjusts the z-directed total force on the particle so that it is zero when the particle contacts the top or bottom surface. For example, when a particle contacts the bottom surface, the particle center will be located at z = R. Without this algorithm, if the total z-directed total is less
than zero for z < R, then the particle would get pushed downward, which is physically impossible because the normal force of the bottom substrate would push back. Therefore, if the total directed force is less than 0 for z < R, this algorithm modifies the total z-directed force to equal zero, removing any downward force and keeping the particle sitting on the bottom substrate at z = R.
1.5 Microwells and the Bio Flip Chip
In addition to using DEP, we looked into other methods of cell patterning that could pattern large numbers of cells, with single-cell resolution, were easy to use, and gentle on the cells. Microwells have started becoming widely-used in the last few years as a cell patterning technique and offer all of these capabilities. The microwells can be made from a variety of materials - including polystyrene88, polyethylene glycol (PEG)3 7'89, and most
B
Figure 1-8: Microwells can be made from a variety of materials - including (A) polystyrene88, (B)
polyethylene glycol (PEG)37, and (C) polydimethylsiloxane (PDMS).
Microwells are generally made using soft lithography, using a transparency mask to photopattern the microwell array, either directly into the desired material37, or into a photoresist that will later be used as an inverse mold for the final microwell array. Using the latter process, molding requires only initial fabrication of the master wafer. Afterward, whenever a new chip needs to be made, the desired material is simply poured onto the master wafer, cured, and then peeled off (Figure 1-9A). The master wafer can be reused numerous times, making the overall chip creation fast and inexpensive (e.g., a microwell chip made from PDMS costs less than fifteen cents to make).
The operation of the microwells is also very easy. A single-cell solution is deposited onto the microwell array. The cells settle into the microwells, generally after a few minutes. Then, the remaining cells are washed away, while the cells in the microwells are protected from the high shear flows and remain trapped (Figure 1-9B). While microwells can be used for non-adherent cells88, patterning adherent cells requires coating the bottom of the microwells with an adherent protein - such as collagen37 or fibronectin89,90
Iiirrp
'I
mm----
II
A B
Figure 1-9: Fabrication and operation of microwells38. (A) Polymer is poured over the master wafer,
molding the microwell array. (B) A single-cell solution is poured over the microwell, allowing the cells to settle in the wells, while the other cells are washed away.
To date, most microwell research has simply demonstrated patterning cells in microwells - with variations on the microwell material, the proteins inside and outside the microwell, or the microwell dimensions - although some groups are beginning to use them for enabling applications. Yamamura et al. patterned single B-cells in microwell
CA C1 (__J (,_J LJ U (_-*
(_j 1'. j (A (i Li (_j I Ji
C, j (A CA Lj Ij
tJ 1-4) c, j ( j ( j LJ
CA j t"J (J t-I u L-I
B
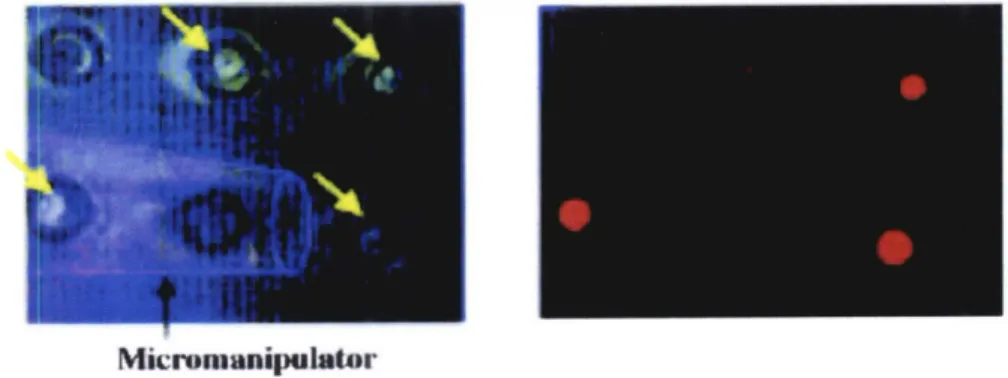
arrays, monitoring which cells were activated after stimulation with antigen, then retrieved the activated cells using a micromanipulator88(Figure 1-10).
Micromanipulator
Figure 1-10: Using microwells for monitoring cell behavior, with subsequent retrieval of desired cells
using a micromanipulator8 8.
In our case, to answer how seeding conditions affect stem cell proliferation, we need to be able to pattern small numbers of cells, with and without cell contact, and monitor their proliferation over time. The use of microwells in its current state only enables short-term assays (usually < 24 hours), before the cells start to proliferate and require additional space. In addition, while microwells can pattern small clusters of cells inside a microwell (allowing cell-cell contact), they do not offer precise enough patterning resolution to pattern single cells close together (but without cell-cell contact). Therefore, to combine the benefits of the microwell mentioned above, while still enabling increased patterning resolution and room for cell proliferation, we created a new cell patterning tool called the Bio Flip Chip (BFC). Essentially, it traps the cells exactly like other microwell applications, depositing a single-cell solution onto an array of PDMS microwells and washing away the cells outside the microwells. However, the BFC then takes an additional step that enables some powerful capabilities. By flipping the microwell array upside down onto another substrate, the cells fall out onto an unconfined
area. While still retaining the same pattern as when they were in the microwells, the cells now have room to proliferate and move. In addition, having the flexibility to pattern cells onto any substrate allows us to seed mESCS on their standard in vitro substrate of tissue-culture polystyrene (TCPS). We describe the development and use of the BFC in detail in Chapter 4.
During the time we were working on the BFC, Love et al. used microwells in a similar fashion for another elegant application9 1 (Figure 1-11). By trapping single cells in microwells, they also flipped the microwell chip upside down, onto a glass slide. But, instead of patterning cells, they patterned the cells' secreted products on the glass slide. Those products were then recovered and identified, while the cells were still retained in their original microwells, allowing subsequent recovery of desired cells for clonal expansion. This technology has already been successfully used for fast antibody screening and efficient isolation of monoclonal hybridomas.
&0.W lPm a
tS
~u~9
W100 •Pm7
Figure 1-11: Flipping cells in microwells to recover their cell-secreted products91.
1.6 Scope of the Thesis
The primary goal of the thesis is to develop a cell patterning technology that allows precise control of the stem cell environment, allowing us to modulate cell-cell signaling and monitor cell proliferation over time.
In Chapter 2, we describe the initial design and development of our DEP cell patterning technology, using beads as model particles. In Chapter 3, we describe the challenges associated with transitioning from beads to cells, along with creation of our second generation DEP trap, designed for use with cells. In Chapter 4, we describe the design and development of a new cell patterning technology, the Bio Flip Chip (BFC), and demonstrate the numerous capabilities this technology has to offer. In Chapter 5, we use the BFC to control the mouse embryonic stem cell (mESC) microenvironment to answer the question - why do mESCs need to be seeded as single cells? We finish in Chapter 6 with remarks on the significance of the thesis, ongoing collaborations to extend the BFC applications, and directions for future work.
Chapter 2: DEP Bead Trapping
Now that we have presented an overview of our cell patterning technologies - DEP traps
and the Bio Flip Chip - we will further describe the functionality of each technique. In this chapter, we present a novel nDEP trap geometry that is strong and capable of single-cell trapping45. We demonstrated the trap strength by measuring the maximum flow rate that test particles could withstand while remaining trapped, and matched this to our predictive model with excellent agreement. In addition, the model provided us with a clear understanding of how our traps work and allowed us to create a set of design rules describing how the trap behavior changes as a function of the trap geometry.
2.1 The nDEP Square Trap 2.1.1 nDEP Square Trap Design
In the Introduction, we motivated the requirements of patterning mESCs and determined that the trap needed to be a planar, single-cell nDEP trap that had multidirectional stability and was strong enough to hold cells against substantial fluid flows. To create a trap with x- and y-directed stability, we decided to use a similar principle as the quadrupole electrodes and closely surround the particle with stabilizing electrodes. However, since the quadrupole geometry lacks z-directed stability, we decided to try a variation of this geometry and combine the four separate electrodes into a single surrounding electrode (Figure 2-1A). To minimize the loading of multiple particles, we made the surrounding electrode just bigger than the size of the desired cell. Furthermore, since cells are spherical, we first tried a circular electrode geometry. However, the circular geometry was not optimally strong because the curving electrode splits up the DEP force into x and y components, providing less force to counteract the x-directed flow (Figure 2-1B).
Therefore, in order to hold against higher velocity flows, we decided to remove the curvature, thus maximizing the x-directed DEP force. This provides us with two possible geometries for the simplest surrounding electrode, a rectangle and a square. Rectangular geometries did have an increased trap strength due to this higher x-directed DEP force, but also had an increased probability of trapping more than one particle in the trap (Figure 2-iC). Therefore, to maximize trap strength and the probability of single-cell trapping, we chose a square electrode geometry for our nDEP trap (Figure 2-1D).
However, we still needed an opposite polarity electrode to create the electric field, and in order to maximize trap strength, we wanted it close to the square electrode. We chose a simple line electrode, placed 10 ýtm away from the square electrode (Figure 2-1E). This was a large enough distance to allow us to still use a transparency mask for processing, allowing lower fabrication costs, while still being close enough to produce a
strong DEP trap.
Finally, returning to the requirement for z-directed stability. It turns out that this square and line electrode trap creates a unique electric field geometry, producing the required downward DEP force inside the trap, thus providing stability in the z-direction (Figure 2-1F). We describe this unique geometry of the force fields in detail in Section 2.3.2: Size-Selectivity Behavior.
B
C
yIID
E i
HowD
E
F
y Flow xFigure 2-1: nDEP square trap design. (A) Instead of using a quadrupole geometry, we chose to surround the trapped particle with a single electrode. (B) The circular electrode geometry splits the DEP force into x and y components, providing less force to counteract the x-directed flow. (C) The rectangle electrode increased the probability of trapping more than one particle. (D) The square geometry provided a higher DEP force to counteract the x-directed flow. (E) We made the opposite polarity electrode a line electrode, spaced 10 gLm away from the square electrode edge. (F) This nDEP square trap has a downward DEP force within the square electrode, thus providing stability in the z-direction.
2.1.2 nDEP Square Trap Operation
The operating scheme for our single-particle traps consists of three steps. First, with the flow on and the traps off, we initially flood the patterning space with a high density solution of particles (Figure 2-2A). Because of the z-directed DEP forces outside the trap (Figure 2-1F), particles are only able to be trapped if they initially reside within the inner square electrode. Therefore, we initially flood the patterning space with an excess of particles, increasing the probability that at least one particle will be located within the trap. The flooding time is small because the particles can be flowed in at very high speeds, being limited by the maximum pressures the flow chamber can withstand. The flooding time will then be a function of the maximum flow rate and the combined chamber and tubing volume. The smaller this combined volume, the less time it takes for flooding.
Once the patterning space is covered with particles, with enough particles filling the square traps, we turn off the flow and then turn the traps on (Figure 2-2B). The time needed for trapping is negligible, usually within seconds. The particles in the trap are forced into the electric field minimum, which without flow, is in the center of the square electrode. The particles outside of the square electrodes also align with the minimum electric field, which is located in between the traps in the array (Figure 2-2B).
Third, with the traps on, we turn the flow on, washing away the untrapped particles and leaving only single particles within each trap (Figure 2-2C). This wash step
is usually the rate-limiting step in patterning particles since the flow rate cannot exceed the maximum flow rate of the trapped particle. Therefore, we require a strong trap that allows high enough flow rates for practical experimental times. The wash time is also dependent on the combined chamber and tubing volume, so minimizing this volume will help to reduce wash times. Once the particles are washed away, leaving only particles within the traps, the flow and the traps can be turned off.
B C
Flood: inject Load: turn off flow Clear: Flow away
particles into chamber and turn traps on untrapped particles
Figure 2-2: nDEP square trap operation. (A) Flood the patterning space with a high-density solution of particles. (B) Turn off the flow and turn on the DEP traps. (C) Turn on the flow and clear away the untrapped particles.
2.2 Materials and Methods
2.2.1 Beads and Bead Stock Solutions
We used polystyrene beads, with density of 1.062 g/cm3, at five different bead diameters. The 4.2- and 8.2-ptm diameter beads (Polysciences), with standard deviation of 0.33 and 0.17 p.m respectively, were packaged as 1% solids in water. We made these bead solutions by using a 2.0-mL aliquot of the beads, washed in 1.0 mL of stock solution, and resuspended in 1.0 mL of stock solution.
The polystyrene beads (incorporating 2% divinyl benzene) with diameters of 9.7, 14.2, and 19.5 ptm (Bangs Laboratories) with standard deviations of 0.10, 0.72, and 0.31 pm respectively, were packaged as 10% solids in water. We made these bead solutions by using a 0.5-mL aliquot of these beads, washed in 0.5 mL of stock solution, and resuspended in 1.0 mL of stock solution.
Bead stock solutions were made with conductivity of 0.01 S/m by combining appropriate volumes of 18.2-MO-cm deionized water and Dulbecco's PBS (Gibco), both containing 0.1% Triton X-100 (Sigma). Conductivities were measured using a conductivity meter (Thermo Orion, 555A).
2.2.2 Electrode Traps
We fabricated the DEP traps by patterning gold onto glass slides. We cleaned standard microscope slides of 38 x 75 mm in a Piranha solution (3:1 H2SO4:H202) for 10 min,
blow dried them with N2, and then dehydrated them in a 225 °C oven for 30 min (Figure
2-3A). We coated the slides with Hexamethyldisiloxane (HMDS oven, recipe #4) and then coated them with image-reversal photoresist (Hoechst, AZ-5214), dispensed at 500 rpm for 6 s, spread at 750 rpm for 6s, and ramped to 3000 rpm for 30s (Figure 2-3B). After spinning, we baked the slides in an oven at 95 'C for 30 min. Afterward, we
exposed the slides to a UV dose of 390 mJ/cm2 on a contact aligner (Karl Suss, MA6 Mask Aligner) using a dark-field mask printed at 40,640 dpi (Fine Line Imaging). We placed the slides on a 125 TC hotplate for 10 min. We then flooded the slides with a 1200
mJ/cm2 on the same contact aligner (Figure 2-3C) and developed them for 2.5 min
(AZ422-MIF developer). We then deposited them with metal, 250 A of titanium and
2500 A of gold (Figure 2-3D). Lastly, liftoff was performed by developing the slides in acetone for 30 min (Figure 2-3E).
la r
Piranha glass slide -coat with image expose pattern and dehydrate reversal photoresist
D E
Ti/Au deposition liftoff
Figure 2-3: nDEP square trap fabrication. (A) We cleaned the slides in a Piranha solution and dehydrated them at 225 *C. (B) Then we coated them with image reversal photoresist (Hoechst AZ-5214). (C) Next we exposed the pattern using a transparency mask. (D) Then we deposited the Ti and Au. (E) Lastly, we performed liftoff using acetone.
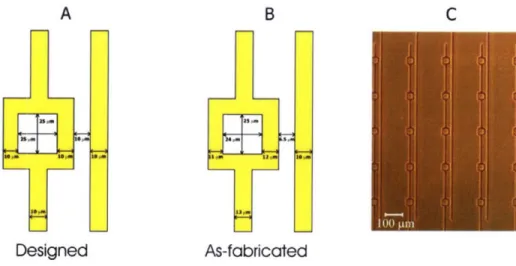
The traps were designed as one square electrode with inner square side length (ISSL) of 25 .tm and another line electrode spaced 10 ýpm away. All electrode widths were 10 ýpm (Figure 2-4A). The as-fabricated trap dimensions differed from the designed dimensions submitted to the transparency mask manufacturer (Figure 2-4B). This is because our minimum feature size of 10 ptm is also the minimum allowed by the mask manufacturer, and the variance at this feature size is 3.2 ptm. In addition, variations in photolithography exposure times significantly changed the trap dimensions and our exposure times were chosen to yield as-fabricated dimensions that were closest to the designed dimensions. However, this discrepancy in designed and as-fabricated trap dimensions did not significantly affect the trapping behavior. For example, using a 5 Vp applied voltage to trap a 12-ptm-diameter bead, the maximum flow rate was 43 ýpL/min using the designed trap geometry and 44 pUL/min using the as-fabricated geometry, a difference of only 2%.
The DEP traps were designed in a 5x5 square array, with a trap-to-trap distance of 200 p.m (Figure 2-4C). The minimum feature size of the traps is > 10 p.m, which allows the use of inexpensive transparency masks for photolithography (CAD Art Services).
... ·; .. ·