Publisher’s version / Version de l'éditeur:
ASHRAE Transactions, 99, 2, pp. 133-143, 1993
READ THESE TERMS AND CONDITIONS CAREFULLY BEFORE USING THIS WEBSITE.
https://nrc-publications.canada.ca/eng/copyright
Vous avez des questions? Nous pouvons vous aider. Pour communiquer directement avec un auteur, consultez la
première page de la revue dans laquelle son article a été publié afin de trouver ses coordonnées. Si vous n’arrivez pas à les repérer, communiquez avec nous à [email protected].
Questions? Contact the NRC Publications Archive team at
[email protected]. If you wish to email the authors directly, please see the first page of the publication for their contact information.
NRC Publications Archive
Archives des publications du CNRC
This publication could be one of several versions: author’s original, accepted manuscript or the publisher’s version. / La version de cette publication peut être l’une des suivantes : la version prépublication de l’auteur, la version acceptée du manuscrit ou la version de l’éditeur.
Access and use of this website and the material on it are subject to the Terms and Conditions set forth at
Effect of air diffuser layout on the ventilation conditions of a
workstation - Part II : Air change efficiency and ventilation efficiency
Shaw, C. Y.; Zhang, J. S.; Said, M. N.; Vaculik, F.; Magee, R. J.
https://publications-cnrc.canada.ca/fra/droits
L’accès à ce site Web et l’utilisation de son contenu sont assujettis aux conditions présentées dans le site LISEZ CES CONDITIONS ATTENTIVEMENT AVANT D’UTILISER CE SITE WEB.
NRC Publications Record / Notice d'Archives des publications de CNRC:
https://nrc-publications.canada.ca/eng/view/object/?id=349d7294-617f-40b3-903c-a18af43f6a95 https://publications-cnrc.canada.ca/fra/voir/objet/?id=349d7294-617f-40b3-903c-a18af43f6a95National Research Conseil national
1+1
Council Canada de recherches CanadaInstitute for lnstitut de Research in recherche en Construction construction
Effect on Air Diffuser Layout on
the Ventilation Conditions of
a
Workstation
-
Part
11:
Air Change Efficiency
and Ventilation Efficiency
I
by C.Y. Shaw, J.S. Zhang, M.N.A. Said. F. Vaculik and R.J. Magee
Reprinted from:
ASHRAE Transactions 1992
Volume 99(2) p. 133-1 43
(IRC Paper No. 1962)
NRCC 34928
I R C p a p e r--
B e v C r e i ghtutl ANAL.Y SECISTI/ICIST NRC/CNRC
IRC Ser
Rec e i ved 1:ln: 04-28-94IRC
paperI
EFFECT OF AIR DIFFUSER LAYOUT ON
T H E VENTILATION CONDITIONS OF
A WORKSTATION-PART
II:
AIR CHANGE
EFFICIENCY AND VENTILATION EFFICIENCY
I
C.Y.
Shaw,Ph.D.,
P.E.
J.S.Zhang, Ph.D.
M.N. Said,Ph.D.,
P.E.Member ASHRA E Associate Member ASHRAE
F. Vaculik, P.E. Member ASHRAE
R.J.
Magee
ABSTRACT ventilated space. The ventilation efficiency (or contaminant removal effectiveness) is defined as the ratio between the Tests were conducted in an enclosed roomfitted with a steady-state concentration of contamination at the exhaust mock-up worbtation to determine the eflect of air d r m e r duct and the steady state mean concentration of the room types and layouts on the ventilation condition of the work- (Skaret and Sandberg 1985; AIVC 1991). The air distribu- station. Seven dlrerent layouts including two types of air tion pattern (Shaw et al. 1991) is a measure of how quickly d ~ m e r s were tested. For each air d i m e r layout, tracer the supply air from the supply air registers reaches various gas tests were conducted to measure air distribution locations in a room. It also shows how uniformly the supply patterns, air change eflciency, and ventilation eflciency air is distributed within the room, an indication of how within the workstation, the surrounding area, and in the efficiently a heating, ventilating, air-conditioning (HVAC) return air duct. Additional tests were also conducted to system distributes the supply air.
investigate the effect of gap heights at the base of worksta- Tests were conducted in one of two interconnected tion panitions and the supply air rate on the air distribution ventilation test rooms to measure air distribution patterns, pattern within the workstation and its surrounding area. m e air change efficiency, and ventilation efficiency within and results are presented in two papers. Part I presents the around a mock-up workstation for seven different layouts oi
results of air distribution patterns and the effects of gap supply air registers and return air grilles. The results aIi; heights at the base of workstation partitions md airfow presented in two papers. The first paper (Shaw et al. 199;) rates on these patterns. Part 11, this paper, presents the reports the air distribution measurements. The results results of air change eflcietrcy and ventilation eficiency. indicate that all seven diffuser layouts distributed the supply air within the workstation and in the surrounding area INTRODUCTION equally well. The presence of a workstation had no signifi- cant effect on the air distribution patterns. No evidence was For office buildings with open-floor layouts, some found to indicate that one diffuser layout was better than workstations may be overventilated and others may be another. The results also indicate that the effect of gap inadequately ventilated, even though the total ventilation heights at the base of workstation partitions on the air (outdoor air supply) rate is adequate. This is because the distributionpatterns was minimal. The time required by the designer seldom knows the workstation layout when supply air to mix with the air inside the workstation designing the ventilation system. Also, workstation layouts increased as the supply airflow rate decreased.
may be changed as the use of the space changes. This paper presents the results of air change efficiency " Several parameters have been proposed for assessing and ventilation efficiency measurements.
the performance of a ventilation system. They include air
change efficiency, ventilation efficiency, and air change rate TEST SETUP together with air distribution pattern (Skaret and Sandberg
1985; AIVC 1990, 1991; Anderson 1988; Shaw et al. Figure 1 shows the test rooms. The dimensions of each 1991). The air change efficiency (or air exchange efficien- room are 4.9 m by 4.8 rn by 2.9 m high (16 ft by 15.7 ft
cy) is a measure of how quickly the air in a space is by 9.4 ft). Each room is equipped with an independent replaced. European researchers (Skaret and Sandberg 1985) HVAC system. Dampers and orifice pIates have been define the air change efficiency as the ratio between the installed in the supply, return, outdoor air supply, and nominal time constant and the air exchange time for a exhaust ducts to control and measure the airflows though C.Y. Shaw is a senior researcher, J.S. Zhang is a research associate, M.Nady A. Said is a research officer and Robert J. Magee is a technical officer at the Institute for Research in Construction, the National Research Council of Canada and Frantisek Vaculik is a manager in Building Performance, Public Works Canada, Ottawa, Ontario.
Rgun
1 Test set-up.these ducts. As shown in Figure 1, the rooms are equipped with two basic designs of supply air outlets and return air inlets: recessed air-light fixtures (slot diffuses, 1.2 m [4 ft] long) and square ceiling diffusers. The air-light fixtures are fixed, but the square dii3iws can be moved from one location to another. Using combinations of these diffusers, seven layouts of supply air inlets and return air outlets were tested.
A 2.9 m by 2.6 m (9.7
fi
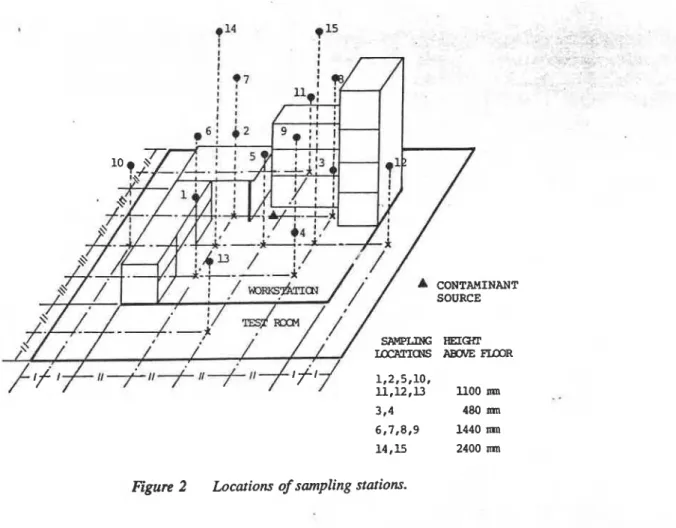
by 8.6 ft) mock-up worksta- tion was placed inside the test room (Figure 1). The height of the partition was 1.9 m (6.3 ft). The furniture, as shown, included a desk, a 60-W d&k lamp, a chair, a table, a bookcase, a computer, and a file cabinet. In addition, two light bulbs, one 60-W and one 10-W, were placed on the chair to simulate the sensible heat of an office worker.Tracer gas sampling stations were installed at a total of 15 locations within the test room, including 9 locations within the workstation, and 4 locations around and 2 locations above the workstation. The supply, return, and outdoor air supply ducts were also sampled. In addition, sampling tubes were installed in the areas surrounding the test room. The workstation was divided into eight volumet- rically equal regions with a sampling station installed in each region. As shown in Figure 2, sampling stations 1, 2, and 5 were at the breathing height of a seated adult and the others were at the center of each region (sampling stations 6, 7, 8, and 9 were approximately at the nose height of a standing adult). Sampling stations 10, 11, 12, and 13 were placed at the breathing height of a seated adult outside the workstation near the center of the space between the partition and the wall of the test room, and sampling stations 14 and 15 were placed above the workstation.
Each sampling station consisted of three sampling
tubes. Of the three tubes, one could be used to inject tracer gas into the room; the second one was
used
to collect the tracer gas sample at that location. The third tubes from locations 1 through 9 were connected to a manifold toproduce an "average' sample for the workstation; those
from 10 through 15 were manifolded to produce an "aver- age" sample for the area outside the workstation. Two automated sampling systems, each with a 16-port multiposi- tion sampling valve, were used for collecting tracer gas samples: one for collecting individual samples from the 15 locations inside the test room (one port was used to sample the outdoor air) and the- other for collecting samples from the manifolds, the W A C system, and the locations outside the test room.
MEASUREMENT METHODS .
The methods used to measure air change efficiency and ventilation efficiency are described below.
Test 1, Air Change Efficiency
For measuring the air change efficiency, a small amount of SF6 (14
d)
was injected through eight injection tubes into the test room at sampling locations 1, 2, 3, 4, 10, 11, 12, and 13. Four small (box) fans were used to assist in mixing the tracer gas with the room air. About five minutes after tracer gas injection, the mixing fans were turned off and tracer gas samples, both individual and manifold, were taken (at four-minute intervals for about three hours) at all sampling locations. The results obtainedt 1 5
A CONTAMINANT
SmPLING HEIQrr
rmmIm
ABCNEFIMRl l , l 2 , U
lloo
nmfigure 2 Locations of sampling stations.
were used to calculate (1) the local mean age of air at each of the 9 locations within the workstation (Skaret and Sandberg 1985; NTWS019 1983), (2) the local mean age of air at each'of the 6 locations around the workstation, and (3) the local mean age of air in the return air duct. In addition, the room mean age of air for the workstation was calculated (1) based on the concentrations measured at the manifold using the Nordtest method and (2) by calculating the average value of the local mean ages of air of the 9 locations inside the workstation. Also, the mean age of air for the test room was calculated (1) based on the concentra- tions measured in the return air duct (NTWSOl9 1983) and (2) by calculating the average value of the local mean ages of air at the 16 locations. The air change efficiency was evaluated from the equations
where
n = nominal time constant, the volume of the test room divided by the outdoor air supply rate, and
< I >
= room mean age of air, the average value ofthe local mean ages of air for all points in a
room (the local mean age of air is the average time i t takes for air to travel from the supply air register to any point in a room).
The subscripts nn and ws indicate room and workstation, respectively.
Test
2,
Ventilation Efficiency (Skaret and Sandberg 1985)For measuring ventilation efficiency, 11 1 d i m i n of
CH4 was injected continuously into the workstation (the
injection rate was reduced to 90 d l m i n after Case 03 to achieve a more appropriate peak concentration). The injection point was located on the floor near the comer of the worktable and the bookcase to simulate a point source. Tracer gas samples were taken (at four-minute intervals for about four hours) at the two manifolds (one for the work- station and the other for the space around the workstation) and in the supply air and the return air ducts. The ventila- tion efficiency was calculated from the equation
E = Cr,(o0>
-
c s<
Cws(0o)>-
Cs (3) where,cra<00) = steady-state concentration at the exhaust air duct,
<
C,,(oo)>
.= steady-state mean concentration of the workstation, andc~
= steady-state concentration at the supply.RESULTS AND DISCUSSION
Experiments were conducted to measure the air change efficiency and ventilation efficiency of a workstation with different supply air diffuser layouts. As mentioned in "Test Setup," tracer gas samples were taken at 9 locations in the workstation and six locations in the surrounding area. In
addition, the samples from the workstation were fed to a manifold to produce an "averaged" sample, as were the samples from the surrounding area. The results are dis- cussed below in terms of air, change efficiency, room mean age of air, and ventilation efficiency.
Types and Layouts of Supply Air Diffusers (Cases 00 through Case 071
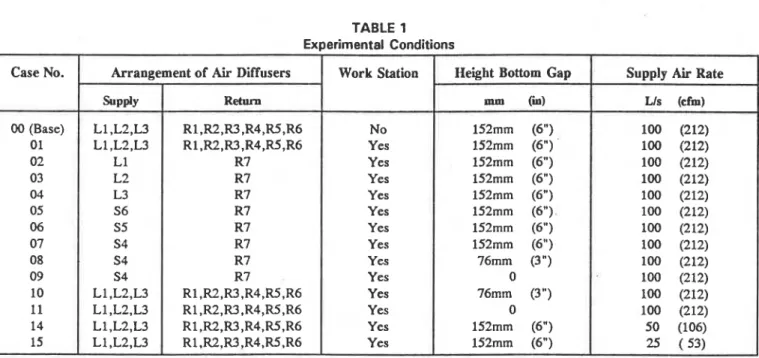
Tests were conducted on seven supply air diffuser layouts including either air-light fixtures (slot diffusers) or square ceiling diffusers (Figure lb). Details are given in Table 1. One of them, Case 00, which had three air-light fixtures for supply and six fixtures for return but no workstation (i.e., an empty room), was used as the base case for comparison. For this series of tests, the gap height at the base of the workstation partitions was 152 mm (6 in.). The supply air temperature was set at 23OC (73°F) and the supply airflow rate was controlled at 100 L/s (212 cfm), including 20 L/s (42.4 cfm) outdoor air. The airflow rates at the outdoor air supply, main supply air, return air, and exhaust air ducts were monitored continuously during the test.
Air Change Efficiencj Table 2 lists the average values of the air change efficiency for the workstation, the surrounding area, and the room as a whole. Table 3 gives the air change efficiencies and the local mean ages of air for each of the 15 sampling locations. Also included in Table 2 are the air change efficiency and the local mean age of air values for the return air duct (see also Figure 3). For the base case (Case 00), Table 3 shows that the air change efficiency varied from 0.64 to 0.68 within the workstation and from 0.68 to 0.70 in the surrounding area. The local mean age of air varied from 41.6 to 44.6 minutes within the workstation and from 40.9 to 42.0 minutes in the surround- ing area. For each of the seven diffuser layouts (Cases 01 through 07), the air change efficiency and the local wan age of air varied from location to location within a range similar to that of the base case.
In Figure 3a, the average of the local mean ages of air measured throughout the room (room mean age of air) and the local mean age of air in the return duct are each plotted against the average of the local mean ages of air within the workstation only. The average of the local mean ages of air within the workstation only was almost identical to the average of the I dmean ages of air measured throughout the room and it was within 5 % of the local mean age of air
in the retum air duct. This deviation was within the measurement error.
Figure 3b shows that the average values-of air~change efficiency for the workstation only agreed closely with those for the room as a whole. The agreement between these two and the air change efficiency in the return air duct was within 5%. It also shows that the average air change efficiency decreased linearly as the average mean age of air for the workstation increased.
To interpret the result, Cases 00 and 01 were exam- ined. These two cases had the same diffuser layout except
TABLE 1
Ex~erimental Conditions
I
Case NO.C
Arrangement of Air Diffusers1 00 (Base) 01 02 03 04 05 06 07 08 09 10 11 14 15
I
Work StationI
Hekht Bottom Gap1
Supdv Air Rate No Yes Yes Yes Yes Yes Yes Yes Yes Yes Yes Yes Yes Yesloo
(212)loo
(212)loo
(212)loo
(212) loo (212)loo
(212) loo (212) loo (212)loo
(212)loo
(212) loo (212) loo (212) 50 (106)TABLE 2
Summary of the Test Results
Symbols: Subscript:
C = Gas concentration; ra = R e m
ak;
e = Air change efficiency, @e; rrn =Room;
E = Ventilation efficiency,
(c-Q/(G-Q;
sa P Sup,ily air, h = Nominal time, V/Q; sn3 = Swr,unding arts:Q = Supply airflow rate; ws = Within the workstation; V = Room volume;
<o = Mean age of air.
42 44 46 4 8 50 52 42 44 4 6 48 50 5 2
:bJ MEAN AGE OF AIR
-
WORKSTATION, <t>ws, minMEAN ACE OF AIR
-
WORKSTATION. <t>w,, min.
figure 3 Average of local mean ages of air, air change eficiency vs average of local mean age of air within the workstation for cases 00 through 07.
TABLE 3
Measured Mean Age and Air Change Effectiveness
Case 00: Case 01: Location <t> e Location <t> e 1 41.6 0 . 6 8 3 1 44.86 0 . 6 3 3 2 41.64 0.682 2 4 5 . 5 1 0.624 3 42.39 0.67 3 48.07 0 . 5 9 1 4 41.93 0 . 6 7 8 4 4 6 . 1 3 0 . 6 1 6 5 42.67 0 . 6 6 6 5 46.38 0.613 6 44.64 0 . 6 3 7 6 45.99 0 . 6 1 8 7 42.81 0.664 7 46.16 0.616 8 42.93 0 . 6 6 2 8 4 6 . 6 2 0 . 6 1 9 44.5 0.639 9 46.25 0.615 10 40.86 0.695 10 45 0 . 6 3 2 1 1 40.9 0.695 1 1 45.45 0.625 12 41.54 0.684 12 47.48 0 . 5 9 9 13 40.55 0 . 7 0 1 13 46.06 0 . 6 1 7 14 42 0 . 6 7 7 14 47.25 0 . 6 0 1 15 42.04 0 . 6 7 6 15 46.68 0 . 6 0 9 us avg 42.79 0.664 4 6 . 2 2 0.615 sra-avg 41.32 0 . 6 8 8 46.32 0.614 room-avg 42.2 0 . 6 7 3 46.26 0.614 return-a 42.92 0.662 47.43 0 . 6 0 0 U rm 0.945 U r m 0 . 9 6 3 Ulws 0 . 9 5 1 U ~ W S 0.965 S-rm 0.097 S rm 0 . 0 6 9 S-ws 0 . 0 7 1 SIws 0 . 0 6 9 Case 07: Location <t> s 1 4 6 . 9 1 0.606 2 45.75 0.621 Case 08: Case 0 2 : Location <t> 1 46.23 0.615 2 45.77 0 . 6 2 1 3 46.92 0 . 6 0 6 4 4 7 . 3 1 0 . 6 0 1 5 4 6 . 3 2 0.614 6 4 6 . 6 6 0 . 6 0 9 7 46.18 0 . 6 1 5 8 47.23 0.602 9 4 7 . 3 0 . 6 0 1 10 4 6 . 0 6 0.617 1 1 4 6 . 0 6 0.617 12 4 6 . 1 9 0 . 6 1 5 13 46.42 0.612 14 47.35 0 . 6 15 46.5 0 . 6 1 1 4 6 . 6 6 0 . 6 0 9 46.43 0 . 6 1 2 4 6 . 5 7 0 . 6 1 47.28 0 . 6 0 1 U r m 0 . 9 7 8 UIws 0 . 9 7 7 S r m 0.034 SIws 0 . 0 3 3 Case 09: Case 03: Location <t> e Case 10:
Case 04: Case 0 5 : Case 06:
Location <t> e Location <t> e Location <t> e
~ . ~ -14 44.22 0.643 i i 49.33 0 . 5 7 6 15 43.75 0.65 15 49.24 0 . 5 7 7 ws avg 4 3 . 6 5 0 . 6 5 1 50.62 0 . 5 6 1 sra avg 44.27 0 . 6 4 2 49.46 0.575 rooiii avg 43.9 0.647 50.16 0 . 5 6 7 retufn-a 44.73 0.635 48.89 0 . 5 8 1 U-rm 0 . 9 7 6 U-rm 0 . 9 6 9 U u s 0 . 9 8 7 U us 0.974 SIrm 0.046 SIrm 0 . 0 4 9 S-us 0 . 0 2 3 S-us 0 . 0 4 7
Case 11: Case 14: Case 15
Lacation <t> e Location <t> e Location <t> e Location <t> e Location Ct> e Location ct> e
1 49.24 0.577 1 3 9 . 7 0 . 7 1 6 1 3 8 . 6 8 0.735 1 38.62 0.736 1 68.47 0 . 8 3 1 108.3 1 . 0 5 2 4 7 . 5 7 0.597 2 3 7 . 6 0 . 7 5 6 2 40.22 0 . 7 0 7 2 3 9 . 0 9 0.727 2 69.12 0 . 8 2 2 2 104.6 1 . 0 8 7 3 47.69 0 . 5 9 6 3 38.14 0.745 3 39.83 0.714 3 41.74 0 . 6 8 1 3 73.56 0 . 7 7 3 3 106.2 1 . 0 7 1 4 45.54 0.624 4 37.98 0 . 7 4 8 4 44.59 0.637 4 40.91 0.695 4 74.05 0 . 7 6 8 4 110.5 1 . 0 2 9 5 45.62 0.623 5 3 9 . 4 2 0 . 7 2 1 5 40.64 0 . 6 9 9 5 41.73 0 . 6 8 1 5 66.42 0 . 8 5 6 5 103.3 1 . 1 0 1 6 47.55 0.598 6 40.34 0.704 6 3 9 . 9 2 0 . 7 1 2 6 3 9 . 5 1 0.719 6 68.29 0 . 8 3 2 6 106.4 1 . 0 6 8 7 47.85 0.594 7 42.26 0.673 7 40.97 0.694 7 41.22 0.689 7 65.86 0 . 8 6 3 7 102.4 1 . 1 1 8 4 8 . 0 1 0.592 8 41.52 0.684 8 41.3 0.688 8 4 1 . 5 9 0 . 6 8 3 8 6 7 . 8 1 0 . 8 3 8 8 101.7 1.118 9 47.57 0 . 5 9 7 9 42.29 0 . 6 7 2 9 40.55 0 . 7 0 1 9 4 1 . 3 2 0.688 9 6 4 . 4 1 0.883 9 1 0 4 . 1 1.092 10 48.99 0.58 10 46.07 0 . 6 1 7 10 38.96 0.729 10 3 9 . 5 5 0 . 7 1 9 10 69.63 0.816 1 0 113.6 1 . 0 0 11 49.42 0.575 1 1 43.53 0.653 11 3 9 . 0 8 0.727 1 1 42.04 0.676 1 1 70.3 0 . 8 0 9 11 1 0 8 . 1 1.052 12 48.52 0.586 . 12 42.95 0 . 6 6 2 12 38.73 0.734 12 40.85 0.696 12 68.38 0 . 8 3 1 1 2 1 0 4 . 2 1 . 0 9 1 13 47.92 0.593 13 43.44 0.654 13 38.94 0 . 7 3 13 41.72 0 . 6 8 1 13 65.79 0.864 1 3 103.2 1 . 1 0 1 14 48.23 0 . 5 8 9 14 42.35 0 . 6 7 1 14 41.01 0 . 6 9 3 14 42.46 0 . 6 6 9 14 67.27 0.845 14 1 0 2 . 7 1 . 1 0 7 15 48.6 0.585 1 5 42.74 0 . 6 6 5 15 4 1 . 1 0 . 6 9 1 15 44.64 0 . 6 3 7 15 65 79 0 . 8 5 1 15 107.3 1 . 0 5 9 ws avg 47.4 0 . 6 3 9 . 9 2 0 . 7 1 2 40.74 0 . 6 9 8 40.64 0 . 6 9 9 us avg . O 66 0.828 105.3 1 . 0 8 sra-avg 4 8 . 6 1 0.585 4 3 . 5 1 0.653 39.64 0 . 7 1 7 41.88 0.679 sra-avg 68.02 0 . 8 3 6 106.5 1 . 0 6 7
room avg 47.89 0.593 41.36 0.687 4 0 . 3 0.705 41.13 0 . 6 9 1 room-avg 6 8 . 4 1 0 . 8 3 1 105.8 1 . 0 7 5
return-a 5 3 . 2 1 0.534 47.79 0 . 5 9 5 5 1 . 7 1 0 . 5 5 54.28 0.524 return-a 70.06 0 . 8 1 1 107.8 1.055
U-rm 0.955 U r m 0 . 8 8 7 U r m 0 . 9 2 8 U r m 0.929 U-rm 0.924 U r m 0 . 9 3 9
U-us 0.954 UIws 0.914 UIws 0 . 9 2 5 U ~ W S 0.943 U us 0 . 9 1 U ~ W S 0 . 9 4 9
S-rm 0 . 0 8 1 S-rm 0.205 S-rm 0 . 1 4 6 S-rm 0 . 1 4 7 SIrm 0 . 1 4 1 S-rm 0 . 1 1 3
that
Case
00 had no workstation and, hence, the air distri- bution was not affected by office furniture. ForCase
00 (no workstation), the average values of the local mean age of air in the workstation and in the surrounding area were 42.8 and 41.3 minutes, respectively. The local mean age of air in the return air duct was 42.9 minutes. The corresponding values for Case 01 (with a workstation) were 46.2, 46.3, and 47.4 minutes, respectively.The greater age of air for Case 01 than Case 00 could be interpreted as being due to the dead air spaces in Case
01 created by the furniture and partitions. However, a closer examination of the results reveals that such an explanation may be too simplistic. The p-esence of a workstation could cause a change in the mean age of air in the workstation. Since the outdoor air, supply air, and return air rates were each the same for both cases, a decrease in the mean age of air at one location had to be accompanied by an increase in the mean age of air some- where else. For example, assuming that the presence of a workstation would prevent the ventilation air from moving from the workstation to its surrounding area (because the supply air diffusers were located directly above the worksta- tion), a decrease in the mean age of air in the workstation would be expected. This would also cause an increase in the mean age of air in the surrounding area. The mean age of air in the return duct would probably be between the two. This was not observed. In fact, the results indicate that the mean age of air increased in all 3 locations uniformly. Such an observation was also true for all other cases.
Furthermore, the air distribution tests (Shaw et al. 1993) suggest that all seven diffuser layouts distributed the ventilation air equally well. Although in theory the mean age of air and, hence, air change efficiency may be a reasonable ventilation index because of the possible error associated with the measurement technique, a small differ- ence, say 1076, in the mean age of air (and, hence, the air change efficiency) may not be sufficient to indicate that one layout would provide better ventilation for a space than another layout. This also suggests that further work is needed to interpret the result.
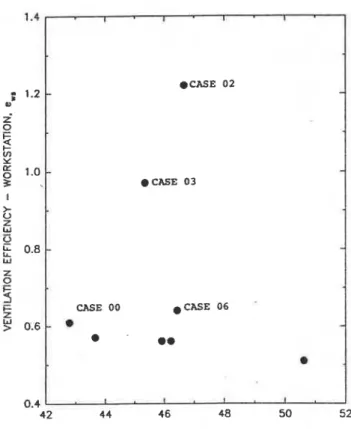
Ventilation Efficiency The values of ventilation efficiency for the workstation are given in Table 2 and shown in Figure 4 as a function of the average local mean age of air for the workstation. The results indicate that of the seven diffuser layouts tested with the workstation (Cases 01 through 07). two cases had much greater ventilation efficiency (1.22 and 0.97 for Cases 02 and 03, respectively) than the others (ventilation efficiency was typically about 0.57).
To determine the possible reason for the difference, Cases 03 and 07 were examined. Case 03 (similar to
Case
02) had one air-light fixture type of supply air diffuser (L2)
and one square return air grille (R7). The supply air diffuser was much closer to the contaminant source than other cases (Figure 1).
Case
07 had a similar design except that the supply air slot diffuser was replaced with a squareCASE 0 3
MEAN AGE OF AIR
-
WORKSTATION. <Ow=, minFigure 4 Ventihion &ciency for the workstation vs. average
of
local mean age of air within the workstation for cases 00 = 07.diffuser (S4). The supply air for
Case
03 was discharged intwo directions, while the supply air for Case 07 was discharged in four directions. Therefore, for Case 03, about one-half of the supply air was directly discharged into the area where the contaminant source was located, while for
Case
07, about one-fourth of the supply air was aimed at the contaminant source. Consequently, although the total supply air rate was identical, there was more air inCase
03 than in Case 07 to stir the contaminant for mixing. As a result, more contaminant was removed through the retum air and hence higher ventilation efficiency was achieved inCase
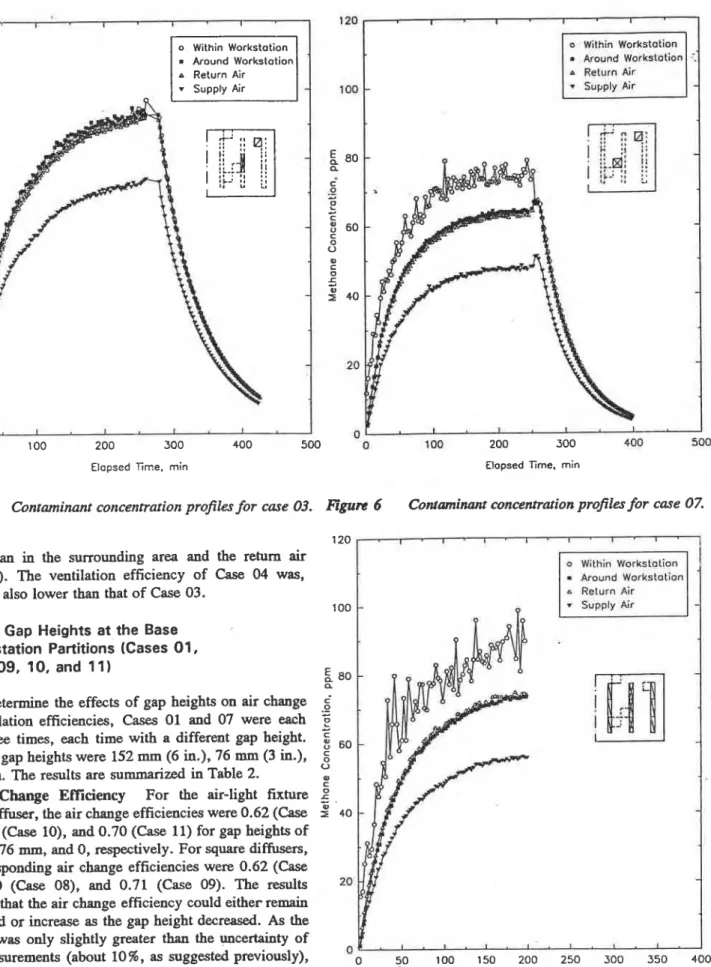
03 than in Case 07.Figures 5 and 6 show the concentration profiles for
Cases 03 and 07, respectively. As shown for Case 03, the
concentrations in the workstation, its surrounding area and, the return air were indistinguishable, while for Case 07, the concentration in the workstation was greater than that in the surrounding area and the return air. Also, the concentration profile in the workstation for Case 03 was smoother than that for
Case
07, another indication that better mixing was achieved inCase
03 than in Case 07.Furthermore, similarly to Case 03, Case 04 also had a single air-light fixture type of supply air diffuser. Because the diffuser was further away from the contaminant source, the contaminant source was not directly stirred by the air jets. As a result, the concentration in the workstation was
-
Around WorkstotionA Return Air
Elapsed Time. min Elapsed lime. rnin
figure 5 Contaminant concentration profiles for case 03.
Rgun 6
Contaminant concentration profiles for case 07.greater than in the surrounding area and the return air (Figure 7). The ventilation efficiency of Case 04 was, therefore, also lower than that of Case 03.
100
Effect of Gap Heights at-the Base of Workstation Partitions (Cases 01, 07, 08, 09, 10, and 1 1)
To determine the effects of gap heights on air change and ventilation efficiencies, Cases 01 and 07 were each tested three times, each time with a different gap height. The three gap heights were 152 mm (6 in.), 76 mm (3 in.), and 0 mm. The results are summarized in Table 2.
Air Change Efficiency For the air-light fixture type of diffuser, the air change efficiencies were 0.62 (Case Ol), 0.70 (Case lo), and 0.70 (Case 11) for gap heights of 152 mm, 76 mm, and 0, respectively. For square diffusers, the corresponding air change efficiencies were 0.62 (Case 07), 0.60 (Case 08), and 0.71 (Case 09). The results indicated that the air change efficiency could either remain unchanged or increase as the gap height decreased. As the
Around Workstation
P Return Air
increase was only slightly greater than the uncertainty of
such measurements (about 10 %
,
as suggested previously), 0 0 50 1 . 1 0 0 1 . 150 1 . 200 1 . 250 r . 300 l . t350 - 400 it may not be sufficient to suggest that workstation parti- Elopsed Time. mintions with no bottom gaps performed better than those with
bottom gaps, especially where the air distribution patterns figure 7 Contaminant concentration profiles for case 01
for the three gap heights were similar (Shaw et al. 1993). (supply aigow rate, 100 L/s).
~entila&n
EFficiency For the air-light fixture type of ' diffuser, the ventilation efficiencies were 0.56 (CaseOI),
0.65 (Case lo), and 0.70 (Case 11) for gap heights of 152 mm, 76 mm, and 0, respectively. For square diffusers, the corresponding ventilation efficiencies were 0.56 (Case 07), 0.53 (Case 081, and 0.60 (Case09).
The -Its indicate that a workstation with no h n o m gap in the partitions had a higher ventilation efficiency than with a 152-mm or 76-mm
bottom gap. As air distribution patterns were not affected by gap heights (Shaw et al. 1993), similarIy to air change efficiency, the increase in the ventilation efficiency may be insufficient to suggest that workstation partitions with no bottom gaps performed better than those with bottom gaps.I
Effect of Supply Airflow Rate (Cases 01, 14, and 15)
To determine the effect of supply airflow rates on the air change efficiency and ventilation efficiency, Case 01 was tested two additional times, each with a different supply airflow rate (the return airflow rate was always equal to the supply airflow rate). The results are given in Table 2.
Air
Change Efficiency
The air change efficiencies were 0.62 (Case Ol), 0.83 (Case 14), and 1.08 (Case 15) for supply air rates of 100 Lls (212 cfm), 50 Lls (106 cfm) and 25 Lls (53 cfm), respectively. Contrary to the general belief that the ventilation provided by a ventilation system deteriorates as the outdoor air supply rate decreases, the results indicate that the air change efficiency increased as the supply airflow rate and, hence, the outdoor air supply rate decreased.As the supply air rate decreased from 100 Lls to 25 L/s, the outdoor air supply rate decreased from 20 Lls (42.4 cfm) to 5 L/s (10.6 cfm). The nominal time constant (defined as the volume of the test room divided by the outdoor air supply rate), therefore, increased fourfold from 55.7 min to 222.7 min. The average mean age of air for the workstation (Table 3) increased only twofold, from 46.2 min to 105.3 min (the corresponding room mean ages of air for the room were 46.3 min and 105.8 min, respectively). Equation 1 indicates that such a disproportionate increase in the two parameters will lead to a large increase in the air change efficiency.
The results reveal that the air change efficiency failed to show that the ventilation provided by a ventilation system worsened as the supply airflow rate (outdoor air supply rate) decreased. Room mean age of air, on the other hand, appears to be a better indicator than air change efficiency to appropriately reflect changes in supply air rate. The results also suggest that air change efficiency may not be suitable for comparing ventilation systems with different ventilation rates (air change rates).
Ventilation
Efliciency
Table 2 shows that the ventila- tion efficiencies were 0.56 (Case Ol), 0.67 (Case .l4), and0.84 (Case 15) for supply air rates of 100 Lls, 50 U s , and
25 Us, respectively. Similar to the air change efficiency discussed above, these results indicate that the ventilation efficiency increased instead of decreased as the supply airflow rate and, hence, the outdoor air supply rate de- creased.
All three cases had three air-light fixture types- of diffusers for supply air and six identical diffusers for return air. Since the supply air diffusers extended beyond the full
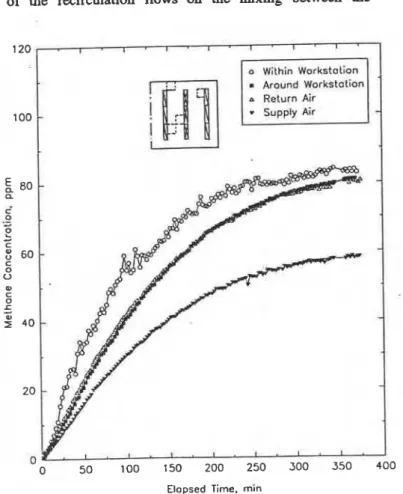
depth of the workstation, the supply air was discharged through two air jets, which, because of the partitions, produced six recirculation airflow cells: two main ones inside and two small ones outside each end of the worksta- tion. As the contaminant moved upward from its sourcq it merged and mixed with the recirculation flows inside the workstation. Because the size and strength of the recircula- tion airflow is proportional to the supply air rate, the turbulence and momentum associated with the recirculation airflow would be stronger for the 100-Lls supply airflow rate than the 25-Us one. As indicated in Figures 7 and 8, because of a stronger turbulence and the workstation partitions, the average contaminant concentration withh the workstation therefore fluctuated more rapidly for the 100- Lls than for the 25-Lls supply air rate.
Furthermore, Figures 7 and 8 suggest that the effects of the tecirculation flows on the mixing between the
m Around Workstation
a Return Air
"
0 50 100 150 200 250 300 350 400
Elapsed Time. min
figure 8 Contminantconcenrrationpr~_FI~ for case 15
contaminant and the air in and around the workstation were different, depending on the strength of the air jet. For the 100-L/s supply air rate, the jet penetrated deep into the workstation and the main recirculation flows were strong enough to disrupt the upward motion of the contaminant and circulate it within the workstation for mixing. This air inside the workstation was then distributed to the surround- ing area through the HVAC system. On the other hand, for the 25-L/s supply air rate, the jet would not penetrate deeply down into the workstation so the recirculation flows helped promote mixing only near the top of the workstation. Their effect was essentially to sweep the contaminant directly to the return air. As a result, the average contami- nant concentration within the workstation was closer to the concentration in the return duct for the 25-Lls supply air rate than for the 100-L/s supply air rate. As indicated in Equation 3, this led to a greater ventilation efficiency for the 25-L/s supply air rate. This is evident from Figures 7
and 8, which indicate that the average concentrations within the workstation approached their steady-state values in about 200 and 300 minutes for the 100- and 25-L/s supply air rates, respectively. They also show that even though the contaminant release rate for the 25-L/s supply air rate was about 50% of the 100-Lls supply air rate, the peak concen- trations in the return air and supply air for the two supply air rates were about the same. The results suggest that if the same contaminant release rate were used, the peak contami- nant concentrations within the workstation and in the surrounding area would be lower for the 100- L/s supply air rate than for the 25-L/s rate.
For this particular diffuserJgrille layout, the results show that the ventilation efficiency failed to indicate the fact that the average concentration within the workstation (or the test room) was lower and, hence, the ventilation was better for the 100-L/s supply air rate than the 25-L/s rate. Similar- ly to air change efficiency, the results suggest that ventila- tion efficiency may not be suitabIe for comparing ventilation systems with different ventilation rates (air change rates). SUMMARY
Seven different diffuser layouts were compared for their ability to distribute the supply air to a workstation located inside an enclosed room. They were also compared for their ability to remove a contaminant from a source located in the workstation. The results are summarized as follows
For the same supply air rate and gap height, the air change efficiencies differed from design to design by about 10%. Because of the possible error associated with the
measurement technique, such a small difference may not be sufficient to indicate that one layout would provide better ventilation for a space than another. The ventilation effi- ciency was improved for layouts that directed the supply air toward the contaminant source.
The effect of gap heights at the base of workstation partitions on the air distribution patterns was minimal.
For the layout with three air-light fixture types of diffusers for supply air and six identical diffusers for return air, which is commonly used for office buildings, both the air change efficiency and ventilation efficiency decreased as the supply air rate increased. This is contrary to the fact thai for a properly designed ventilation system, the ventila- tion condition improves as the ventilation rate increases. Further work is needed to verify that this conclusion is also applicable for other c o m m ~ d y used diffuserlgrille layouts for office buildings. This example suggests that both air change efficiency and ventilation efficiency may not be suitable for comparing ventilation systems with different ventilation rates (air change rates).
ACKNOWLEDGMENT
,The authors wish to acknowledge the contribution of Dr. J.T. Reardon in the preparation of this paper.
AIVC. 1990. A guide to air change efficiency. ANC Tech. Note 28. Air Infiltration and Veatilation Centre. AIVC. 199 1. A guide to contaminam removal effectiveness.
ANC
Tech. Note 28.2. Air Intiltration and Ventilation Centre.Anderson, R. 1988. Determination of ventilation efficiency based upon short term tests. Proceedings, 9th AIVC Conference, Belgium.
NTWS019. 1983. Buildings: Local mean age. Nordtest Method. Nordtest, Finland.
Shaw, C.Y., R.J. Magee, C.J. Shirtcliffe, and H. Unligil. 1991. Indoor air quality assessment in an office-library building: Part I-Test methods. ASHRAE Transactions 97(2).
Shaw, C.Y., J.S. Zhang,
M.N.
Said, F. Vaculik, and R.J:Magee. 1993. Effect of air diffuser layout on the ventilation conditions of a workstation: Part I-Air distribution patterns. ASHRAE Transactions 99(2). Skaret, E., and M. Sandberg. 1985. Air exchange and
ventilation efficiency-New aids for the ventilation industry. Norsk VVS (Norway) (7): 527-534. OA Trans 2869.
1 '
DISCUSSION
Robert Hadden, Willowdale,
ON,
Canada:
The conclu- sions are far too broad for the limited research. All diffu- sers are located within a few feet of the single workstation. They are also blowing downward at 45'. Both of these areunusual conditions in actual office space. With these constraints, the partition is not a significant variable and diffuser layout is not important except when it blows directly on the point source in tesk 2, 3, and 4. Tests 2, 3, and 4 should not be used to support any general conclusion about linear diffusers.
C.Y. Shaw:
We understandMr.
Hadden's concerns. ThisI is why we clearly indicated the conditions under which we
reached our conclusion. For example, in the last paragraph in the "Summary" section, we wrote, "For the layout with three air-light fixture type of diffusers for supply air
. . .
This example suggests that.
.
."
The seven diffuser layouts were chosen after visiting several tall office buildings. They are not unique designs.