Publisher’s version / Version de l'éditeur:
ASHRAE Transactions, 97, 1, pp. 275-282, 1991
READ THESE TERMS AND CONDITIONS CAREFULLY BEFORE USING THIS WEBSITE. https://nrc-publications.canada.ca/eng/copyright
Vous avez des questions? Nous pouvons vous aider. Pour communiquer directement avec un auteur, consultez la première page de la revue dans laquelle son article a été publié afin de trouver ses coordonnées. Si vous n’arrivez pas à les repérer, communiquez avec nous à [email protected].
Questions? Contact the NRC Publications Archive team at
[email protected]. If you wish to email the authors directly, please see the first page of the publication for their contact information.
NRC Publications Archive
Archives des publications du CNRC
This publication could be one of several versions: author’s original, accepted manuscript or the publisher’s version. / La version de cette publication peut être l’une des suivantes : la version prépublication de l’auteur, la version acceptée du manuscrit ou la version de l’éditeur.
Access and use of this website and the material on it are subject to the Terms and Conditions set forth at
An evaluation of a network smoke control model
Said, M. N.; MacDonald, R. A.
https://publications-cnrc.canada.ca/fra/droits
L’accès à ce site Web et l’utilisation de son contenu sont assujettis aux conditions présentées dans le site LISEZ CES CONDITIONS ATTENTIVEMENT AVANT D’UTILISER CE SITE WEB.
NRC Publications Record / Notice d'Archives des publications de CNRC:
https://nrc-publications.canada.ca/eng/view/object/?id=d4f6b90e-e524-47a8-a31b-e4fd6c65d269 https://publications-cnrc.canada.ca/fra/voir/objet/?id=d4f6b90e-e524-47a8-a31b-e4fd6c65d269
An evaluation of a network smoke
control model
Said, M.N.; MacDonald, R.A.
NRCC-38413
A version of this document is published in:ASHRAE Transactions, 97, (1), ASHRAE Winter Meeting (New York,
NY, USA, January-19-91), pp. 275-282, 91
The material in this document is covered by the provisions of the Copyright Act, by Canadian laws, policies, regulations and international agreements. Such provisions serve to identify the information source and, in specific instances, to prohibit reproduction of materials without
written permission. For more information visit http://laws.justice.gc.ca/en/showtdm/cs/C-42
Les renseignements dans ce document sont protégés par la Loi sur le droit d’auteur, par les lois, les politiques et les règlements du Canada et des accords internationaux. Ces dispositions permettent d’identifier la source de l’information et, dans certains cas, d’interdire la
347
AN EVALUATION OF A NETWORK
SMOKE CONTROL MODEL
M.N.A. Said, Ph.D., P.E. ABSTRACT
This paper describes the evaluation of the air-and-smoke-movement model developed at a Canadian research institute. To verify the made/, predicted data are compared with data from full-scale fire tests involving a pressurized stair shaft smoke control system. The tests were conducted in the 10-story experimental. fire tower at the National Fire Laboratory of the National Research Council of Canada. Predicted data exhibit good agreement with measured data. The paper also discusses the effects of large exterior and interior openings and the pressure due to the fire on the building's pressures and on smoke migration.
INTRODUCTION
Analytical models for smoke movement (resulting from a fire) in buildings are becoming an essential tool for the design and evaluation of various smoke control techniques. Analytical modeling reduces the design effort and allows many design possibilities to be examined. The verification of these models against measured data is of significant concern.
AIR-AND-SMOKE-MOVEMENT MODEL
The air-and-smoke-movement model (Yoshida et a!. 1979) was developed as an aid to analyzing pressurized shaft (stair, elevator, etc.) smoke control systems with single or multiple injections. The model can also be used to analyze zoned (sandwich) smoke control systems in which an entire floor or several floors are considered to be a separate smoke control zone. The model's characteristics include the following:
R.A. MacDonald
The model's limitations and assumptions are as follows: • each compartment is considered to be at a uniform
pressure and temperature, and pressures remain con-stant until flow opening(s) or fire temperature changes; • no provisions are made for vestibules;
• the model assumes instant mixing of air and smoke; • pressures, flows, and leakage openings are assumed to
be at the mid-height of each level;
• ventilation and pressurization air supply rates are as-sumed to remain constant and independent of inside and outside pressures;
• the model does not predict air temperatures but uses the user's prescribed temperatures to calculate the air densities throughout the building and the airflow due to thermal expansion of the hot gases in the fire compart-ment;
• the density of gas (air and smoke) is assumed constant for all spaces except the fire compartment; and • gas production due to decomposition of combustibles in
the fire compartment is neglected.
Model's Concept
The model employs the generalized orifice flow equa-tion, the conservation of mass equaequa-tion, and a smoke (pollutant) concentration equation (Yoshida et a!. 1979). The building is simulated by a series of vertically stacked compartments interconnected by vertical shafts and leakage openings (Fignre 1). Each compartment is at a uniform pressure and temperature.
The fire compartment is subdivided into four levels to account for the vertical distribution of leakage openings. The flow resistance in shafts is simulated by a series of orifices, one for each level. The size of the orifice is
• it calculates airflows, pressures, and smoke (pollutant) determined by empirical correlations (Achakji and Tamura
travel throughout a tall building; 1988).
• it is quasi-transient, i.e., during the course of a simula- The solution procedure is shown in Fignre 2. For given
lion, smoke movement is calculated at every time step, building conditions, the model first calculates the
steady-but airflows and pressures are calculated ouly when the state airflows and pressures throughout the building.
flow opening(s) or fire temperature changes; Starting from an approximate trial solution, an iterative
• it is applicable to buildings with an open floor plan; algorithm improves the solution (airflows and pressures)
• it accounts for major driving forces-stack effect, wind until a predetermined convergence criterion is satisfied.
pressure, thermal expansion of hot gases (in the fire Smoke concentrations are then calculated using the
calculat-room only), and ventilation air supply/exhaust rates; ed airflow data and the prescribed smoke-time profile. The
MMMMMセヲオNョセᄋ@ 」BGエゥZBッBGョGMBャッLウBGZウ・ウセ⦅NゥョNN⦅カセ・LイエBBゥBG」。LNLャGMBウィBG。BGヲエBGウBM[⦅NL。ョL、N⦅LッLNーL・BGイ。BGエBゥッLNョN⦅LッBGヲ@ _ _..m..,o,..d..,eLI ⦅NLォNNL・・GBーBGMGウGMBGエイ。」セォセッ@ ... f_,an""y changes in the prescribed fire
windows and doors; temperature and leakage areas (operation of windows and
• fire is simulated by temperature-time and smoke con- doors). At the onset of any such change(s), the model
centration-time profiles; recalculates the steady-state airflows and pressures
through-• it includes correlations for the calculation of local wind out the building and then continues the smoke concentration
pressure coefficients; and calculations. The model's input data include
• the code can simulate up to 100 levels and 10 shafts,
each level representing a whole or a fraction of a • a description of the building-floor heights, volumes of
typical story of a building and each shaft having the compartments and shafts, leakage openings, etc.;
potential of two vents to the outside, located at any • net air supply or exhaust to each floor and shaft;
level. • wind pressures (differential pressures across exterior
M. Nady A. Said is a Research Officer and Robert A. MacDonald is a Senior Technical Officer for the National Research Council of Canada in the Institute for Research in Construction, Ottawa, Ontario, Canada.
r---f
•t-セB@
•t--セMMh@
rl-t---11
• •
+-
l----it-H,
エMセ@
F----i
f;;"'
セ@
...
ヲセGセ@
..
J ...
f
Fire キゥセ、セセ@.. ·I·
. . . . ·I·.
ri
セセセ@..
ィᄋᄋᄋᄋᄋセᄋᄋᄋᄋᄋ@
!zit Stair Door Door 2.4 2.3 2. 2A0 : Equivalent Orifice Area of Stair abaft
As : X•eection Area of stair abaft
At : Leaka;e flow areas
Window
Figru-e 1 s」ィ・ュ。セゥ」@ of the building simulated walls can either be entered or calculated in terms of the wind pressure coefficients and wind speed and
direc-tion;
• fire temperature-time and smoke concentration-time profiles and fire location;
• mdoor air temperature in all floors and shafts; and • an operating schedule for doors and windows and the
size of these openings.
EXPERIMENTAL STUDY
The experiments were designed to assess the perfor-mance of the model for the case of a pressurized stair shaft, various fire conditions, and with the operation of doors and windows.
The experiments were conducted in the 10-story experi-mental fire tower of the National Research Council of Canada. The tower, described in detail in Achalgi (1987), contains a central core with typical shafts (stairs, elevator,
276
GIVEN INITIAL BUILDING
CONDITIONS
CALCULATE
STEADY-STATE AIRFLOWS
THROUGHOUT THE BUILDING
CALClA.ATE SHOKE CONCENTRATION CHECK
I
NO CHANGES BLDG. CONON. CHANGED_,•
END TIMEI
DONEI
FigiD't! 2 The model solution procedure The stair shaft is a conventional type with open tread-metal stairs. The shaft has a cross-sectional area of 134.4
ft2 (12.5 m') and a total height of 92 ft (28 m). Each floor
is 8.5 ft (2.6 m) high except the first and second floors, which are each 11.8 ft (3.6 m) high. The doors of the stair shaft and its lobby on each floor operate together such that both doors are either in the closed or fully opened position. The door operation is controlled from the second-floor observation area. The stair's air supply shaft (Figure 3) has a supply air opening on each floor to allow for multiple air injections for shaft pressurization. The supply shaft is connected to a variable-speed centrifugal fan with a capacity
of 38,000 cfrn at 2.6 in. of water (18 m3/s at 650 Pa).
Carbon dioxide (CO,), a combustion byproduct of the
burners, is used to trace the smoke movement in the
building. C02 concentrations are sampled on each floor (in
the floor space, shafts, and vestibules) by copper sampling tubes mounted 1 ft (0.3 m) below the ceiling. The sampling tubes on each floor are connected through a 12-port samplmg valve umt to a nondtspers1ve mfrared gas analyzer (range 0% to 20% by volume ±0.2 for the second floor, and 0% to 2.5% by volume ±0.2 for other floors). Differ-ential pressures across the various walls are measured using pressure taps mounted flush to the walls at 1 ft (0.3 m) below the ceiling on each floor. For the stair shaft, two additional pressure taps were mounted on the second floor at 3.5 ft (1.07 m) and 7 ft (2.14 m) from !he floor level. All pressure taps on each floor are connected to a 24-port scanning valve (located on the same floor) equipped with a diaphragm-type variable-reluctance pressure transducer with a range of 0 to 1 in. of water ±0.004 (0 to 250 Pa ± 1). ASH RAE Transactions: Research
TABLE 1
Leakage Flow Areas per Floor of the Experimental Fire Tower
Location Area
(ft'} (m')
ErtmorWaUs
2nd floor west & east walls
window open, each 5.0 0.465
window closed, each 0.395 0.037
south wall 0.02 0.002
north wall sealed
Typical floor west & east walls, each 0.395 0.037
north & south walls sealed
Elevator
O.o7 0.0065
0.25 0.023
Floor space to elevator shaft Floor space to elevator lobby
(door closed) Floor spaceto elevator lobby
(door open) Elevator lobby to elevator shaft
(door closed) Elevator lobby to elevator shaft
(door open)
20.00 1.858
Stairs
Floor space to stair shaft Floor space to stair lobby
(door closed) Floor space to stair lobby
(door open)" Stair lobby to stair shaft
(door closed) Stair lobby to stair shaft
(door open)" ·effective door opening
Vertical Shqfls 0.5 0.047 6.0 0.557 0.03 0.0028 0.25 0.023 20.00 1.858 0.25 0.023 20.00 1.858 18.20 1.690
Floor space to service shaft 1.10
Floor space to main supply air shaft 1.89
Floor space to main return air shaft 1. 82
0.102 0.1756 0.1691 Main supply and return shaft openings
on second floor are sealed
Ceiling 0.56 0.052
Temperatures are measured on each floor uaing chrome!· alumel thermocouples with a range ofo•p to 2370°F ±3° (o•c to 13oo•c
±
1.5°). Differential pressures, temper· atures, and carbon dioxide concentrations throughout the fire tower are recorded by a data acquisition unit.The total air supply rate for the stair shaft pressurize· lion was measured with multi-point self-averaging total pressure tubes and their associated static pressure taps. The calibration curve of the total pressure-averaging tubes was obtained by conducting a 42-point pilot-static traverse.
ASH RAE Transactions: Research
EXPERIMENTAl TOWER QNMNッエnqセy@ エNョセャャャエゥNpp|t@ J . .aDNCIM'TU!HI- .. .-rNI'Ia.-T ZエNiimoAcャセshapGt@ f.IEIMCI
*""'"
'- EC.EVATOAISTAII'II,OM.Y BBBBGセG@ NOTI!·--... - .... ...,.Figlll't! 3 Plan of the experimental fire tower
Wind speed and direction. are measured using a four-bladed propeller-type anemometer. The anemometer was located 26 ft (8 m) above the tower's main roof, about 118 ft (36m) above ground level.
Two bum tests were conducted using the propane gas burners on the second floor. The maximum fire tempera-tures achieved were 1,470°F (800°C) for the high fire temperature test and 1,022"F (Sso•c) for the low fire temperature test.
The stair shaft was pressurized to 0.1 in. of water (25 Pa) above the floor space (measured on the second floor) prior to the ignition of the burners. The shaft air supply was injected on the top floor (tenth floor). The stair shaft door and the exit doors on the ground floor were opened to the outdoors throughout the tests, as required by the National Building Code of Canada. Also, for the high-temperature test, the windows on the fire floor (second floor) were open throughout the test to avoid excessive temperatures for building protection. After the fire tempera-ture profile was established, various arrangements (opening and closing) of the stair shaft doors and exterior wall openings (windows) were followed as per Table 2. The
TABLE 2
Operation Schedule of Doors and Windows
7ime (min) from ignition
Closing Low Fire TsnperatiiU Test:
2nd floor windows 45 end of test
(west and east walls)
3rd floor stair doors 90 end of test
Hrgli 1'ue lemperdliiTe lur:
2nd floor windows Open throughout the test
3rd floor stair doors 30 60
9th floor stair doors 60 end of test
(Ground-floor stair doors open to outdoors throughout both tests)
door to the stair shaft on the fire floor was not opened during the tests because it was assumed that the occupants on the fire floor would be evacuated before the fire temper-ature was established.
computerNセulation@
The buildiog (Figures 1 and 3) was simulated as 10 floors and 5 vertical shafts (elevator, stairs, service, buildiog supply, and buildiog return). The stair shaft door on the ground floor was open to the outdoors throughout the
simulation.
The fire was located on the second floor, which was
subdivided ioto four levels io the simulation. Figure 4
shows the fire temperature and smoke concentration (CO,) profiles used io the simulation. Combustion air supply to the burners on the second floor was iocluded io the simula-tion. Measured average wiod pressures for each floor were entered directly ioto the model. Indoor air temperatures io the floor space and shafts were taken as the average values as measured throughout the test. Table 3 summarizes the conditions of the simulations.
The equivalent orifice area (A.) for the stair shaft
pres-sure loss calculations was taken accordiog to Achatgi and Tamura (1988) as follows:
A/A,
= 0.29 for first and second floorsA/A,
=0.225
for all other floorswhere A, is the cross-sectional area of the stair shaft. The other shafts were assumed to be frictionless.
RESULTS AND DISCUSSION
In the
cases
studied, the model (basically the airflowcalculations) converged fairly fast (io about 30 iterations). TABLE 3 Simulation Conditions Ollldoor conditions: Temperature, op [° C) \Wind Speed, mph [kmh] Wind Direction Fire Temp. IJ()(J'C [1,472'Fj 86 [30] 1.9 [3] ENE YveTemp. 55{J'C [1,022'Fj 86 [30] 3.1 [5] SE (;: 0
e..
e..
1516 800 a \JO-t. 700 7 a..
w 1092 600セ@
E"'
5セ@
g
aBO 500''"
4 セ@ a. ••a セ@セ@
300v
ᄋMBMセM
'
N 456 ッMッ」ッセ@ 2 a 200 u 244 100 Hl!lh fltoo r ... セ@ Tat 32 0 0 0 20 40 60 BD 100 120 (;: 0 TIME (min)e..
e..
1516 aoo a IJ04 700 7'
..
w 1092 600 E"'
セ@:
5,
セ@
500---
0 aao((
> 400 4 セ@セ@ a.'"
セ@セ@
300 Mイセエオョッ@'
N 456 o-oco2 2 a 200 u244 100 l.o• Fino r""''"l">tuno Toat
"
0 00 20 40 60 80 100 120 TIME (min)
Figure 4 Fire temperature and smoke production (CO,) profiles
Typical computation time for an airflow calculation was
about 35 seconds on a 6-MHz personal computer. For a
complete
run,
which iocluded smoke concentrationcalcula-tions and operation of doors and windows, the total compu-tation time was about four mioutes.
Pressure
Figures
5
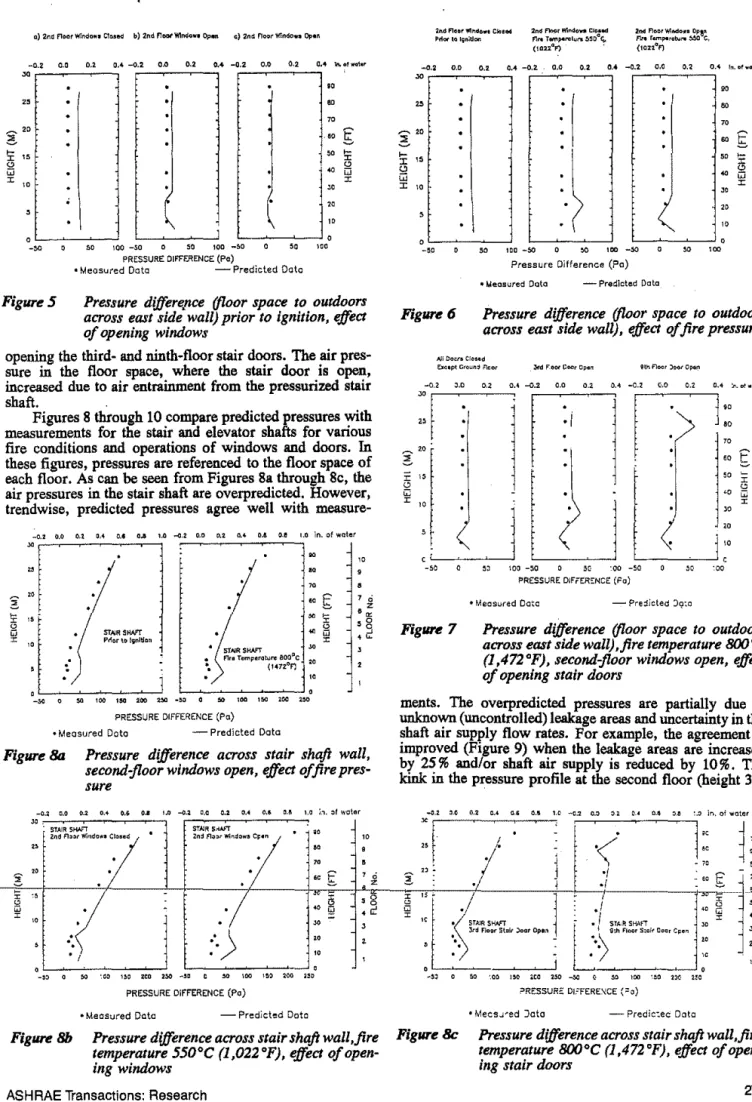
through 10 compare predicted differentialpressures with measurements. As noted earlier, the ground floor stair door was open to the outdoors throughout the simulation and tests. Also, for the high-temperature test, the windows on the fire floor (second floor) were open through-out the simulation and test.
Figures 5 through 7 demonstrate the effects of large exterior and ioterior openiogs (windows and doors) and the pressure due to fire on the air pressure io the floor space. These figures show the pressure io the floor space relative to the outdoor pressure across the east-side wall. The effect of openiog the second-floor windows (east and west walls)
Average Indoor Air Temperature, 'F ['C) is characterized by a kink io the pressure profile at that
Floor space 82 [28] 72 [22] floor (Figure 5b). The discrepancy between predictions and
Stair shaft 75 [24] 75 [24] measurements is partially due to unknown leakage areas.
Elevator shaft 75 [24] 68 [20] For iostance, when the leakage areas are iocreased by 25%
Service shaft 75 [24J1 _ _ セWlsjNNNエ\{RZ。T\AMャMMMMMGHf]ゥァオセイ」L・]]U」Z」@ ).!''C:'p':'rC::ed:=te;. 」G]エゥLッセョウBZMB。ァLNイB・・BG]G「・GゥBGエエBG・イゥZMZBキエGM[ᄋセエィL⦅ュGt・。ウBWNオBイ・BGュゥBBG・ョN⦅LエウLN」MMMMM[MMMエ@
Building supply shaft 93 [34] 93 [34] The pressure iocrease due to the fire for the low fire
Building return shaft 75 [24] 75 [24] temperature
(550'C)
is shown io Figure 6. Predicted airMaximum Fire Temperature, pressure io the fire compartment iocreased by 0.07 io. of
water (18 Pa), compared with
a
measured value of 0.03 io.'F ['C] 1,472 [8001 1,022 [550] of water (8 Pa). It is noted that when the windows on the
Pressurization fire floor (second floor) were opened, the air pressure
Air Supply, cfm 19,124 22,200 decreased as a result of ventiog by the windows. For the
Combustion
[L/s] [9,046] [10,500] high fire temperature (800'C, windows open), the pressure
iocrease was 0.06 io. of water (15 Pa), while the measured value was 0.04 io. of water (11 Pa).
Air Supply, cfm [L/s] 803 [380] 435 [206] Figure 7 shows the effect on the floor pressure due to
a) 2nd floor Windon CI<>S&d b) 2nd F'!ODt'IIIMowo Op0111 c) 2nd noor Win<lon Opon
-o.z o.o 0.1 0,4 -o.z o.o 0.2 0.4 -o.2 o.o 0.2
...
Tt>.o!walor""
..
"
..
"
..
s
"'
セ@"'
"
..
w"'
"
,.
"
ッGMMセMセMN⦅ェ@ 0-so ::.o 100 -so so too -5o 50
,
..
PRESSURE DIFFERENCE (Po)
• Meosuted Data -Predicted Data
Figure 5 Pressure differepce (floor space to outdoors across east side wall) prior to ignition, effect of opening windows
opening the third- and ninth-floor stair doors. The air pres-sure in the floor space, where the stair door is open, increased due to air entrainment from the pressurized stair shaft.
Figures 8 through 10 compare predicted pressures with measurements for the stair and elevator shafts for various fire conditions and operations of windows and doors. In these figures, pressures are referenced to the floor space of each floor. As can be seen from Figures Sa through 8c, the air pressures in the stair shaft are overpredicted. However, trendwise, predicted pressures agree well with
measure-セ@
'i'
8
"'
-0.2 o.o o.t o.4 o.e o..s 1.0 -o.2 o.o 0.2 0.4 o.a o.e 1.0 in. of woter
"
セ@"
"
"
"
"
!;
"
STAIR SAAPT"
•
セ@"'
8
"
Pilar to h;nltlon セセセNセセ。キョZ@ aoo0c"
"'
"
0 0 (\47Z
0F")
"
PRESSURE DIFFERENCE (Po)
• Measuted Data -Predicted Data
"
•
'
ci z'•
'g
"
.
セ@Figure 8a Pressure difference across stair shaft wall, second :floor windows open, effect of fire
pres-sure
MッNセ@ co 02 o• ッセ@ o.a •o Mッセ@ oo ot 04 os oa to ᄋセMセヲキッエ・イ@
"
·: S"IAIR SHAFT STAIR sNセNッNft@..
'"' ""'
BBGセMᄋ@
7
'"' ""'
BGGセBA@
"
"
"
•
"
•
セ@"
セ」@ f ' ci z セ@.,
/
-"'
./
"'
'g8
-
..
セ@-セ@ d
"' "
-"
'
'
:"-)
"
"
'
'
•
_,
•
•
"
..,
"'
"'
zso -50 0..
'" "'
...
"'
PRESSURE DIFFERENCE (Po)
• Meosuted Data -Predicted Data
2nd floor Bmョセ。キッ@ ClooM 2nd Fl<>or Wlndo ... Claood
Ptlct lo liniUon F1ro T""'J>O'"Iyra 550°C,. (ton°F) · -0.2 0.0
'·'
0.4 -0.2.•..
'·'
,_.
""
"
2ncl Floor 1\\odo-• OpW':
fャイッtッューッイッエNNイッセ@ C, (\C21°f}
_.,
" "
..
ln. o! セgエBG@"
.,
..
セB@s
セ@.,
....
"
:.
セ@
"
セ@ J: :r1:l
:r..
i;l"
"
:r<
"
"
_,
"
teo -so•
00 >OO_,
"
•oo Pressure Difference (Po)• t.!easured Dato -Predicted Data
Figurl! 6 Pressure difference (floor space to outdoors across east side wall), セ・」エ@ of fire pressure
All OO<:ro CIOO•d
E>oopt Groun:j floor YQセ@ floor J-oor Opon
:Ttl·
m·
MセセMMyZZL@
...
セ@
"
·
f
:1
j
f
: (
j
i
::llJ
I \ :
I }
iセ[@
,
-!iO セセ@ too -50L{J
o 50 ·oo Mセッ@LLJ
セ」M ·ooPRESSURE DIFfER::NCE (Fa)
• Measured Da;:c - Pre:!icted JQ:o
Figure 7 Pressure difference (floor space to outdoors across east side wall),fire temperature 800'C (1,472°F), second:floor windows open, セ・」エ@
of opening stair doors
ments. The overpredicted pressures are partially due to
オョォョッセ@ (uncontrolled) leakage areas and uncertainty in the
セィ。ヲエ@ air supply flow rates. For example, the agreement is Improved (Figure 9) when the leakage areas are increased by 25% and/or shaft air supply is reduced by 10%. The
kink m the pressure profile at the second floor (height 3. 6
セᄋ@
:r
セ@"
-"
15" 0 Q" "
'
•
セMP@ 0.2 0.4 C.i 0.! 1.0 -c.2 ッNセ@ セR@ Q.o ッNセ@ o.& :.o in. oi woter
-<
·Il::
•f -oo/
./
./
l
o STAJR SHAFTP
セ@
Jrd Floor Stoirセ」」エ@ oーセ@
:.')
;
!
セP@
. I
staNセ@ SfWi セ@:·
セ@
""
"""''""
....
''"
::
?RESSUR=: diN]Mfereセce@ (;:c)• m・」ウjセ・、@ Jato - Predic:ec Data
sl
[PPセ@
セ@
Iセ@
• セ@'
'
Figure 8b Pressure difference across stair shaft wall ,fire Figure 8c
temperature 550°C (1,022°F), effect of
open-Pressure difference across stair shaft wall,fire temperature 800°C (1,472 °F), effect of open-ing stair doors
ing windows
-0.2 o.o o.z ·:l,4 0.11 o.a 1.0 in, ot woter BイMMMセMMMMMMMMセMMMMセセMMセMMセ@
"
I I .·• I .· I." ONセ@ セセMMᄋ@ I 'I· STAIR SHAFT
..
.;: • ヲa・ッ。オセ、@ dcto pセ、ゥ」エャ・ョウZ@ I' • l' I
.
.
.
'
'
'
.
BBGNMZセ@ - 9esed 011 MeoSur<!d ャNエッャ\セセᄋ@Areo• and olr Svpply • · licセq\Li・@ Arecs ャョ」セッウ・・@ by 25 !II;
- • Sto:r'1 Air Supply Reduced セケ@ 1a 1.:
"
"
"
'"
"'
セ@
7 z d"
セ@"'
z 0.,
i;l 0 セ@ z•
セ@"
"
"
0"'
GMッセッMMMMMZMMMMZLZMMMMZL・ZLMMMMLセ@..
MMMMMLPPセMM⦅j@PRESSURE DIFFEREI\CE (Po)
Figure9 Pressure difference across stair shaft wall,fire temperature 800°C (1,472°F), second:floor windows open, effect of input parameters
m to
7. 2
m) is a result of the kink in the pressure profilefor the floor space at that floor (Figures
5
through 7).For the elevator shaft, Figures lOa and lOb, the agree·
ment is very good. This is because, unlike the stair shaft, the elevator shaft involves leakage flows only. Also, the friction pressure losses are not a major factor here. Smoke Concentration
Smoke migration is discussed in terms of normalized
smoke concentration
(C' ).
It represents the percent byvolume of contaminated air from the fire compartment and is calculated by where
C',,,
c,,.
c",
c".
C',,,
= 100 · [C,,,-c, .•
Ji[C,,, - C,.ol
= smoke concentration in compartment i at time
t
= initial smoke concentration in compartment
i
at time 0
= smoke concentration in fire compartment at
timet
=
initial smoke concentration in firecompart-ment at time 0.
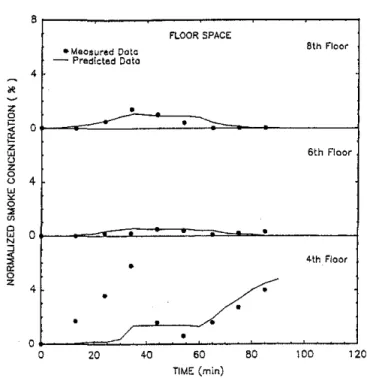
Figures 11 and 12 present predicted and measured normalized smoke concentration (CO,) for the floor space and elevator shaft for the third, fourth, sixth, and eighth
floors. For the second-floor space (the fire floor), the C02
profile is specified (see Figure 4) in the input data and
hence is not shown here.
For the floor space of the sixth and eighth floors, predicted normalized smoke concentrations agree well with _________ ·--- エAisG⦅ャエエGGGBAiセaaiAA。GゥァャAャGャャ⦅ャh^ILh\ャZキャセャOセイNヲッイ⦅エ「BG⦅A「ゥイ、セ@
fourth floors, the agreement is only good trendwise. This is due to their proximity to the influence of the continuing changes in fire conditions on the fire floor. The burner's controller maintains the set temperature within ±90°F (50°C). The model assumes steady-state conditions and instant mixing of air and smoke. If complete mixing and steady-state conditions did not prevail, the predictions would deviate from the measurements. Also, a contributing
factor is that, in the experiments, C02 concentration is
measured at one location (close to the ceiling in each compartment).
280
Also noted is that, when the third-floor stair door
was
opened (Figure lla), normalized smoke concentration dropped sharply on the third floor. This is due to the dilution action by the air from the pressurized stair shaft. However, opening the ninth-floor door, close to the shaft air supply, resulted in increasing the smoke spread to the third and fourth floors because of a considerable decrease in the shaft pressure at these floors (Figure Sc). Predicted data for the elevator shaft (Figure 12) agree very well with the measured data •
Shaft pressurization was effective in minimizing smoke migration to the stair shaft. Peak smoke concentrations in the stair shaft occurred at the fire floor level (second floor)
and were less
than
1.5% (Figure 13). Unlike predicted data,measured smoke migrstion from the fire floor to the stair shaft increased when the third-floor doors were opened. This was due to an almost total loss of shaft pressurization at the fire floor level caused by opening the third-floor door.
CONCLUSION
Predicted air pressures and smoke migration using the air and smoke movement model have been compared with
measured data from full-scale fire
tests
involving apressur-ized stair shaft smoke control system. Considering the model's inherent limitations, such as the assumption of
Prior to ャアョゥセッョ@
f'lro floor Vf.ndO'OI Cloud
Fl..., Tomp. セセPᄚc@ (1022°1'") Firo T•mp, :sc"c (1022°f) fu f'loor WOndows Cloud FlNI Floor WinO on Opon
-0.2 0.0 0., o.• -o a
" "
"
-0.2 0.0 0.,o
.•
;.,, or セ@::n
I"
"
-"
70 6 ."
セ@
>-z"
"
>-"
r"'
.,
"
"'
r 10 : r"
)
"
"
'
-50'
"'
100 -so 0"
>00 -00"
'"
PRESSiJRE DIFFERENCE (Po)
• Measured Data -Predicted Data
Figure lOa Pressure difference across stair shaft wall, effect of fire pressure and opening windows
-0.2 ll.O 0.2 o.• n.& c.l LG -c.t o.o O.i O-• e.s o.& · o in. o; キッセ・イ@
ᄏイセセセMMセMML@
"
"
ャセ@ :
•
セlovatcr@ SKI$1'セ@
エオ|Gatoセ@ sセaヲBゥG@ _.,l
Jrd Nセャ・・イ@ Slcir 00<1r oーキセ@ YQセ@ ;',cor Slclr Poor Opor.セ@ '
.
g
セ@g
"
'
0I
% -·---!:: -,j- !l:i'" 1-.
"'
G\
rsg
セ@ < セ@"
» r.
セ@ I)
セ@ •/"
'
_,'
' "
ᄋセ@ •» wo"'
-»• " "' '"
セ@"'
PRESSCRE DIFFERENCE (Po)
• Me:Jsured Dctc - .=>reoicted Dctc
Figure lOb Pressure difference across elevator wall, fire temperature 800
•c
(1,472 °F), fire floor win· dows open, effect of opening stair doorsI
I
28•
セ@ セ@ Floor Space c c•
"
•
•
0 3rd Floor 0.g.u
0 セ@ セ@ 24 セ@ c c c • 0 0 0 0 0 0 0 o o c·=·a
'a 0 -Vi セセ@ c 0 0 0 0 0 .2 G: o:"-1: .c"E -.-,"'
m-!
•
z
0 20z
0 0 w y: 16 0 2 (f) 12 0 w N :J <{ 8 2 • Measured Data - Predicted Data 0:: 0 4z
0 0 20 40 60 80 100 120TIME
(min)
Figure lla Smoke migration to floor space, fire tempera-ture 8()(JOC (1 ,472 °F)
instant mixing and steady-state conditions, predicted data agree reasonably well with measured data. Predicted results are sensitive to the accuracy of input data such as leakage areas and wind pressures. It is recommended that future efforts be directed toward establishing a reliable data base for smoke control design applications using various models. ACKNOWLEDGMENT
The authors gratefully acknowledge the efforts and cooperation of J.E. Berndt and the staff of the National Fire Laboratory, National Research Council of Canada, in the preparation and execution of the tests.
8 4 • 0 4 0 0 Figure 12 • u.,,...,. Oo\o - PrU\cto4 Coto / 20 40 ELEVATOR SHAFT '> 60 TIME (min) 8th ヲャセッイ@ 6th FloDr 4th Floor Jrd Floor 80 100 120
Smoke migration to elevator shaft, fire tem-perature 8()()•C (1,472°F)
ASH RAE Transactions: Research
8 • Measured Do to - Predicted Data 4
..
z 0!i'
0•
---"'
z'"
u z 0 u 4'"
"'
0 ::! セ@ 0 0 w Nセ@
"
•
0 z 4•
•
0 _/ 0 20 40 FLOOR SPACE•
•
60 TIME (min)•
80 8th Floor 6th Floor•
4th Floor•
100 120Figure llb Smoke migration to floor space, fire tempera-ture 800°C (1,472°F)
REFERENCES
Achakji, G.Y. 1987. "NRCC experimental fire エッキセイ@ for studies on smoke movement and smoke control m tall buildings." n。エゥッセセ。O@ Research Council of Canada, Institute for Research in Construction, NRCC/IRC Paper No. IR 512.
Achakji, G.Y., and G. Zイ。ュオイセN@ QYXセN@ Zpイ・ウセオイ・@ drap characteristics of typ1cal sta1rshaft m high-nse bu!ld-ings." ASHRAE Transactions, Val. 94, Part 1, pp. 1223-1237.
Tamura, G.T., and J.H. Klote. 1988. "Experimental fire tower studies on mechanical pressurization to control smoke movement caused by fire pressures." Second International Symposium on Fire Safety Science, Tokyo, Japan, June 13-17 .
Yoshida, H., C.Y. Shaw, and G.T. Tamura. 1979. "A FORTRAN 1V program to calculate smoke concentra-tions in a multi-story building." National Research Council af Canada, DBR Computer Program No. 45. 8
g
7"'
u 6 z 0 u w 5"
0 4"
<n 0 3 w N :J 2 -<"
"'
0 z 0 0 Figure 13 • Measured Octo Slnir Shntt - 1-'redicted Uoto Znd Floor[Note; Predicted Ooto oil O'sj
セ@ " " 8 15 g " 0 セ@
e
8
"
"
•
Gセi@
•
• •
•I
•
•
•
20 40 60 80 100 120 TIMF (min)Smoke migration to stair shaft, fire tempera-ture 8()()•C (1,472°F)
DISCUSSION
Gemma Kerr, Environmental Chemist, Public Works
Canada, Ottawa, Ontario: Have you considered using
tracer gas tests to measure leakage to see if this would give better agreement between experimental and calculated data?
M.N.A. Said: No, we did not use tracer gas to measure
uncontrolled leakage areas. However, we conducted component leakage testing for doors and windows.
During the fire testing, uncontrolled leakage areas change due to expansion as the fire temperature is elevated. Thus, we decided to neglect uncontrolled leakage in the
numerical simulation. However, we conducted a parametric
study to examine the effect of leakage areas on the numer-ical results (see Figures 5c and 9).
![TABLE 3 Simulation Conditions Ollldoor conditions: Temperature, op [° C) \Wind Speed, mph [kmh] Wind Direction Fire Temp](https://thumb-eu.123doks.com/thumbv2/123doknet/14259516.489144/7.933.473.840.60.498/table-simulation-conditions-ollldoor-conditions-temperature-speed-direction.webp)