HAL Id: hal-02627851
https://hal.inrae.fr/hal-02627851
Submitted on 26 May 2020
HAL is a multi-disciplinary open access archive for the deposit and dissemination of sci-entific research documents, whether they are pub-lished or not. The documents may come from teaching and research institutions in France or abroad, or from public or private research centers.
L’archive ouverte pluridisciplinaire HAL, est destinée au dépôt et à la diffusion de documents scientifiques de niveau recherche, publiés ou non, émanant des établissements d’enseignement et de recherche français ou étrangers, des laboratoires publics ou privés.
pre-puberty-related biomarkers identification in porcine
Ghylene Goudet, L. Nadal-Desbarats, Cécile Douet, Jonathan Savoie,
Christophe Staub, Eric Venturi, Stéphane Ferchaud, S. Boulot, Armelle
Prunier
To cite this version:
Ghylene Goudet, L. Nadal-Desbarats, Cécile Douet, Jonathan Savoie, Christophe Staub, et al.. Sali-vary and urinary metabolome analysis for pre-puberty-related biomarkers identification in porcine. animal, Published by Elsevier (since 2021) / Cambridge University Press (until 2020), 2019, 13 (4), pp.760-770. �10.1017/S1751731118002161�. �hal-02627851�
Salivary and urinary metabolome analysis for pre-puberty-related
biomarkers identi
fication in porcine
G. Goudet
1†, L. Nadal-Desbarats
2,3, C. Douet
1, J. Savoie
4, C. Staub
4, E. Venturi
4, S. Ferchaud
5,
S. Boulot
6and A. Prunier
71PRC, INRA, CNRS, IFCE, Université de Tours, 37380 Nouzilly, France;2INSERM U930, UFR de médecine, 10 bd Tonnellé, 37044 Tours, France;3Département d’analyses chimique biologique et médicale, Université François Rabelais, 37032 Tours, France;4PAO, INRA, 37380 Nouzilly, France;5GENESI, INRA, 17700 Surgères, France;6IFIP, Institut du Porc, 35650 Le Rheu, France;7PEGASE, Agrocampus Ouest, INRA, 35590 Saint-Gilles, France
(Received 7 December 2017; Accepted 20 July 2018)
Estrus synchronization is important for optimal management of gilt reproduction in pig farms. Hormonal treatments, such as synthetic progestogens, are used on a routine basis, but there is a growing demand for non-hormonal alternative breeding tools. Before puberty, gilts exhibit a‘waiting period,’ related to the ovarian development and gonadotrophin secretions, during which external stimulations, such as boar exposure, could induce and synchronizefirst ovulation. Practical non-invasive tools for identification of this period in farms are lacking. During this period, urinary oestrone levels are high, but urine sampling is difficult in group-housed females. The aim of this work was to search for specific biomarkers of the ‘waiting period’ in saliva and urine. In total, nine 144- to 147-day-old Large White gilts were subjected to trans-abdominal ultrasonography three times a week for 5 weeks until puberty detection (week–5 to week –1 before puberty). Urine and saliva samples were collected for oestrone assay to detect the‘waiting period’ and for metabolome analysis using1H-nuclear magnetic resonance spectroscopy to detect potential biomarkers of the‘waiting period.’ Gilts were slaughtered 7 days after puberty detection for puberty confirmation. Results were consistent with ultrasonography data for six gilts. Urine and saliva samples from these six gilts were analyzed. Urinary estrone concentration significantly increased 2 weeks before puberty detection. Metabolome analysis of urine samples allowed the identification of 78 spectral bins, among them, 42 low-molecular-weight metabolites were identified. Metabolome analysis of salivary samples allowed the identification of 59 spectral bins, among them, 23 low-molecular-weight metabolites were detected and 17 were identified. No potential biomarker was identified in urinary samples. In saliva, butyrate and 2HOvalerate, 5.79 ppm (putatively uridine), formate, malonate and propionate could be biomarker candidates to ascertain the pre-puberty period in gilt reproduction. These results confirm that non-invasive salivary samples could allow the identification of the physiological status of the gilts and presumably the optimal time for application of the boar effect. This could contribute to synchronize puberty onset and hence to develop non-hormonal breeding tools.
Keywords: saliva, urine, gilt, boar effect, nuclear magnetic resonance spectroscopy
Implications
Our results help to identify salivary biomarkers of the period during which gilts are sensitive to the boar effect, a solution to stimulate and synchronize puberty without hormones. They participate in the development of non-hormonal alternative breeding tools for optimal management of gilt reproduction.
Introduction
An important objective in pig farms is to be able to create batches of females in which insemination and thereby
farrowing will take place within a limited period of time. Indeed, the creation of batches of pigs has several advan-tages for the management of reproductive females and offspring (Bown, 2006). Batching enables all-in/all-out management systems that lead to better disease control and better hygiene, which lead to better animal health and performances. Batching allows management to have a tight control at the crucial stages of production such as service and farrowing. Moreover, management of pigs in groups results in the more efficient use of time, materials and feed, which lead to better economic performances. Finally, the batch production offers an increased opportu-nity for cross-fostering of piglets shortly after farrowing and lead to more uniform groups of piglets. Better animal
†E-mail: ghylene.goudet@inra.fr
which permits non-commercial re-use, distribution, and reproduction in any medium, provided the original work is unaltered and is properly cited. The written permission of Cambridge University Press must be obtained for commercial re-use or
in order to create a derivative work. doi:10.1017/S1751731118002161
and economic performances are expected from these advantages.
Management in batches requires estrus synchronization of gilts. Gilts replacing culled sows have to be synchronized with other sows from the batch. Synthetic progestogen, such as altrenogest, is commonly used for this purpose (Kraeling and Webel, 2015). However, there is a growing demand for non-hormonal alternatives. Therefore, solutions to synchro-nize puberty without hormones are necessary.
Early studies have shown that daily physical contact with a mature boar (the‘boar effect’) is an effective method for sti-mulating precocious puberty attainment in replacement gilts (Brooks and Cole, 1970; Kirkwood and Hughes, 1979; Hughes, 1994). The boar effect is mediated through the synergistic actions of visual, tactile, olfactory and auditory stimuli (Hughes
et al., 1990). However, the gilt response to boar stimulation can be extremely variable, and this variability has been ascri-bed, at least in part, to differences in the stage of physiological development of the gilts at boar stimulation (Hugheset al., 1990; Kingsbury and Rawlings, 1993). To overcome this pro-blem, the identification of biomarkers of responsiveness to the boar effect could be very useful to establish criteria for the onset of puberty stimulation.
Before puberty, gilts exhibit a‘waiting period,’ defined by a relatively high ovarian development but relatively low gonado-trophin secretions (Camouset al., 1985). An increase of urinary oestrone levels has been observed during this period (Camous
et al., 1985). During the‘waiting period,’ external stimulations, such as boar exposure, could induce and synchronize first ovulation. Practical non-invasive tools for identification of this period in farms would be very useful. Urine and more clearly saliva are easily accessible and can be sampled non-invasively without stress or pain. Thus, our aim was to identify in urine and/or saliva biomarkers of the‘waiting period.’
Metabolomics is the non-targeted identification and quantification of the metabolites present in a biological sample, to measure the response of an organism to envir-onmental stimuli or physiological modifications. The meta-bolome, which includes low-molecular-weight compounds (<1500 Daltons) such as peptides, lipids, carbohydrates, amino acids, vitamins and minerals, is a signature for phy-siological states (Lindonet al., 2004).1H-nuclear magnetic resonance (NMR) is one of the principal analytical techniques for metabolome analysis and blood and urine are thefluids most frequently studied in these investigations (Lindonet al., 2006; Beckonertet al., 2007; Lindonet al., 2007). The use of saliva in metabolomics studies is increasing in human for diagnosis of various diseases and endocrine disorders (Takedaet al., 2009; Wallner-Liebmannet al., 2016). How-ever, up to now, NMR analysis of the saliva metabolome has been performed neither in the pig nor in other domestic mammals.
In the present study, NMR analysis of gilt saliva and urine was performed for the investigation and identification of potential biomarkers of the‘waiting period’ preceding first ovulation, in order to develop tools for identification of the period of receptivity of gilts to the male effect. Preliminary
results have been published in an abstract form (Goudet
et al., 2017).
Material and methods
All procedures were performed in accordance with the guiding principles for the care and use of animals in research facilities.
Animals, housing and sample collection
This experiment was conducted from November to December in the experimental farm from INRA (Unité Expérimentale de Physiology Animale de l’Orfrasière). In all, nine Large-White 144- to 147-day-old gilts from three litters (unrelated dams and unrelated sires) were penned in a group on a concrete floor without straw under natural daylight. They had free access to water and were fed with concentrate once a day (2.4 kg/animal per day; porc Elevage INRA, Sanders Ouest, 35370 Etrelles, France; 16% CP, 2% crude fat content, 7.1% cellulose, 6.9% minerals, 0.62% phosphore, 1.15% calcium, 0.25% sodium, 0.8% lysine, 0.26% methionine). For the duration of the experiment, no boar contact and no mod-ification of the housing or feeding were performed.
Starting at 144 to 147 days of age, trans-abdominal ultrasonography was carried out three times a week to assess the physiological status, immaturev. pubertal, until puberty detection based on the uterus and ovarian devel-opment. Although restrained in a crate, gilts were scanned with an Esaote-Piemedical MyLab30 Vet Gold (Hospimédi SAS, Saint-Crépin-Ibouvillers, France) with a 3 to 10 Mhz convex probe. The examination was carried out externally by applying the probe in the inguinal zone andfirmly pressing on the animal’s skin to visualize the uterus. The ultrasono-graphic images of the uterus were codified as described previously (Martinat-Bottéet al., 2003). Females were con-sidered to be pubertal when ultrasonographic image char-acteristics of cyclic females with well-defined sections of the uterus and ovulations were detected (Figure 1). Females were considered to be immature when the uterine images were dark and homogeneous (Figure 1).
Starting at 144 to 147 days of age, urinary and salivary samples were collected for each gilt in the morning before feeding, three times a week, on the day of ultrasonography, until puberty detection. Spontaneously voided urine was collected in aflask. Due to the group housing, some attempts to collect urine were not successful. Saliva samples were collected using a cotton swab for saliva collection (Sarstedt Salivette®ref. 51.1534; Sarstedt, Nümbrecht, Germany). The cotton swab was held with forceps, and the gilt was allowed to chew on it until it was soaked. All attempts were suc-cessful. Urinary and saliva samples were brought to the lab on the ice, centrifuged at 3000× g for 5 min at 4°C, within 30 min after collection. The recovered saliva and urine were aliquoted and stored at−80°C until analyzed.
Gilts were slaughtered 7 days after ultrasonographic puberty detection for puberty confirmation. Length and
diameter of uterine horns were measured, ovaries were weighed and the number, diameter and appearance of the
corpora lutea(CL) and follicles were registered.
Urinary oestrone assay
Urinary oestrone concentrations were measured using the kit DetectX-Estrone-3-sulfate enzyme immunoassay (Arbor Assays, Ann Arbor, MI, USA). Urinary creatinine concentra-tions were measured using the kit Creatinine Assay (R&D Systems, Lille, France) in order to take into account urine dilution, and the oestrone to creatinine ratio was calculated (Hayet al., 2000). All samples were measured in duplicates in the same assay. The intra-assay CV were 1.8% for creati-nine assay and 7.7% for oestrone assay.
1
H-nuclear magnetic resonance analysis of urine and saliva samples
Before 1H-NMR analysis, urine and saliva samples were thawed and 150µl were added to 100 µl of 0.2 M potassium phosphate buffer in deuterium oxide (D2O) 99%. EightµL of
3-trimethylsilylpropionic acid (0.05 wt% in D2O) were added
to samples as an internal reference. The diluted samples were then briefly vortexed and centrifuged at 4000 × g for 15 min at 4°C to remove any insoluble components. The supernatants were transferred to conventional 3-mm NMR tubes (CortecNet, Paris, France) for NMR analysis.
The 1H-NMR spectra were obtained with a Bruker DRX-600 AVANCE-III HD spectrometer (Bruker SADIS, Wissembourg, France), operating at 14 T, with a TCI cryop-robe (Bruker SADIS). Nuclear magnetic resonance measure-ments were performed at 298 K. Standard1H-NMR spectra were acquired using a ‘noesypr1d’ pulse sequence with a relaxation delay of 20 s. Water suppression was achieved by presaturation during the relaxation delay and mixing time.
1H spectra were collected with 64 scans (and eight dummy
scans), in 32k data points with a spectral width of 7500 Hz. Sample shimming was performed automatically. Spectra were processed using Topspin version 3.2 software (Bruker Daltonik, Karlsruhe, Germany). The free induction decay were zero-filled to 64k data points, which provided sufficient data points for each resonance, and a line broadening factor of 0.2 Hz was applied before Fourier transformation.
1
H-nuclear magnetic resonance spectra post-processing
After manual correction of phase distortion and baseline on all spectra, 1H-NMR spectra were automatically reduced to ASCII files using the AMIX Software package (Analysis of MIXture, version 3.9.14 Bruker Biospin, Karlsruhe, Germany). The regions containing water signal were removed from each
1H-NMR spectrum to eliminate the baseline effects of
imperfect water saturation. Spectral intensities were scaled to the total spectral intensity, and reduced to equidistant integrated regions of 0.001 to 0.03 ppm over the chemical shift range of 0.7 to 9.5 ppm. The resulting data table was analyzed by multivariate and univariate statistical analyses.
1H-nuclear magnetic resonance spectra were assigned using
spectra online databases, including HMDB (http://www. hmdb.ca) and ChenomX NMR Suite 8.1 evaluation edition (ChenomX Inc., Edmonton, Canada).
Multivariate analyses
The data from the different weeks and females were analyzed by multivariate statistical data analysis. Using SIMCA-P+ Software (version 13.0; Umetrics, Umeå, Sweden) the data were analyzed using principal component analysis (PCA), an unsupervised method allowing the visualization of simila-rities or differences in the data sets (urine or saliva) without anya prioriknowledge of sample classes. Yet an orthogonal partial least squares discriminant analysis (OPLS-DA) as a supervised classification was performed using SIMCA-P+
aw in ut aw in ut bl aw in ut (a) (b) (c)
Figure 1 Photographs showing the development of the porcine uterus followed by ultrasonography before (a, b) and after puberty (c) occurred. aw= abdominal wall; ut = uterus; in = intestinal loop; bl = bladder. Bars represent 1 cm.
Software (version 13.0) on the two data sets: saliva and urine. All data were scaled to unit variance, to maximize the separation between the weeks. Orthogonal partial least squares discriminant analysis is a regression model that reflects the correlation between multivariate data (spectral bins) and dependent variables with class information (weeks), thereby minimizing any effects of non-relevant metabolite variability. Orthogonal partial least squares dis-criminant analysis takes advantage of class information to attempt to maximize the separation between groups of observations. Discriminant spectral regions called variable importance in projection (VIP) were obtained from the OPLS-DA model VIP values>1 were considered as responsible for the differences between groups. The overall quality of the models was judged by cumulative R2 defined as the pro-portion of variance in the data explained by the model and cumulative Q2, the class prediction ability of the model
obtained by cross-validation default method of SIMCA-P+ Software. Even still,Q2has no standard of comparison or critical value for inferring significance, an empirically inferred valueQ2> 0.40 is acceptable for a biological model (Worley
and Powers, 2013). Cross-validation ANOVA (CV-ANOVA) was applied to assess the reliability of the OPLS-DA model.
Univariate analyses of concentrations between weeks
The comparison of the urinary estrone-to-creatinine ratio between weeks was performed by the non-parametric per-mutation test using R software (https://www.r-project.org/). For each metabolite, the comparison of concentrations between weeks was performed by the non-parametric per-mutation test using R software.
Results
Uterine tract development and choice of salivary and urinary samples
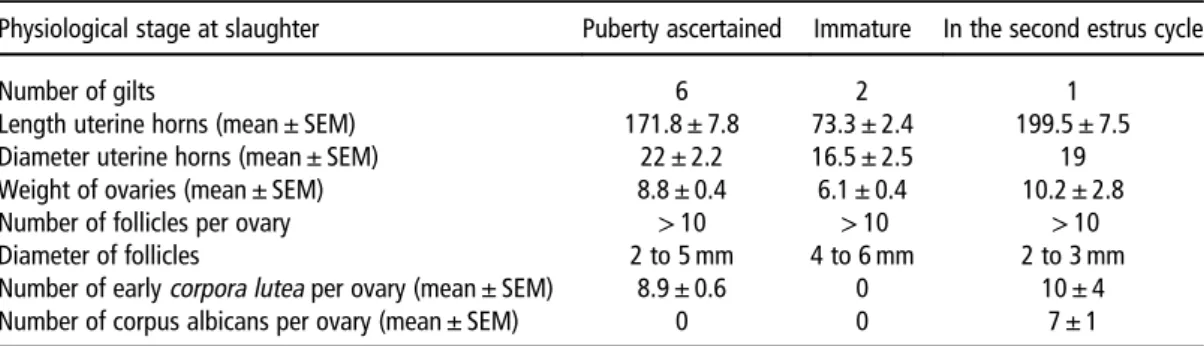
In total, six gilts presentedfirst pubertal ultrasonic images of the uterus and ovary at 182, 189, 190, 190, 191 and 192 days (Figure 1). At slaughter, puberty was ascertained with the presence of early CL and well-developed uterine horns (Table 1). Two other gilts presented ultrasonic images that seemed characteristics of cyclic females, but at
slaughter, they were detected immature as no CL were observed, and uterine horns were not developed (Table 1). They came from different litters. One gilt presented ultrasonic images characteristic of cyclic females, the presence of early CL and regressed CL (corpus albicans) indicated that this gilt was at least in its second estrus cycle, the onset of puberty was not detected by ultrasonography (Table 1). Salivary and urinary samples from these three last gilts, whose onset of puberty was not detected, were not analyzed. Samples from the six gilts whose onset of puberty was detected at 182 to 192 days were analyzed.
Sample collection was performed from 144 to 147 days of age until puberty detection. Salivary samples were obtained at each collection attempt, 550µl to 2.25 ml were collected. Urinary samples were obtained at one of the two collection attempts due to group housing; large volumes were collected.
The day of puberty detection (day 0) was defined as the 1st
day when ultrasonographic images characteristics of cyclic females were observed. The period from 144 to 147 days of age to the day of puberty detection was divided into 5 weeks named week −1 (the week just before the day of puberty detection), week−2, week −3, week −4 and week −5 (the 1stweek of sampling starting at 144 to 147 days of age). For each week, one of the three collected samples was chosen for analyses, so that both urinary and saliva were available on the same day. For each gilt, six salivary and urinary samples were analyzed: one from each week, from week−5 to week−1, and the salivary and urinary sample collected on the day of puberty detection (day 0). The mean age of the gilts ( ± SEM) on the day of urinary and saliva sampling was 154 days ( ± 0.9) for week−5, 163 days ( ± 0.5) for week −4, 170 days ( ± 0.5) for week−3, 178 days ( ± 0.5) for week −2, 186 days ( ± 1.4) for week−1 and 189 days ( ± 1.5) for the day of puberty detection.
Urinary oestrone assay
Urinary oestrone and creatinine concentrations were mea-sured in six urinary samples (one per week until puberty detection) from six gilts. Mean oestrone concentrations ± SEM were 12.9 ± 2.5 (week −5), 10.4 ± 2.7 (week −4), 13.4 ± 4.1 (week −3), 12.7 ± 2.3 (week −2), 62.5 ± 31.1 (week −1) and 121.3 ± 63.1 ng/ml the day of puberty Table 1Analysis of genital tractus of gilts after slaughter
Physiological stage at slaughter Puberty ascertained Immature In the second estrus cycle
Number of gilts 6 2 1
Length uterine horns (mean ± SEM) 171.8 ± 7.8 73.3 ± 2.4 199.5 ± 7.5 Diameter uterine horns (mean ± SEM) 22 ± 2.2 16.5 ± 2.5 19 Weight of ovaries (mean ± SEM) 8.8 ± 0.4 6.1 ± 0.4 10.2 ± 2.8 Number of follicles per ovary > 10 > 10 > 10 Diameter of follicles 2 to 5 mm 4 to 6 mm 2 to 3 mm Number of earlycorpora lutea per ovary (mean ± SEM) 8.9 ± 0.6 0 10 ± 4 Number of corpus albicans per ovary (mean ± SEM) 0 0 7 ± 1
For each tractus, both uterine horns for length and the right horn for diameter were measured; both ovaries were weighted and analyzed for follicles, corpora lutea and corpus albicans.
detection (day 0). In order to take into account urine dilution, urinary oestrone concentration was corrected by calculating the ratio to urinary creatinine concentration for each sample. The pattern of variation of this ratio is shown in Figure 2. Urinary oestrone to creatinine ratio was low from week−5 to week −2 and increased significantly (P< 0.05) from week −2 to the day
of puberty detection. The period with increasing oestrone levels has been considered as the‘waiting period.’
Urinary metabolome analysis
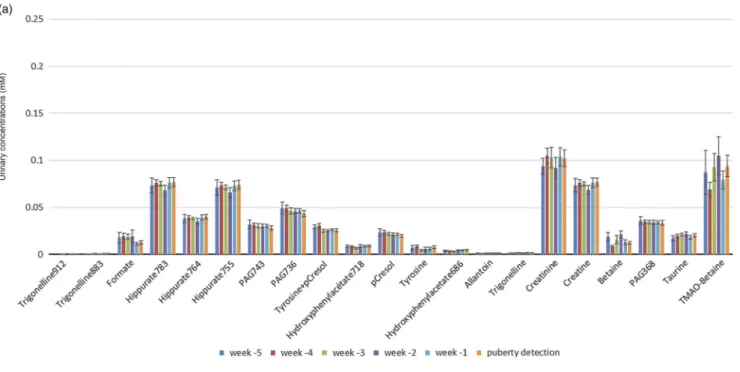
Representative1H-NMR spectra of the urine sample is shown in Supplementary Figure S1. Urine metabolome analysis identified 78 spectral bins. Among those, 42 metabolites were identified, including organic acids (formate, hippurate, citrate, pyruvate, acetate, isobutyrate and lactate), amino acids (tyrosine, alanine and glycine), alkaloids (trigonelline), organic compounds (allantoin, betaine, creatine, creatinine, para-cresol, taurine, methylguanidine, methylamine and acetone). Figure 3 shows the concentrations of each identified metabolite from week −5 to the day of puberty detection.
In order to compare the metabolomic profiles between the 5 weeks before puberty, PCA analysis was done on the 78 spectral bins. The multivariate analysis did not differentiate between the 5 weeks, lacking to show any clustering according to the week. The lack of discrimination between groups could indicate that the major source of variation in the data was not related to the puberty attainment. To improve the separation, a PLS-DA was applied to find potential biomarkers of the waiting period based on the1 H-NMR profile. This supervised analysis done on the 5 weeks did not show any clustering either. No statistical model was found to describe the modifications of the metabolite con-centrations between the 5 weeks.
We then used OPLS-DA to look for discriminant metabo-lites between weeks. Supplementary Table S1 summarizes the predictive abilities of the different OPLS-DA models obtained by comparing weeks. Based on the predictive abilities of the different OPLS-DA models, the major differ-ences in the NMR metabolic profiles were found between week−5v. week−3 and between week −4v. week−2. The
score scatter plots of the OPLS-DA models showed good separation between week−5 and week −3 (Figure 4a) and between week−4 and week −2 (Figure 4b). The discriminant metabolites determined by the OPLS-DA model, their VIP, the week−3 and week −5 fold change and Wilcoxon rank-sum testP-values are listed in Supplementary Table S2. The spectral bins Und-1.61 and Und-1.57 are under identification, Und-0.93 could putatively be 2-hydroxybutyrate and/or 2-hydro-xyisovalerate, Und-3.36 could putatively be methanol+ another unknown compound. Supplementary Table S2 shows that when comparing week−5v. week−3, over 12 spectral regions with VIP ⩾ 1 only eight of them were significantly different (P< 0.05). When comparing week −4 v. week−2, over 11 spectral regions with VIP⩾ 1 only seven of unknown metabolites and Tyrosine+ pCresol were significantly different (P< 0.05).
Thus, the global analysis of the data using PCA and OPLS-DA showed differences in the NMR metabolic profile but did not allow to identify significant modifications in the weeks before puberty.
A time-related analysis was then performed for each metabolite, in order to compare their concentrations during the 5 weeks before puberty. Among the 78 spectral bins, seven compounds showed significant variations of their concentrations between weeks (Figure 5). However, no significant variations were detected within the weeks before puberty, at the beginning of the ‘waiting period,’ which could highlight any potential biomarker of this per-iod, as attested by poor OPLS-DA model qualities (Supple-mentary Table S1). As no potential biomarkers was identified, we did not go further into the identification of these compounds.
Saliva metabolome analysis
Representative1H-NMR spectrum of saliva sample is shown in the Supplementary Figure S2. Saliva metabolome analysis allowed the identification of 59 spectral bins. Among them, 23 metabolites were detected, and 17 were identified, including organic acids (formate, fumarate, malonate, succinate, pyr-uvate, acetate, butyrate, lactate and propionate), organic compounds (sucrose, betaine, choline, creatine and creatinine), amino acids (alanine) and ethanol. Figure 6 shows the con-centrations of each identified metabolite from week −5 to the day of puberty detection (day 0). Some metabolites identified in saliva were present in urine, such as formate, betaine, creatine, creatinine, pyruvate, acetate, alanine and lactate.
In order to compare the metabolomic profiles between the 5 weeks before puberty, PCA analysis was done on the 59 spectral bins from saliva. The multivariate analysis did not allow to differentiate the 5 weeks, lacking to show any clustering according to the week before puberty. To improve the separation, a PLS-DA was applied tofind potential bio-markers of the waiting period based on the1H-NMR profile. This supervised analysis performed on the 5 weeks did not show any clustering either. No statistical model was found to describe the modifications of the metabolite concentrations between the 5 weeks.
Figure 2 Average urinary oestrone to creatinine ratio for the six gilts from week−5 before puberty detection to the day of puberty detection (mean ± SEM). a,bValues with different superscripts differ significantly (P< 0.05).
We then used OPLS-DA to look for biomarker candidates between weeks. Supplementary Table S3 summarizes the predictive abilities of the different OPLS-DA models obtained by comparing weeks. The best OPLS-DA model had a pre-dictive abilityQ2(cum)= 0.75 and an overall proportion of the variation inYexplained by the modelR2Y(cum)= 0.92. The OPLS-DA model displayed a good separation between week−4 and week −1, suggesting that the ‘waiting period’ induces changes in the salivary metabolic profile before puberty. The score scatter plot (Figure 7) shows the separa-tion between week −4 and week −1. The discriminating metabolites determined by OPLS-DA model, their VIP, their
week −1 and week −4 fold change and their individual Wilcoxon rank-sum testP-values are listed in Supplementary Table S4. The spectral bins Und-4.59 and Und-0.85 are under identification, Und-5.79 is putatively uridine. Supplementary Table S4 shows that by comparing week−4v. week−1, over six spectral regions with VIP⩾ 1 only one of them, the mal-onate, was significantly different (P< 0.05).
Moreover, the quality of the OPLS-DA model comparing week −5 and week −1 was correct (Supplementary Table S3). The discriminating metabolites determined by OPLS-DA model, their VIP, their week−1 and week −5 fold change and their individual Wilcoxon rank-sum test P-values are
Figure 3 Average urinary concentrations of identified metabolites (mM) for the six gilts from week −5 before puberty detection to the day of puberty detection (mean ± SEM). PAG= phenylacetylglycine, TMAO = trimethylamine-oxyde; Dmsulfone = dimethylsulfone; Crn = creatinine; DMG = dimethylglycine; TMA= trimethylamine; DMA = dimethylamine; Cr = creatine; X = unknown.
listed in Supplementary Table S5. By comparing week−5v. week−1, over six spectral regions with VIP >1 only one of them, Und-5.79, was significantly different (P< 0.05). The
spectral bin 5.79 ppm is putatively uridine; further analysis are needed to identify it. This metabolite was one of the most discriminant in the separations between week−5 and week −1 and was still discriminant between week −4 and week −1. Propionate is of importance in the OPLS-DA model with a VIP value of 1.3 (P-value= 0.08) (Supplementary Table S5). Figure 6 shows a slight increase of propionate in week−2 that deepens in week−1. The spectral bin containing Butyrate and 2HOva-lerate is an important variable because it has a VIP of 1.09 in the separation between week−4 and week −1 and according to its VIP value (1.15), itsP-value (0.05) and its fold change (1.67) it acted significantly in the separation between week −5 and week −1. According to Figure 6, the spectral bin con-taining Butyrate and 2HOvalerate increased during the‘waiting
period.’ In the OPLS-DA comparing week −5v. week−1, for-mate is a metabolite with a VIP value>1 (Supplementary Table S5) meaning it is an important metabolite in the discrimination between these 2 weeks with a fold change ratio of 1.67. Finally, ethanol is discriminant in the separations between week−5 and week −1 and between week −4 and week −1. An individual analysis for each metabolite was then per-formed, in order to compare their concentrations during the 5 weeks before puberty. Among the 59 spectral bins, the only formate showed a significant decrease between week −3 and week−2 (P<0.05) (Figure 6). Since this period could be
considered as the beginning of the ‘waiting period’ due to the increase of urinary estrone to creatinine ratio, formate could be a potential biomarker of the pre-pubertal develop-ment, as confirmed by the OPLS-DA.
Altogether, butyrate and 2HOvalerate, 5.79 ppm (puta-tively uridine), formate, malonate and propionate in saliva
(a) (b)
Figure 4 Score scatter plot resulting from the orthogonal partial least squares discriminant analysis models on1H-nuclear magnetic resonance spectra of porcine urine : (a) week−5 in blue and week −3 in green dots, R2Y(cum)= 0.97 and Q2(cum)= 0.84, (b) week −4 in dark blue and week −2 in light blue dots,R2Y(cum)= 0.95 and Q2(cum)= 0.85.
Figure 5 Average porcine urinary concentrations of compounds (identified metabolites (mM) and unidentified compounds) with significant variations of their concentration between weeks (mean ± SEM).a,bValues with different superscripts differ significantly (univariate analysis; P < 0.05).
could be biomarker candidates to ascertain the pre-puberty period in gilt reproduction.
Discussion
Practical non-invasive tools for identification of the ‘waiting period’ in farms are necessary. Potential biomarkers of this period, such as metabolites whose concentration sig-nificantly vary at the beginning of this period, would be of great help for pig breeders. Our study was successful in performing metabolic analyses in the urine and saliva of six gilts collected over 5 weeks before the first ovulation. Nutrition, housing conditions, health and environment of the gilts remained constant during the whole experiment so that, if significant variations in the metabolic profiles were
observed, they could be related to the pubertal development of the gilts. No clear pubertal development-related variations were observed in urine. Even though based on a relatively low number of females, some promising metabolites were identified in saliva.
Our data showed that the concentration of oestrone in urine increases during pubertal development in agreement with Camous et al. (1985). However, no variation was observed between 2 to 5 weeks before the first ovulatory cycle and hence around the 6thmonth of age in our study. The increase in urinary oestrone was observed between week−2 and the day of puberty detection. From ultrasound imagery and slaughter data, it can be postulated that ovu-lation occurred shortly before day 0. Therefore, samples on day 0 were performed during the very late follicular phase or early luteal phase whereas those on week−1 were collected during the early follicular phase. The relatively high con-centration of urinary oestrone at these times is in good agreement with the plasma oestradiol increase occurring a few days before ovulation (Van de Wielet al., 1981; Prunier
et al., 1993). Thus, the‘waiting period’ as defined by Camous
et al.in gilts with a relatively late age at puberty (234 days of age in average) (Camous et al., 1985) might have been of very short duration in our study as seen in breeds with early pubertal age (Prunier et al., 1993). However, this does not exclude the existence of other signs of sexual maturation, during the last month before thefirst ovulation, that could be detected in saliva and urine.
In our study, we chose NMR spectrometry because it is a stable and repeatable approach with minimal sample pre-paration, accuracy and robustness. Nuclear magnetic reso-nance metabolomic has been mainly used to study a variety of biofluids in human, including urine (Beckonertet al., 2007)
Figure 6 Average porcine salivary concentrations of identified metabolites (mM) for the six gilts from week −5 before puberty detection to the day of puberty detection (mean ± SEM). Cr= creatine; Crn = creatinine.a,bValues with different superscripts differ significantly (univariate analysis; P < 0.05).
Figure 7 Score scatter plot resulting from the orthogonal partial least squares discriminant analysis models on1H-nuclear magnetic resonance spectra of porcine saliva: from week−4 in purple and week −1 in blue dots,R2Y(cum)= 0.92 and Q2(cum)= 0.75.
and saliva (Takeda et al., 2009; Wallner-Liebmann et al., 2016). Its use in the porcine species is recent. Nuclear mag-netic resonance characterization of fluids such as plasma, serum, urine, kidney perfusate, follicular fluid and cere-brospinal fluid has been performed in pigs as an animal model for human health (Atzoriet al., 2010; Nissenet al., 2011; He et al., 2012; Mulieret al., 2012; Bertoldoet al., 2013; Skappaket al., 2013; Nathet al., 2014; Gerardet al., 2015; Jegouet al., 2016; Ventrellaet al., 2016). However, up to now, NMR analysis of the saliva metabolome has been performed neither in the pig nor in other domestic mammals. Urine typically contains metabolic breakdown products from a wide range of foods, environmental contaminants, endogenous waste metabolites and bacterial byproducts. On the contrary, saliva is produced by the organism for a specific purpose and therefore is more homogeneous because it is subject to some degree of homeostasis, yet salivary con-stitution is not constant, and several factors, including age, nutrition, physical exercise, circadian cycles, health status, may influence its composition (de Almeida Pdelet al., 2008). As previously observed in human, comparative analysis with a urine sample from the same animal and collection time demonstrates that the metabolomics phenotype in saliva is slightly weaker than that in urine (Wallner-Liebmannet al., 2016). Indeed, in our study, NMR analysis identified 42 metabolites in porcine urine and 17 metabolites in porcine saliva. Some metabolites were identified both in saliva and urine, such as formate, betaine, creatine, creatinine, pyruvate, acetate, alanine and lactate.
Nuclear magnetic resonance analysis was performed on porcine urinary samples from 144 to 147 days of age until puberty detection at 182 to 192 days. Metabolites identified in porcine urine were similar to metabolites identified in human urine: formate, hippurate, citrate, pyruvate, acetate, isobutyrate, lactate, tyrosine, alanine, glycine, trigonelline, creatine, creatinine, taurine, methylamine, acetone, dime-thylglycine, dimethylamine and trimethylamine-oxyde (Scalabre et al., 2017; Perez-Rambla et al., 2017; Wojto-wiczet al., 2017). Urinary NMR metabolomic profiling has been performed in a newborn piglet model of hypoxia (Skappaket al., 2013; Sachseet al., 2016). Urine metabolites identified in these studies were similar to metabolites iden-tified in the older pigs from our study: formate, hippurate, phenylacetylglycine, creatinine, creatine, trimethylamine-oxide, dimethylglycine, trimethylamine, alanine, lactate, glycine, betaine and citrate. In our study, identification of these low-molecular-weight metabolites in porcine urine and measurement of their concentration did not allow to identify significant modifications at the beginning of the ‘waiting period,’ 2 weeks before puberty. The concentration of most of the metabolites remained relatively constant from 144-day-old until puberty. For some metabolites (trigonelline, pyruvate+ X, alanine, lactate, dimethylsulfone, iso-valerylglycine, glycine, tyrosine+pcresol and unidentified compounds), significant variations of the concentration between weeks were observed, but they were not related clearly to the entry into the ‘waiting period.’ As nutrition,
housing conditions, health and environment of the gilts remained constant during the whole experiment; one could hypothesize that these significant variations of metabolites concentration could be related to age and pubertal devel-opment of the gilts, as they are the only non-constant parameters. However, NMR metabolomic profiling in our study did not allow the identification of biomarkers of the pubertal development among the low-molecular-weight metabolites in porcine urine.
Nuclear magnetic resonance analysis was performed on salivary samples collected on the same animals and same days as urinary samples, from 144 to 147 days of age until puberty detection at 182 to 192 days. This is thefirst NMR metabolomic profiling performed on saliva from domestic animals. Most of the metabolites that we identified in porcine saliva were also identified in human saliva: formate, sucrose, choline, creatine, succinate, pyruvate, acetate, butyrate, alanine, lactate, ethanol, propionate and 2-hydroxyvalerate (Takeda et al., 2009; Wallner-Liebmann
et al., 2016; Figueira et al., 2017). Identification of low-molecular-weight metabolites in porcine saliva and com-parison of their concentration between weeks allowed to identify significant modifications at the beginning of the ‘waiting period,’ 2 weeks before puberty. Formate showed a significant decrease between week −3 and week −2. Thus, it could be an interesting biomarker of the sexual development. In rat granulosa cells, the aromatization of androstenedione generates oestrone and formic acid (Norton et al., 1988). Thus, formic acid production is linked to steroidogenesis in the ovary, especially to oestrone synthesis, and could be related to the increased ovarian activity in pig during pub-ertal development (Camous et al., 1985). Moreover, some discriminating metabolites were identified by OPLS-DA model. Malonate was discriminant in the separations between week−5 and week −1 and between week −4 and week−1. Malonic acid is a residual organic compound pro-duced during 17β-estradiol degradation (Wanget al., 2007; Jianget al., 2013). It is then linked to steroid production and conversion by enzymatic reactions. Thus, malonic acid could be related to sexual development, and be suggested as a biomarker candidate to ascertain the pre-puberty period in gilts. Butyrate and 2HOvalerate (both metabolites are assigned to the same 1H-NMR spectra) were also dis-criminant in the separations between week−5 and week −1 and between week −4 and week −1. Moreover, butyrate concentrations were low from week −5 to week −2 and increased between week−2 and week −1, though not sig-nificantly. Hydroxybutyrate has been detected in bovine fol-licularfluid (Leroyet al., 2004; Sanchezet al., 2014). It could then be related to follicles development and ovarian activity. Thus, butyrate could be a candidate biomarker of the pre-puberty period. The spectral bin 5.79 ppm, which is putatively uridine, is one of the most discriminant in the separations between week−5 and week −1 and between week−4 and week −1. Its concentration was low from week −5 to week −3 and high from week −2 to the day of puberty detection, that is to say during the ‘waiting period.’
Moreover, as uridine has been detected in a porcine follicular fluid, it could be related to follicles development and ovarian activity (Bertoldoet al., 2013). Thus, it could be an interesting biomarker candidate to ascertain pre-puberty period. However, further analysis is necessary tofirmly identify this spectral bin. Propionate is discriminant in the separation between week−5 and week−1 and its concentration increases between week −3 and week−1, though not significantly. It could be a potential biomarker of the ‘waiting period.’ However, no relation between propionate production and ovarian activity has been found in the literature.
In conclusion, no potential biomarker was identified in urin-ary samples, but several potential biomarkers were identified in saliva. Altogether, butyrate and 2HOvalerate, 5.79 ppm (puta-tively uridine), formate, malonate and propionate in saliva could be biomarker candidates to detect the pre-puberty period in gilt. Further studies are in process to ascertain that these biomarkers are relevant for the detection of the‘waiting period.’ Present results confirm that non-invasive salivary samples could allow the identification of the physiological status of the gilts and presumably the optimal time for application of the boar effect.
Acknowledgments
The authors would like to thank the staff of the experimental pigsty, Eric Royer and Anaïs Arnault, and the staff of the abat-toir, Jean-Philippe Dubois and Sylvain Bourgeais. This work was supported by the department‘Physiologie Animale et Systèmes d’Elevage (PHASE)’ from INRA.
Declaration of interest
The authors declare no conflict of interest. Ethics statement
All procedures on animals were conducted in accordance with the guidelines for the care and use of laboratory animals issued by the French Ministry of Agriculture and under the supervision of the ethical review committee (Comité d’Ethique en Expéri-mentation Animale Val de Loire).
Software and data repository resources
None of the data were deposited in an official repository. Supplementary material
To view supplementary material for this article, please visit https://doi.org/10.1017/S1751731118002161
References
Atzori L, Xanthos T, Barberini L, Antonucci R, Murgia F, Lussu M, Aroni F, Varsami M, Papalois A, Lai A, D’Aloja E, Iacovidou N and Fanos V 2010. A metabolomic approach in an experimental model of hypoxia-reoxygenation in newborn piglets: urine predicts outcome. Journal of Maternal-Fetal and Neo-natal Medicine 23 (suppl. 3), 134–137.
Beckonert O, Keun HC, Ebbels TM, Bundy J, Holmes E, Lindon JC and Nicholson JK 2007. Metabolic profiling, metabolomic and metabonomic procedures for NMR spectroscopy of urine, plasma, serum and tissue extracts. Nature Protocols 2, 2692–2703.
Bertoldo MJ, Nadal-Desbarats L, Gerard N, Dubois A, Holyoake PK and Grupen CG 2013. Differences in the metabolomic signatures of porcine follicularfluid collected from environments associated with good and poor oocyte quality. Reproduction 146, 221–231.
Bown P 2006. Advantages and disadvantages of batch farrowing. In Practice 28, 94–96.
Brooks PH and Cole DJ 1970. The effect of the presence of a boar on the attainment of puberty in gilts. Journal of Reproduction and Fertility 23, 435–440.
Camous S, Prunier A and Pelletier J 1985. Plasma prolactin, LH, FSH and estrogen excretion patterns in gilts during sexual development. Journal of Ani-mal Science 60, 1308–1317.
de Almeida Pdel V, Gregio AM, Machado MA, de Lima AA and Azevedo LR 2008. Saliva composition and functions: a comprehensive review. Journal of Con-temporary Dental Practice 9, 72–80.
Figueira J, Gouveia-Figueira S, Ohman C, Lif Holgerson P, Nording ML and Ohman A 2017. Metabolite quantification by NMR and LC-MS/MS reveals dif-ferences between unstimulated, stimulated, and pure parotid saliva. Journal of Pharmaceutical and Biomedical Analysis 140, 295–300.
Gerard N, Fahiminiya S, Grupen CG and Nadal-Desbarats L 2015. Reproductive physiology and ovarian folliculogenesis examined via 1H-NMR metabolomics signatures: a comparative study of large and small follicles in three mammalian species (Bos taurus,Sus scrofa domesticusandEquus ferus caballus). OMICS 19, 31–40.
Goudet G, Lière P, Douet C, Savoie J, Staub C, Venturi E, Ferchaud S, Maupertuis F, Roinsard A, Boulot S and Prunier A 2017. Evaluation of steroid concentrations in the saliva of pre-pubertal gilts for the identification of biomarkers of the pubertal stage of maturity. Reproduction in Domestic Animals 52, 59. Hay M, Meunier-Salaun MC, Brulaud F, Monnier M and Mormede P 2000. Assessment of hypothalamic-pituitary-adrenal axis and sympathetic nervous system activity in pregnant sows through the measurement of glucocorticoids and catecholamines in urine. Journal of Animal Science 78, 420–428. He Q, Ren P, Kong X, Wu Y, Wu G, Li P, Hao F, Tang H, Blachier F and Yin Y 2012. Comparison of serum metabolite compositions between obese and lean growing pigs using an NMR-based metabonomic approach. Journal of Nutritional Bio-chemistry 23, 133–139.
Hughes PE 1994. The influence of boar libido on the efficacy of the boar effect. Animal Reproduction Science 35, 111–118.
Hughes PE, Pearce GP and Paterson AM 1990. Mechanisms mediating the sti-mulatory effects of the boar on gilt reproduction. Journal of Reproduction and Fertility Supplement 40, 323–341.
Jegou M, Gondret F, Lalande-Martin J, Tea I, Baeza E and Louveau I 2016. NMR-based metabolomics highlights differences in plasma metabolites in pigs exhi-biting diet-induced differences in adiposity. European Journal of Nutrition 55, 1189–1199.
Jiang L, Zhang L, Chen J and Ji H 2013. Degradation of 17beta-estradiol in aqueous solution by ozonation in the presence of manganese(II) and oxalic acid. Environmental Technology 34, 131–138.
Kingsbury DL and Rawlings NC 1993. Effect of exposure to a boar on circulating concentrations of LH, FSH, cortisol and oestradiol in prepubertal gilts. Journal of Reproduction and Fertility 98, 245–250.
Kirkwood RN and Hughes PE 1979. The influence of age at first boar contact on puberty attainment in the gilt. Animal Production 29, 231–238.
Kraeling RR and Webel SK 2015. Current strategies for reproductive manage-ment of gilts and sows in North America. Journal of Animal Science and Bio-technology 6, 3.
Leroy JL, Vanholder T, Delanghe JR, Opsomer G, Van Soom A, Bols PE, Dewulf J and de Kruif A 2004. Metabolic changes in follicularfluid of the dominant follicle in high-yielding dairy cows early post partum. Theriogenology 62, 1131–1143. Lindon JC, Holmes E, Bollard ME, Stanley EG and Nicholson JK 2004. Metabo-nomics technologies and their applications in physiological monitoring, drug safety assessment and disease diagnosis. Biomarkers 9, 1–31.
Lindon JC, Holmes E and Nicholson JK 2006. Metabonomics techniques and applications to pharmaceutical research & development. Pharmaceutical Research 23, 1075–1088.
Lindon JC, Holmes E and Nicholson JK 2007. Metabonomics in pharmaceutical R&D. FEBS Journal 274, 1140–1151.
Mulier KE, Lexcen DR, Luzcek E, Greenberg JJ and Beilman GJ 2012. Treatment with beta-hydroxybutyrate and melatonin is associated with improved survival in a porcine model of hemorrhagic shock. Resuscitation 83, 253–258. Nath J, Guy A, Smith TB, Cobbold M, Inston NG, Hodson J, Tennant DA, Ludwig C and Ready AR 2014. Metabolomic perfusate analysis during kidney machine perfusion: the pig provides an appropriate model for human studies. PLoS One 9, e114818.
Nissen PM, Nebel C, Oksbjerg N and Bertram HC 2011. Metabolomics reveals rela-tionship between plasma inositols and birth weight: possible markers for fetal pro-gramming of type 2 diabetes. Journal of Biomedicine & Biotechnology 2011, 378268. Norton BI, Miyairi S and Fishman J 1988. 19-Hydroxylation of androgens by rat granulosa cells. Endocrinology 122, 1047–1052.
Prunier A, Chopineau M, Mounier AM and Mormede P 1993. Patterns of plasma LH, FSH, oestradiol and corticosteroids from birth to thefirst oestrous cycle in Meishan gilts. Journal of Reproduction and Fertility 98, 313–319.
Sachse D, Solevag AL, Berg JP and Nakstad B 2016. The role of plasma and urine metabolomics in identifying new biomarkers in severe newborn asphyxia: a study of asphyxiated newborn pigs following cardiopulmonary resuscitation. PLoS One 11, e0161123.
Sanchez R, Schuermann Y, Gagnon-Duval L, Baldassarre H, Murphy BD, Gevry N, Agellon LB, Bordignon V and Duggavathi R 2014. Differential abundance of IGF1, bile acids, and the genes involved in their signaling in the dominant follicle micro-environment of lactating cows and nulliparous heifers. Theriogenology 81, 771–779. Skappak C, Regush S, Cheung PY and Adamko DJ 2013. Identifying hypoxia in a newborn piglet model using urinary NMR metabolomic profiling. PLoS One 8, e65035.
Takeda I, Stretch C, Barnaby P, Bhatnager K, Rankin K, Fu H, Weljie A, Jha N and Slupsky C 2009. Understanding the human salivary metabolome. NMR in Biomedicine 22, 577–584.
Van de Wiel DF, Erkens J, Koops W, Vos E and Van Landeghem AA 1981. Periestrous and midluteal time courses of circulating LH, FSH, prolactin, estradiol-17 beta and progesterone in the domestic pig. Biology of Reproduction 24, 223–233.
Ventrella D, Laghi L, Barone F, Elmi A, Romagnoli N and Bacci ML 2016. Age-related 1H NMR characterization of cerebrospinalfluid in newborn and young healthy piglets. PLoS One 11, e0157623.
Wallner-Liebmann S, Tenori L, Mazzoleni A, Dieber-Rotheneder M, Konrad M, Hofmann P, Luchinat C, Turano P and Zatloukal K 2016. Individual human metabolic phenotype analyzed by (1)H NMR of saliva samples. Journal of Pro-teome Research 15, 1787–1793.
Wang L, Zhang F, Liu R, Zhang TY, Xue X, Xu Q and Liang X 2007. FeCl3/NaNO2: an efficient photocatalyst for the degradation of aquatic steroid estrogens under natural light irradiation. Environmental Science & Technology 41, 3747–3751.