HAL Id: hal-01263845
https://hal.archives-ouvertes.fr/hal-01263845
Submitted on 10 Feb 2016
HAL is a multi-disciplinary open access
archive for the deposit and dissemination of
sci-entific research documents, whether they are
pub-lished or not. The documents may come from
teaching and research institutions in France or
abroad, or from public or private research centers.
L’archive ouverte pluridisciplinaire HAL, est
destinée au dépôt et à la diffusion de documents
scientifiques de niveau recherche, publiés ou non,
émanant des établissements d’enseignement et de
recherche français ou étrangers, des laboratoires
publics ou privés.
Monitoring by in situ neutron diffraction of
simultaneous dehydration and Ni2+ mobility in partially
exchanged NaY zeolites
Florence Porcher, Jean-Louis Paillaud, Lucia Gaberova, Gilles André, Sandra
Casale, Pascale Massiani
To cite this version:
Florence Porcher, Jean-Louis Paillaud, Lucia Gaberova, Gilles André, Sandra Casale, et al..
Mon-itoring by in situ neutron diffraction of simultaneous dehydration and Ni2+ mobility in partially
exchanged NaY zeolites . New Journal of Chemistry, Royal Society of Chemistry, 2016, 40,
pp.4228-4235 �10.1039/c5nj02918j�. �hal-01263845�
NJC
PAPER
J. Name., 2013, 00, 1-3 | 1a.
Laboratoire Léon Brillouin (LLB), UMR 12 CNRS-CEA, 91191 Gif-sur-Yvette Cédex, France.
b.Université de Lorraine, UMR 7036 CNRS, CRM2, Faculté des Sciences et
Technologies, BP 70239, Boulevard des Aiguillettes, 54506 Vandoeuvre-lès-Nancy, France.
c.
Equipe Matériaux à Porosité Contrôlée (MPC), Institut de Science des Matériaux de Mulhouse (IS2M), UMR CNRS 7361, Université Haute-Alsace, 3bis rue Alfred Werner, 68093 Mulhouse Cedex, France
d.Sorbonne Université - Université Paris 06 UPMC, Laboratoire de Réactivité de Surface (LRS), 4 place jussieu, 75005 Paris cédex, France
e.CNRS UMR 7197, LRS - UPMC, 4 place jussieu, 75005 Paris cédex, France. E-mail:
pascale.massiai@upmc.fr
† Electronic supplementary information (ESI) available: 4 CIF files. Further details of the crystal structure investigation can be also obtained from the
Fachinformationszentrum Karlsruhe, 76344 Eggenstein-Leopoldshafen, Germany, (fax: +49 7247 808 666; e-mail: crystaldata@fiz-karlsruhe.de) on quoting the depository numbers CSD-430696, CSD-430697, CSD-430698 and CSD-430699. f. CSD-427372.
Monitoring by in situ neutron diffraction of simultaneous
dehydration and Ni
2+mobility in partially exchanged NaY zeolite†
Florence Porcher,a,b Jean-Louis Paillaud,c Lucia Gaberova,d Gilles André,a Sandra Casale,d,e Pascale Massianid,e*
Powder neutron diffraction is used to follow structural changes occurring during heat and vacuum assisted dehydration of 3wt% nickel exchanged NaY. The structures determined from Rietveld refinement confirm the nickel ions displacement from the supercages and sodalite cages towards hexagonal prisms upon water removal. Not only this mobility but also its relationship with dehydration level is demonstrated, owing to real time quantification of dehydration through changes of the intensity of the incoherent neutron scattering signal. Comparison with TGA data proves that this signal is fully attributable to water molecules adsorbed in the zeolite. STEM/EDX and in situ heating TEM studies provide complementary information on homogeneous Ni distribution (initial state) and on reductive sintering in vacuum at high temperature.
1. Introduction
In the large family of aluminosilicates, zeolites have unique behaviours provided by their peculiar structural and chemical
properties. Their structures consist of crystalline TO2
frameworks constituted of tetrahedral T (Si or Al) atoms bridged by oxygen atoms, in such way as to delimit organized networks of pores with high surface area and diameters (often between 5 and 10 Å) close to those of many molecules. These steric features are the keystone of the well-know applications
of zeolites as molecular sieves or adsorbents1 as well as in
fields such as selective gas separation2 or shape selective
catalysis.3
The other specificity of zeolites lies in the tetrahedral
aluminum atoms inserted as trivalent Al3+ in their TO2 network
that generate framework negative charges (one per framework Al atom). For the sake of neutrality, these charges are neutralized by charge compensating cations (alkali, protons, metal ions...) located in their proximity, in the pores. Global chemical formula of zeolites may be written as
Ax a+ By b+ Cz c+
...(H2O)m[Si1-nAlnO2], where x+ y + z (etc.) = n and A,
B, C (etc.) are compensating cations of distinct natures with respective valences a, b, c (etc.).
The easy exchange of these cations by others, especially in solution, makes zeolites highly performing as cationic exchangers, for instance in laundry or water purification domains. This cationic exchange propensity also allows the easy tuning of their chemical composition, as often required in heterogeneous catalysis when dispersion of metal active sites
(cations or nanoparticles) on porous supports is targeted.4,5 In
such case, not only the metal content but also the metal location, the metal-framework interactions or the distribution between co-cations, if present, can play a determining role. Understanding these features therefore often represent a prerequisite for good control of material properties. This has prompted the numerous studies on cationic sites identification
in zeolites since the pioneering works of Breck and Flanigen6
and of Barrer7 on synthetic zeolites. The propensity of cations
to move from one site to another eventually positioned far away upon adsorption of a molecule (water, reactants...) has
been also well demonstrated8 and widely studied, notably in
the case of transition metal exchanged zeolites for DeNOx
catalysis.9-11
Amongst works dedicated to the description of cations in zeolites, many have been focussed on faujasite with structural
topology FAU12 that is one of the most studied zeolites. As
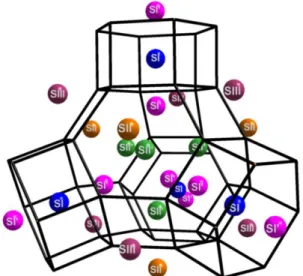
reviewed in the late 90's13 and schematized on Fig. 1, five main
types of cationic sites (called I, I’, II, II’ and III) were defined in this structure to facilitate the comparison of alkali distributions in samples with various cations and different hydration
states.14 These sites are also currently considered for transition
metal cations, even if small local shifts often need to be taken
into account, particularly for multivalent ions such as Ni2+
ARTICLE Journal Name
2 | J. Name., 2012, 00, 1-3
Fig. 1: Schematic representation of the cubic faujasite (FAU) structure with location of cationic sites I, I’, II, II' and III. Site I is located at the centre of the hexagonal prism, I’ and II’ inside the sodalite cage and II and III in the supercage. For reasons of clarity, framework oxygen atoms have been omitted.
In recent works, theoretical ab initio (DFT) calculations were often used to get precise description of the sites and of the
interactions of cations with the framework.11,15 Nevertheless,
for computing capacity reasons, the models have to be restricted to small clusters representing only a small portion of the zeolite unit cell. Consequently, they are not adapted to the study of cations displacements between sites eventually positioned far away from each other. Monte Carlo approaches
(less precise but considering a larger zone) can then help,and
be adapted to systems containing heavy elements (e.g. metal ions) as well, especially in presence of a restricted number of water molecules, provided that appropriate force fields have
been previously established.17,18 Therefore, description of the
cation mobility still relies greatly on experiments.
Considering the peculiar case of Ni2+, the first attempt to
locate it in Ni-NaFAU was done by XRD in the 70's.19 The effect
of temperature was next analysed by various techniques
including XRD,20 EPR21 or XAS.22 From these works, it is
commonly admitted that in the hydrated sample nickel is located at site II, inside the supercage that is big enough (pore
diameters of the order of 13 Å)12 to accommodate the water
hexa-coordinated Ni2+ cluster; above 573 K (dehydrated state),
Ni2+ tends on the contrary to move to sites I (centre of the
hexagonal prism or d6r) where it can optimize its coordination
by interacting with the framework oxygen atoms.15,23,24
Nevertheless, none of above cited techniques allows following "in real time" the dehydration process. Especially, with XRD, water content is estimated only after structural refinement and a very crude knowledge on water content is usually obtained: most often, one has then to perform additional ex
situ additional experiments (such as TG), which is not best
suited for establishing properly a correlation between two processes (presently water removal and structural changes).
Moreover, a drawback of XRD for the study of limited Ni2+
amounts in zeolites is the low contrast for this element
compared to Na+ that lie on the same sites. Besides,
techniques such as XAS or EPR give an average picture without discriminating between sites positions.
In addition to above techniques, neutron diffraction has been also widely used to characterize zeolite structures and cationic sites occupancies. Commonly, the works are carried out after
careful sample dehydration25-32 or after deuteration33-39 in
order to avoid the known neutron scattering by hydrogen that decreases data quality and renders interpretations more complex. Nevertheless, we will show in the present contribution that this effect, in place of being a drawback, can on the contrary be very fruitfully exploited to characterise simultaneously water removal and nickel mobility in zeolites. Neutron diffraction is moreover highly sensitive to nickel,
which exhibits a large scattering length of 10.3 fm40, which
makes it particularly appropriate for the study of Ni containing zeolites.
To conduct the work, we selected a partially nickel-exchanged NaY (FAU structure, Si/Al=2.3) for two main reasons. Firstly, the well-established knowledge on cationic sites positions in
FAU13,14 can significantly help identifying Ni2+ displacements
upon dehydration. Secondly, the FAU structure contains three distinct types of cages (supercages, sodalites and hexagonal prisms) that facilitate the experimental observation of mobility from one cage to another. We therefore applied this technique to monitor in situ and "in real time" conditions the water removal occurring together with structural evolutions along evacuated heating treatment. The nickel amount in the sample was kept low (≈3 wt %) to ensure that its atomic content is below the number of available hexagonal prisms.
2. Experimental
2.1 Sample preparationThe parent NaY sample was a synthetic Linde SK-40 zeolite from Union Carbide Corporation with framework Si/Al ratio of 2.3. This sample was exchanged with Ni by classical exchange method in solution. The latter consisted in stirring at room temperature for 24 h a suspension made of 100 mL of 4 mM
Ni(NO3)2 aqueous solution (containing ≅ 23 mg Ni) and of 1 g
of parent hydrated zeolite (i.e. > 720 mg of dehydrated zeolite, see TGA data below). The sample was washed three times in distilled water, recovered by centrifugation (green powder) and dried overnight at 350 K in a static oven (pink powder). It was finally let to fully rehydrate at room temperature and atmosphere for one month before analysis. Note that a rapid
colour change from pink to green (both typical of Ni2+, bare
and hydrated respectively) attested easy rehydration.
2.2 Neutron Diffraction
The neutron powder diffraction patterns were recorded on the high-flux, cold neutrons powder diffractometer G4-1 and on the high resolution, thermal neutron powder diffractometer 3T2 of the LLB-Orphée facility at CEA/Saclay (for partially-hydrated/dehydrated and hydrated samples, respectively). G4-1 is equipped with a vertically focusing 200 pyrolytic graphite monochromator (nominal wavelength of 2.4226 Å) and a
800-Journal Name ARTICLE
J. Name., 2013, 00, 1-3 | 3
cells multi-detector covering a 80° range in 2θ (Δθ = 0.1° between 2 cells). An evacuated heating chamber allowed registering the evolution of the diffractograms versus temperature (range 293-873 K). To this end, the sample (about 300 mg) was placed in an open vanadium sample holder in a
furnace under vacuum (P~10-5 mbar). A first diffraction pattern
was recorded at room temperature (RT) not longer after pumping was started (hydrated sample) then temperature was progressively increased while continuously recording the
pattern (2 between 8 and 88°, 15 min per scan). Finally, the
sample was cooled down to room temperature and a last pattern was taken (dehydrated sample). The hydrated (evacuated) sample was also analysed on the 3T2 diffractometer whose larger resolution range allows ful refinement of the structural parameters (atomic positions, occupancies, displacement parameters) while G4.1 is focused on fast data acquisition and thermodiffractometry. Rietveld
refinements41 were performed with the FullProf Suite.42
2.3 Complementary techniques
Chemical composition was obtained from elemental analysis measured by dispersive X-ray fluorescence spectroscopy using a PHILIPS MagiX apparatus. Thermogravimetric analysis (TGA) was carried out on a STD Q600 thermobalance (TA Instrument) using 20 mg of zeolite powder. After 15 min stabilisation at
room temperature in flowing air (20 mL.min-1), the weight loss
was followed while regularly increasing the temperature up to
873 K (7 K.min-1). Electron microscopy studies were performed
on a LaB6 transmission electron microscope JEOL JEM2010 operating at 200kV. STEM EDX mappings were acquired to visualise the Ni dispersion in the zeolite support and X-Ray characteristics of the following elements were recorded: K-O, K-Al, K-Si, K-Na and K-Ni (PGT detector). Other TEM experiments were made using a single tilt "Heating sample Holder” (EM-SHH4, Gatan) that allowed in situ heating of the sample up to 873 K while simultaneously observing selected zones. The micrographs were registered on an ORIUS Gatan Camera. In both modes, the sample powder was suspended in hexane (for better dispersion) before observation then deposited on a 3 mm grid of copper (STEM EDX observations) or Mo (heating experiments) covered with an ultrathin carbon membrane of around 10 nm thickness.
3. Results and discussion
3.1 Homogeneous Ni dispersion in the hydrated sample
The unit cell composition of the as-prepared hydrated exchanged
zeolite was (Ni2+)7(Na+)31(H+)13[Al58Si134 O384](H2O)270 (where H2O is
present as adsorbed molecule in the pores). In reference to its
unit cell Ni atomic content, the sample will be hereafter
named Ni7NaY. This composition confirms firstly that part of
the sodium cations (58 Na per unit cell in the parent zeolite) were exchanged by nickel ones, as expected after treatment in the nickel nitrate solution. Secondly, the atomic nickel content (about 7 Ni per unit cell) corresponds to c.a. 3.1 wt% Ni (with respect to the dehydrated sample), only slightly below the
nickel content in the exchange suspension. This illustrates the
propensity of Ni2+ ions to replace Na+ ones in zeolites. Thirdly,
the atomic content per unit cell (7 Ni2+ and 31 Na+) is slightly
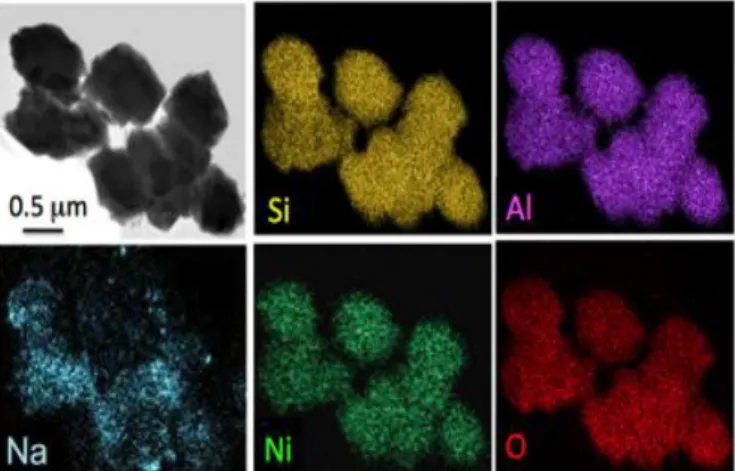
lower than expected for charge neutrality, suggesting presence of some protons, possibly introduced as well by exchange process, in line with the slightly acidic pH of the suspension (around 5). Fourthly, the number of nickel atoms per unit cell (7) is about half that of double prisms per unit cell (16), which ensures that all nickel ions have the possibility to move upon dehydration to confined sites I (expected preferred location). Before diffraction studies, combined STEM and EDX mappings were performed to check the good nickel distribution all over the sample. Representative images are shown in Fig. 2. On the
STEM picture (image on top left), Ni7NaY crystals appear as
truncated octahedra about 1 μm in size. STEM-EDX mappings on the same zone reveal a highly homogenous distribution of all elements (Si, Al, Na, Ni, O), including nickel (in green). For sodium, however, initial low brightness was obtained (due to combination of the rather low molecular weight of this element, making it less sensitive, and to its content) and contrast had therefore to be reinforced, explaining the lower quality of the image. Nevertheless, it is confirmed that nickel exchange took place and led to a very good nickel repartition in all zeolite grains.
Fig. 2. STEM image of the exchanged Ni7NaY sample and silicon (yellow), aluminum
(purple), sodium (blue), nickel (green), and oxygen (red) EDX mappings.
3.2 Quantification of dehydration from Neutron Diffraction patterns
The structural evolution of the Ni7NaY sample during heating
in vacuum up to 873 K was next studied by powder neutron diffraction. The diffractograms recorded along treatment in
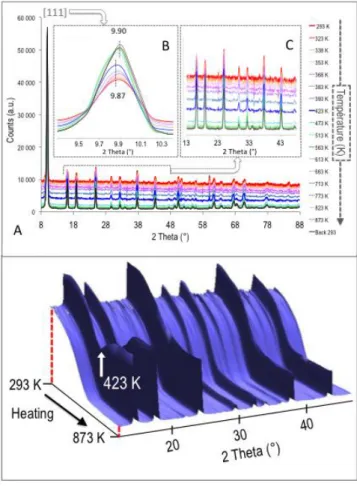
the 8< 2 < 88° range are shown in Fig. 3A. Whatever the
temperature, the diffraction patterns are typical of the FAU structure, without additional peak detected, attesting of the crystalline purity of the sample.
As classically observed for zeolites, changes in peak intensities versus temperature were also noted. This is illustrated in Fig.
3B for the most intense Bragg peak, 111.43 The evolution of
intensity for this peak is also quantified in Fig. 4a. The slight shift towards larger angles when temperature increases, also visible on Figure 3B and similarly present (not shown) for other peaks, reveals the well known negative thermal expansion of
ARTICLE Journal Name
4 | J. Name., 2012, 00, 1-3
faujasite-type zeolite upon heating and after water removal.44
More interestingly, a regular - and simultaneous - decrease of the baseline level is seen, and this is even better visualized in Fig. 3C and in the 3D waterfall plot representation shown in
Fig. 3D (restricted to the 2 range between 13° and 48° for the
sake of clarity). This signal is due to the extremely large
incoherent cross section of 1H atoms45 attributable mainly to
water molecules filling the pores as proposed in our recent work
on Na58Y18 and in an earlier study on gypsum dehydration.46
To confirm the origin of the neutron scattering signal and validate its relationship with hydration level, we compared the evolution of this signal intensity versus temperature (Fig. 4b) with the weight loss plot obtained by thermo-gravimetric analysis in flowing air (Fig. 4c). Even if both plots are not perfectly superimposed (possibly due to different treatment conditions, namely in vacuum and in air, respectively), their trends are very close, confirming above attribution.
Therefore, in addition to give access to structural properties, neutron diffraction informs "in real time" on water removal, and the process can be easily quantified. In spite of the strong interest of such simultaneous observation, neutron diffraction was to our knowledge scarcely exploited as such in the past, except for the
above-cited work on kinetics of dehydration of gypsum.46
Fig. 3: Powder neutron diffraction patterns of Ni7NaY during heating from 293 to 873 K:
(A) general evolution and zooms on (B) the 111 peak and (C) background level (18-48° range); (D) waterfall plot representation between 13° and 48° highlighting the regular decrease of incoherent signal intensity (dotted red lines) and the quasi-total dehydration step at 423 K (white arrow).
Fig. 4: Evolution versus temperature (from 293K up to 773 K, then cooling back to RT)
of the (a) intensity of the 111 neutron diffraction peak (2 at c.a. around 9.9°) and (b) level of incoherent signal; (c) comparison with weight loss (red plain line) measured by TG in air flow.
From curve b in Fig. 4, it can also be seen that dehydration is rather regular between 293 K (RT) and c.a. 473 K, afterwards the process significantly slows down. Therefore, a significant amount of water (around 40%) is still present after the boiling point of liquid water (373 K) has been reached, and some molecules remain adsorbed till a temperature as high as 573 K. This confirms the strong interactions of water with the zeolite adsorbent. Finally full dehydration seems to take place at about 573 K (as detected more precisely with neutron diffraction than with TGA) and the weight loss estimated from TGA after full dehydration is 28wt% i.e., about 270 water molecules per unit cell. Note, however, that this value is
probably slightly below the real value for fully hydrated Ni7NaY
because the sample was let to stabilize at RT in flowing gas for 5 min in the TGA instrument before heating was started. Therefore, some previous - even if limited - dehydration can have occurred during this step, and the same situation holds for neutron diffraction experiments since the first pattern was taken after the sample was evacuated at RT.
3.3 Nickel displacement and related structural changes with water removal
The structural characteristics of the Ni7NaY sample along
heating were next determined from Rietveld refinement. For the 3T2 datasets, an unconstrained refinement of atomic positions was possible, thanks to the large resolution range of the diffractometer. For the G4.1 thermodiffractograms
restraints on T-O distances (T-O = 1.66 0.01 Å) were
introduced in order to limit the number of refined parameters. Atomic displacement parameters were kept fixed to standard values in all cases. Extra framework atoms were fully refined including occupancy factors.
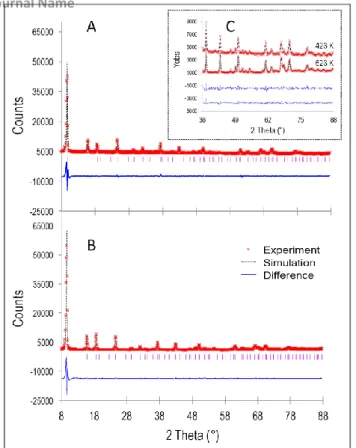
Two examples of refinement are shown in Fig. 5A (423 K) and Fig. 5B (623 K). Both reveal the data quality and the good agreement between measurement and simulation. The inset in Fig. 5C illustrates, once again, and for these two temperatures, the drastic change in baseline intensity level already discussed in the previous paragraph.
Fig. 5: Rietveld refinements of neutron diffraction patterns of Ni7NaY heated in vacuum
at (A) 423 K and (B) 623K: experimental (red crosses), simulated (dotted black lines)
0 1000000 2000000 3000000 4000000 5000000 6000000 7000000 8000000 10000 12000 14000 16000 18000 20000 22000 0 100 200 300 400 500
b)
a)
Temperature (K) In te ns ity (a .u .) 273 373 473 573 673 773c)
100 75 80 85 90 95 W eig ht ( % )Journal Name ARTICLE
J. Name., 2013, 00, 1-3 | 5
and difference (plain blue lines) data. (C) Zoom comparing the different levels of incoherent signal at these two temperatures.
From these refinements, atomic coordinates in the zeolitic framework and at extra-framework positions (cations and adsorbed water molecules) were obtained. Table 1 reports the data for 4 representative distinct steps of dehydration, namely 293 K (hydrated sample, data from 3T2), 423 K, 623 K and back to RT (dehydrated sample) (data from G4.1). The corresponding structures are schematized in Fig. 6 and the evolutions of sites occupancies for all covered temperatures are shown in Fig. 7. For reasons that will be detailed in the next section, the experiment for the fully dehydrated sample had to be repeated by heating the sample at a maximum temperature of 573 K, then cooling it back to RT. The results in Table 1 and in Fig. 6 are those of this second measurement. From these series of data, several conclusions can be drawn. Firstly, the cations occupancies (Table 1) and structures found
for hydrated and dehydrated Ni7NaY (Figures 6A and 6D,
respectively) confirm the already reported propensity of Ni2+
(i) to be localized at site I’ in the sodalite cages and to a less
extend at site II in the hydrated (evacuated) sample13 and (ii)
to move towards the centre of hexagonal prisms (site I) after water removal (to find higher confinement). For the limited nickel content presently studied, this last location is definitively the only one occupied by nickel after dehydration.
Surprisingly, all the Na+ ions were found to be located in the
sodalite cage at site II’ in the hydrated form (Fig. 7), which is
not commonly observed. However, Na+ ions position at site II
and II’ in a Y faujasite of composition (Ni21Na17Al59Si133O384)
partially dehydrated under air was previously reported.47 This
is in fact not very far from the recording conditions applied on 3T2 since the analysis chamber was evacuated at the beginning of the experiment (to remove atmospheric water).
The small amount of protons in our sample may also play a role. Unfortunately, the lack of very precise data between room temperature and 423 K, precludes to determine if the
transfer of the Na+ ions from sodalite cages (site II’) in the
hydrated form towards site II upon dehydration (Fig. 7) is a progressive or abrupt phenomenon. Secondly, intermediate
steps are seen above 423 K, with preferential Ni2+ location in
sites I' at 423 K, then in sites I when reaching 623 K (Table 1 and Fig. 6 and 7). Interestingly, it appears that nickel displacement from site I’ towards sodalite cages starts only around 423 K, after more than 70% of the water molecules have been removed (Fig. 4b), and the displacement from sites I' (in sodalite cages, at the entrance of hexagonal prisms) to sites I (inside the hexagonal prisms) occurring between 523 K and 623 K (Fig. 7) is associated to the removal of the last 10% water molecules (Fig. 4b).
Fig. 6: Experimental structures showing main cations locations as deduced from Rietveld analysis of Ni7NaY heated in vacuum at 293 K (hydrated sample), 473 K, 573 K and after dehydration (back to RT). The framework O atoms (red balls), the tetrahedral Si or Al (yellow balls), the Na+ cations (green balls) and the Ni2+ cations (magenta balls)
are represented. For the sake of clarity, water molecules are not shown.
From this discussion, it appears that a strong interest of neutron diffraction is to allow correlating the structural changes and cations migrations to specific - and quantified - dehydration levels. Nevertheless, it has to be recalled that the present experiments were performed in dynamic conditions, while heating. This can bring some uncertainty on the identification of temperatures at which peculiar steps occur, compared to experiments involving temperature stabilisation steps, as will be presented in a next paper (to be published). In this next paper, the framework distortions occurring upon water removal and the determining role of water rather than temperature towards such distortions will be discussed.
ARTICLE Journal Name
6 | J. Name., 2012, 00, 1-3
Table 1: Examples of coordinates and sites occupancies for framework atoms, cations and adsorbed water molecules in Ni7NaY after heating in vacuum at different
temperatures (space group Fd3m).
a Multiplicity and Wyckoff letter b Site occupancy factors
c Temperatures factors were fixed to an average value for (Si, Al) = T, O
framework atoms and extra-framework species.
Fig. 7: Evolution with temperature (293-623 K range) of the number of Ni2+ and Na+ cations, and of water molecules (Ow1) per unit cell in each type of cationic site (I, I', II, II’).
3.4 Complementary In situ heating TEM experiments
Finally, complementary TEM experiments were carried out, for the following reason. It is often advised to perform zeolite dehydration both in vacuum and at high temperatures to ensure full water removal. Such conditions were respected in the present neutron experiments. Nevertheless, after the first experiment in which the sample was heated up to 873 K, we
observed a slight colour change of the sample that turned grey. TEM observations were therefore performed: they revealed the presence, after heating, of small nanoparticles.
To analyse further this evolution, a dedicated TEM study was conducted using a heating sample holder. This allowed following
the evolution of given zones of the Ni7NaY sample during in situ
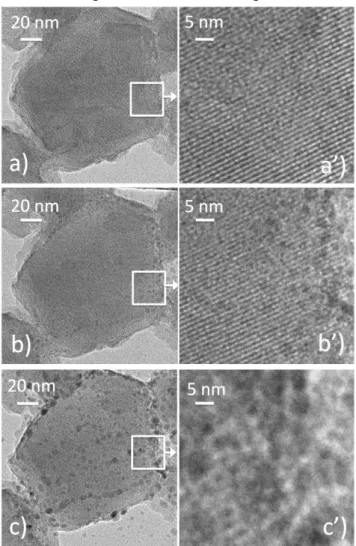
heating in the microscope, in vacuum (as for the neutron diffraction experiments). An example is shown on Fig. 8. The image registered for the hydrated sample shows a small regular truncated octahedral crystal with no additional phase detected (Fig. 8a). At higher magnification, the high crystallinity and the regular porous system are very well identified (Fig. 8a') confirming the structural quality of the sample after exchange already stressed out in § 3.1. At 573 K, however, small black spots start to be visible, suggesting some nickel reduction (Fig. 8b and zoom in 8b') and the process is strongly accentuated when temperature increases up to 873 K, nanoparticles 5-15 nm in size being then distinguished all over the zeolite grain (Fig. 8c and zoom in 8c'). Even if the sensitivity of metal cations to reduction upon heating in vacuum is rather well known, the present work stresses the fact that great care should be taken to avoid such process if heat and vacuum assisted dehydration of zeolites containing transition metal ions is targeted.
Fig. 8: Evolution of transmission electron micrographs of a same Ni7NaY crystal
during in situ heating on the heating sample holder in vacuum, in the microscope chamber: micrographs registered at (a) 293 K, (b) 573 K and (c) 873 K and (a', b', c') zooms on the zones (white rectangles) shown on the main pictures.
Atom Wyck.a S.O.F.b x/a y/b z/c U [Å2]c
3 T2 : 2 9 3 K ( h yd rat ed ) (a = 2 4 .7 1 1 6 (5 ) Å, Rf = 1 .0 % ) O1 96h 1 -0.1063(4) 0 0.1063(4) 0.0266 O2 96g 1 0.2516(4) 0.2516(4) 0.1417(5) 0.0266 O3 96g 1 0.1738(4) 0.1738(4) 0.1417(5) 0.0266 O4 96g 1 0.1766(4) 0.1766(4) 0.3265(6) 0.0266 Si 192i 0.6979 0.1256(4) -0.0546(4) 0.0350(5) 0.0122 Al 192i 0.3021 0.1256(4) -0.0546(4) 0.0350(5) 0.0122 Na(II’) 32e 0.784(6) 0.170(1) 0.170(1) 0.170(1) 0.0380 Ni (I’) 32e 0.111(5) 0.057(5) 0.057(5) 0.057(5) 0.0380 Ni (II) 32e 0.08(2) 0.270(4) 0.270(4) 0.270(4) 0.0380 O (w1) 32e 0.20(4) 0.305(3) 0.305(3) 0.305(3) 0.0380 O (w2) 32e 0.26(9) 0.072(3) 0.072(3) 0.072(3) 0.0380 G 4 .1 : 4 2 3 K (a = 2 4 .7 6 5 (2 ) Å, Rf = 3 .4 % ) O1 96h 1 -0.1066(6) 0 0.1066(6) 0.0266 O2 96g 1 0.2500(11) 0.2500(11) 0.1442(14) 0.0266 O3 96g 1 0.1730(12) 0.1730(12) -0.0359(12) 0.0266 O4 96g 1 0.1793(11) 0.1793(11) 0.3259(12) 0.0266 Si 192i 0.6979 0.1267(3) -0.0538(3) 0.0359(4) 0.0122 Al 192i 0.3021 0.1267(3) -0.0538(3) 0.0359(4) 0.0122 Ni (I’) 32e 0.181(4) 0.054(5) 0.054(5) 0.054(5) 0.0380 Na (II) 32e 0.45(14) 0.242(7) 0.242(7) 0.242(7) 0.0380 O (w1) 32e 0.217(6) 0.298(7) 0.298(7) 0.298(7) 0.0380 G 4 .1 : 6 2 3 K (a =2 4 .7 5 8 (2 ) Å , R f = 8 .1 % ) O1 96h 1 -0.1082(5) 0 0.1082(5) 0.0266 O2 96g 1 0.2539(9) 0.2539(9) 0.1428(10) 0.0266 O3 96g 1 0.1815(7) 0.1815(7) -0.0306(9) 0.0266 O4 96g 1 0.1744(9) 0.1744(9) 0.3147(12) 0.0266 Si 192i 0.6979 0.1220(3) -0.0535(3) 0.0357(4) 0.0122 Al 192i 0.3021 0.1220(3) -0.0535(3) 0.0357(4) 0.0122 Ni (I’) 32e 0.039(3) 0.071(16) 0.071(16) 0.071(16) 0.0380 Na (II) 32e 0.911(11) 0.233(3) 0.233(3) 0.233(3) 0.0380 Ni (I) 16c 0.356(5) 1/4 0 1/4 0.0380 G 4 .1 : B ack R T (d e h yd rat ed ) (a = 2 4 .7 2 5 (2 ) Å , R f = 8 .2 % ) O1 96h 1 -0.1086(5) 0 0.1086(5) 0.0266 O2 96g 1 0.2537(8) 0.2537(8) 0.1437(10) 0.0266 O3 96g 1 0.1840(7) 0.1840(7) -0.0321(9) 0.0266 O4 96g 1 0.1729(9) 0.1729(9) 0.3153(11) 0.0266 Si 192i 0.6979 0.1218(3) -0.0534(3) 0.0356(4) 0.0122 Al 192i 0.3021 0.1218(3) -0.0534(3) 0.0356(4) 0.0122 Ni (I’) 8a 0.009(3) 0.07(7) 0.07(7) 0.07(7) 0.0380 Na (II) 32e 1 0.232(2) 0.232(2) 0.232(2) 0.0380 Ni (I) 16c 0.428(5) 1/4 0 1/4 0.0380
Journal Name ARTICLE
J. Name., 2013, 00, 1-3 | 7
4. Conclusions
Neutron diffraction is shown to be a very powerful technique for the study of zeolites dehydration and establishment of correlations between water removal and cations mobility. By comparison with XRD that is commonly used to determine structural properties, neutron diffraction has the strong advantage, if water content is concerned, to allow water quantification together with structures determination. Moreover, the information can be very easily obtained during
the experiment thanks to the intensity of the 1H incoherent
signal that is related to water content and can be estimated directly from the diffraction pattern, in real time. Unambiguous relationship between hydration level and cationic sites occupancies can thus be obtained. Moreover, the high sensitivity of neutron scattering in this respect allows detecting low amounts of remaining adsorbed water at temperatures as high as 473 K, with a precision that is higher than with TG experiments. Full dehydration in Ni-NaY is reached around 573 K, a temperature that should in fact not be exceeded in vacuum conditions, since reduction of the nickel ions occur, as revealed here by an in situ TEM study allowing the recording of images of a selected zone of the sample while being heated.
Acknowledgements
H. Guesmi is acknowledged for her earlier contribution on DFT
modelling of Ni2+ sites in dehydrated NiNaFAU. LLB is warmly
thanked for the access to neutron diffractometers G4.1 and 3T2 through projects 10007 and 10008 (2010).
References
1 F. Fajula, D. Plee, Stud. Surf. Sci. Catal., 1994, 85, 633. 2 F. Di Renzo, F. Fajula, Stud. Surf. Sci. Catal., 2005, 157, 1. 3 N.S. Nesterenko, A.S. Kuznetsov, S.E. Timoshin, F. Fajula, I.
Ivanova, Appl. Catal., A: General, 2006, 307(1), 70.
4 A.N. Mlinar, G.B. Baur, G.G. Bong, A. Getsoian, A.T. Bell, Alexis T., J. Catal., 2012, 296, 156.
5 A. Goursot, B. Coq, F. Fajula, J. Catal., 2003, 216(1-2), 324. 6 D.W. Breck, E. M. Flanigen, Mol. Sieves, Pap. Conf., 1968, 47. 7 R.M. Barrer, R.P. Townsend, J. Chem. Soc., Farad. Trans. 2,
1984, 80(5), 629.
8 W.J. Mortie, E. Van den Bossche, J.B. Uytterhoeve, Zeolites, 1984, 4(1), 41.
9 G. Delahay, E.A. Villagomez, J.-M. Ducere, D. Berthomieu, A. Goursot, B. Coq, ChemPhysChem, 2002, 3(8), 686.
10 D. Berthomieu, G. Delahay, Catal. Rev. Sci. Eng., 2006, 48, 269.
11 A. Goursot, B. Coq, F. Fajula, J. Catal., 2003, 216(1-2), 324. 12 Ch. Baerlocher, L.B. McCusker, D.H. Olson, Atlas of Zeolite
Framework Types, 6th revised edition, Elsevier, Amsterdam, 2007.
13 T. Frising P. Leflaive, Microporous Mesoporous Mater., 2008,
114(1-3), 27.
14 W.J. Mortier, Compilation of Extra-framework Sites in Zeolites, Butterworths, Guildford, 1982, RI98.
15 Guesmi, D. Costa, D. Berthomieu, P. Massiani, J. Phys. Chem. C, 2011, 115(13), 5607.
16 H. Guesmi, P. Massiani, Catal. Today, 2011, 177, 25.
17 M.Jeffroy, E. Borissenko, A. Boutin, A.Di Lella, F.Porcher, M.
Souhassou, C. Lecomte, A.H. Fuchs, Microporous
Mesoporous Mater., 2011, 138, 45.
18 W. Louisfrema, B. Rotenberg, F. Porcher, J.L. Paillaud, P. Massiani, A. Boutin, Mol. Simul., 2015, 41(16-17), 1371. 19 D.H. Olson, J. Phys. Chem., 1968, 72, 4366.
20 Y. Horikawa, N. Ohnishi, K. Hiraga, Mater. Sci. Eng., 1996,
A217/218, 139.
21 Y. Sendoda, Y. Ono, T. Keii, J. Catal. 1975, 39, 357.
22 J.F. Groust, C. Pommier, L. Stievano, F. Villain, C. Giorgetti, F. Baudelet, P. Massiani, Catal. Lett., 2005, 102, 257.
23 J.M. Thomas, C. Williams, T. Rayment, J. Chem. Soc., Faraday Trans. 1, 1988, 84, 2915.
24 E. Doorhyhee, C.R. Catlow, J.W. Couves, P.J. Maddox, J.M. Thomas, G.N. Greaves, A.T. Steel, R.P. Townsend, J. Phys. Chem., 1991, 95, 4514.
25 N.D. Hutson, B. A. Reisner, R. T. Yang, B.H. Toby, Chem. Mater., 2000, 12, 3020.
26 A.J. Fowkes, R.M. Ibberson, M.J. Rosseinsky, Chem. Mater., 2002, 14(2), 590.
27 C. Forano, R.C.T. Slade, E. Krogh Andersen, I.G. Krogh Andersen, E. Prince, J. Solid State Chem., 1989, 82, 95. 28 J. Plevert, F. Di Renzo, F. Fajula, G. Chiari, J. Phys. Chem. B,
1997, 101, 10340.
29 J. Plevert, F. Di Renzo, F. Fajula, G. Chiari, Proceed. 12th Int.
Zeol. Conf., Baltimore, 1998, 1, 135.
30 V. Bosacek, S. Beran, Z. Jirak, J. Phys. Chem. 1981, 85, 3856. 31 J.M. Adams, L.V.C. Rees, J. Solid State Chem., 1986, 62, 184. 32 J. Hunger, I.A. Beta, H. Bohlig, C. Ling, H. Jobic, B. Hunger, J.
Phys. Chem. B, 2006, 110, 342.
33 A. Martucci, G. Cruciani, A. Alberti, C. Ritter, P. Ciambelli, M. Rapacciuolo, Microporous Mesoporous Mater., 2000, 35–36, 405.
34 M. Czjzek, H. Jobic, A.N. Fitch, T. Vogt, J. Phys. Chem., 1992,
96(4), 1535.
35 R.M. Haniffa, K. Seff, J. Phys. Chem. B, 1998, 102, 2688. 36 G. Vitale, C. F. Mellot, A. K. Cheetham, J. Phys. Chem. B,
1997, 101, 9887.
37 M. Kuronen, M. Weller, R. Townsend, R. Harjula, Reactive & Functional Polymers, 2006, 66, 1350.
38 A. Wozniak, B. Marler, K. Angermund, H. Gies, Chem. Mater., 2008, 20, 5968.
39 A.N. Fitch, H. Jobic and A. Renouprez, J. Phys. Chem., 1986,
90, 1311.
40 Intern. Tables for Crystallography, Vol. C, Third Edition, p446. 41 Rietveld, H. M. J. Appl. Crystallogr. 1969, 2, 65–71.
42 J. Rodriguez-Carvajal, Physica B, 1993, 192, 55; J Rodríguez-Carvajal, Commission on powder diffraction (IUCr). Newsletter 26, 12.
43 M.M.J. Treacy, J.B. Higgins (Eds.) in "Collection of Simulated
XRD Powder Patterns for Zeolites", fourth revision, 2001.
44 M.P. Attfield, A.W. Sleight, Chem. Commun., 1998, 601. 45 A.N. Christensen, M.S. Lehmann, J. Pannetier, J. Appl.
Crystallogr., 1985, 18, 170.
46 W. Abriel, K. Reisdorf, J. Pannetier, J. Solid State Chem., 1990, 85, 23.
47 J.W. Couves, R.H. Jones, J. M. Thomas, Adv. Mater., 1990,