HAL Id: cea-02360130
https://hal-cea.archives-ouvertes.fr/cea-02360130
Submitted on 20 Nov 2019HAL is a multi-disciplinary open access archive for the deposit and dissemination of sci-entific research documents, whether they are pub-lished or not. The documents may come from teaching and research institutions in France or abroad, or from public or private research centers.
L’archive ouverte pluridisciplinaire HAL, est destinée au dépôt et à la diffusion de documents scientifiques de niveau recherche, publiés ou non, émanant des établissements d’enseignement et de recherche français ou étrangers, des laboratoires publics ou privés.
Evaluation of the
U Neutron Cross Section in the
Unresolved Resonance Range
Arnaud Courcelle, Hervé Derrien, Luiz C. Leal, Nancy Larson
To cite this version:
Arnaud Courcelle, Hervé Derrien, Luiz C. Leal, Nancy Larson. Evaluation of the238U Neutron Cross Section in the Unresolved Resonance Range. Nuclear Science and Engineering, Academic Press, 2007, 156 (3), pp.391-402. �10.1016/S0306-4549(02)00005-1�. �cea-02360130�
Evaluation of the
238U Neutron Cross Section
in the Unresolved Resonance Range
Arnaud Courcelle*CEA0DEN-Cadarache, 13108 Saint Paul Lez Durance, Cedex, France and
Hervé Derrien, Luiz C. Leal, and Nancy M. Larson Oak Ridge National Laboratory, Oak Ridge, Tennessee 37831-6171
Received May 17, 2006 Accepted September 29, 2006
Abstract– This paper presents a new analysis of the 238U cross sections in the unresolved resonance
range, from 20 to 150 keV. Statistical analysis of the resonance parameters in the resolved resonance range with random-matrix theory provides accurate experimental values of strength function, average radiative width and average level spacing for s- and p-wave resonances. Above 20 keV, the simultaneous fit of selected experimental data (average transmission and capture) is performed with a statistical model of nuclear reactions as implemented in the SAMMY code.
Compared to previous evaluations, such as those described by Fröhner or by Maslov et al., this work benefits from the accurate transmission data measured by Harvey et al. at Oak Ridge Electron Linear Accelerator, which have never been studied before. This new evaluation was written into the current ENDF format for use in practical applications. This work stresses the need for an improved ENDF format to store average resonance parameters and cross sections in the unresolved resonance range.
I. INTRODUCTION
A new evaluation of the 238U neutron cross section
in the unresolved resonance range, from 20 to 150 keV is described. This energy range is of importance in the neu-tronic calculations of both thermal and fast breeder re-actors. One crucial aspect of evaluations in the unresolved resonance range is that reporting only pointwise cross sections is not sufficient: Nuclear data users require fur-ther information on resonance parameters to model res-onance shielding ~i.e., the drop of neutron flux in the vicinity of resonances! and temperature effects in neu-tron transport calculations.
The evaluation performed by Fröhner120 yr ago is
considered as a reference work and is still adopted in the
most recent version of JEFF and ENDF0B nuclear data libraries. The evaluation of Fröhner was carefully vali-dated with recent capture and total measurements as well as energy-averaged transmission data through thick sam-ples and self-indication ratios.2
However, several reasons justify a new investigation: 1. A recent evaluation of the238U resolved-resonance
parameters has been produced by the Oak Ridge Na-tional Laboratory ~ORNL! in collaboration with the Com-missariat à l’Energie Atomique3 ~CEA! below 20 keV.
Statistical analysis of the new set of resonances provides updated and accurate values of s- and p-wave strength functions ~S0 and S1, respectively!, average radiative widths, as well as the level density ~or spacing D! at low energy.
2. The high-resolution transmission data by Har-vey et al.4 and capture data by Macklin et al.,5 which
were measured up to 150 keV at the Oak Ridge Elec-tron Linear Accelerator ~ORELA! in 1988, are fully analyzed for the first time. The fluctuations in the aver-age total and capture cross section are well measured by these experiments. These structures, likely related to the local fluctuations of the level-spacing and reduced-width distributions, are discussed briefly.
II. STATISTICAL ANALYSIS OF238U
RESONANCE PARAMETERS
We have investigated the sample of s- and p-wave resonances from a recent ORNL evaluation.3This
eval-uation was based on a comprehensive experimental data-base from thermal energy to 20 keV. Several transmission and capture measurements, mostly performed at ORELA, were fitted with the Reich-Moore approximation of R-matrix theory using the SAMMY code.6 Careful
at-tention was paid to the study of experimental condi-tions ~normalization, background, resolution function, temperature!. Complementary techniques have permit-ted the separation between s-waves and p-waves ob-served resonances:
1. The theory of conditional probability gives the probability of a resonance with a given gGnto be l⫽ 0 or
l⫽ 1 ~Ref. 7!. This method suggests appropriate values
for the orbital angular momentum by discriminating res-onances according to the magnitude of their neutron re-duced widths.
2. Below 1.6 keV, Corvi et al.8have determined the
orbital angular momentum of 238U resonances by
ana-lyzing the gamma-ray spectrum following resonant cap-ture. They noticed that the g transitions involved in the decay of the compound nucleus are not the same in the case of s- or p-wave resonances. The g multiplicity is enhanced for p-waves, providing a way to identify the orbital momentum.
3. S-wave resonances can be detected by the asym-metry in the transmission data due to the potential-resonant interference. More generally, the simultaneous fitting of transmission and capture measurements and the analysis of the goodness of fit permitted the assignment of l for resonances with large reduced neutron widths.
The sample of p-wave resonances contains a large number of resonances that could not be detected in the experimental data. These unseen resonances were ran-domly added in order to minimize the effect of the missed levels on the calculated capture cross sections. Above 10 keV, poor experimental resolution makes resonance analysis difficult so that even resonance energies could not be reliably determined. A “pseudo-resonance”
ap-proach was used; a set of resonances was proposed that fits the transmission and capture data but does not accu-rately represent actual resonances. Consequently, reso-nances above 10 keV are not studied in the present statistical analysis.
The first step is to investigate the purity of the three populations of resonances: Jp⫽ 102⫹, Jp⫽ 102⫺, and
Jp⫽ 302⫺. For s-wave resonances, quick inspection of
the plot of the cumulative number of levels versus en-ergy ~Fig. 1!, as well as spacing and reduced width dis-tribution ~Fig. 2!, does not permit easy determination of the proportion of missing or spurious levels.
The random matrix theory9,10~RMT! provides more
efficient tools to analyze a sequence of resonances. The random matrix model assumes that the nuclear Hamilto-nian of a compound nucleus is represented by N⫻ N real symmetric matrices of high order, whose elements are randomly distributed and independent @the ensembles of such matrices are known as the Gaussian orthogonal en-semble ~GOE!#. Statistical properties of energy levels and wave functions are deduced from the eigenvalues and eigenvectors of the random matrix. The fluctuation properties of nuclear spectra are measured by various statistics. In the present work, comparison of experimen-tal data with GOE theory is made with Monte Carlo methods11~i.e., generation and diagonalization of a large
number of 1500⫻ 1500 real, symmetric matrices!. Var-ious statistics on Jp⫽ 102⫹ levels below 5 keV were
investigated.
Fig. 1. Plot of cumulative number of levels for the s-~straight line! and p-wave ~dashed line! resonances.
1. The fluctuation of the number of levels in an energy interval of fixed length r ~in units of observed average spacing DE⫽ r * Dobs! is measured by the
so-called number variance S2~r!. Table I shows reasonable
agreement between the Jp⫽102⫹experimental data and
GOE prediction up to 2.5 keV ~and even up to 5 keV!. As a more stringent test, the third and fourth moments of this number-of-levels distribution ~or equivalently the
skewness g1and excess g2! were also studied;
reason-able agreement was found below 2.5 keV.
2. The distribution of the nearest-neighbor spacings follows the Wigner surmise. RMT also provides theoret-ical forms of the spacing distribution P~k, r! ~and the associated spacing variance sk! of higher order k ~i.e.,
the distribution of spacings between two resonances hav-ing k resonances between them!. This test does not ap-pear to be very sensitive to the presence of spurious levels, and good agreement between 238U s-wave resonances
and GOE prediction is again observed up to 5 keV. 3. The short-range correlations between levels are measured by the linear correlation coefficient between nearest-neighbor level spacings. A theoretical correla-tion r~Di, Di⫹1! ⫽ ⫺0.27 is demonstrated with GOE
and confirmed by the present Monte Carlo simulations. Depending on the energy range studied, the experimen-tal correlation coefficient lies between⫺0.2 and ⫺0.35, and no problem is detected below 5 keV.
4. The D3~Ref. 9! statistics is a more powerful
mea-sure of long-range correlations in nuclear spectra. It is defined as the mean square of the deviation of the cumu-lative number of levels ~seen as a continuous function! from a fitted straight line. This test is very sensitive to the presence of impurities. As shown in Fig. 3, the agree-ment is fair between resonance data and theory below 3 keV. The experimental D3is overestimated at higher
energies, indicating there may be missed or spurious lev-els ~for instance, contamination of the s-wave set by p-wave resonances!.
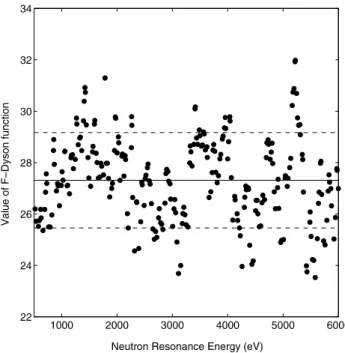
5. As discussed in Ref. 12, the F-Dyson statistic was introduced to provide a method to detect locally missed and spurious levels. For each resonance, a simple
Fig. 2. Distribution of238U s-wave reduced neutron widths
below 3 keV compared with a fitted truncated Porter-Thomas distribution. The small figure shows the comparison between experimental spacings distribution with the Wigner formula.
TABLE I
Synthesis of the Statistics for238U s- and p-wave Resonances Compared with GOE Results*
Statistic GOE Theory
Experimental238U Jp⫽ 102⫹ @0 to 2.5 keV# Experimental238U Jp⫽ 102⫺ @0 to 2.5 keV# Experimental238U Jp⫽ 302⫺ @0 to 2.5 keV# D3 0.476 0.487 0.388 8.65 r ⫺0.27 ⫺0.32 0.09 ⫺0.02 S2~1! 0.44 0.45 0.56 0.70 S2~3! 0.66 0.49 1.79 1.89 S2~6! 0.80 0.55 4.85 3.71 s0 0.53 0.50 0.79 0.77 s6 0.82 0.65 2.34 1.91 s10 0.89 0.68 2.85 2.38
analytical function is computed whose expectation value and standard deviation is known from GOE theory. Lo-cal deviation from this theoretiLo-cal estimate, outside 2s, can be interpreted as an indication of missed or spurious levels. Figure 4 confirms the possible presence of missed levels around 3 keV, as already indicated by the D3 statistics.
For p-wave resonances, despite the rather good lin-ear behavior of the cumulative number of levels versus energy below 3 keV, all random matrix statistics for
Jp⫽ 102⫺or Jp⫽ 302⫺disagree significantly from the
GOE prediction, as shown in Table I. The D3statistic,
for instance, is significantly overestimated for Jp ⫽
302⫺. This result is not surprising because of the pres-ence in the evaluated set of nonobserved small reso-nances. Moreover, the spin attribution is experimentally difficult for observed p-wave resonances. Note that RMT gives theoretical results of GOE statistics for mixed and independent spectra; these could permit testing of the entire set of p-wave resonances regardless of the spin.
Table I shows the results of the statistics for individ-ual populations. The conclusion of these tests, based ex-clusively on resonance energy information, is that the s-wave resonance parameter set seems to be almost pure up to 2.5 keV and the fraction of missing or spurious levels should be small. To support this conclusion, we used a missing-level estimator based on the spacing distribution. For a perfect sample, the
level-spacing distribution follows the Wigner distribution; however, when a fraction fm of energy levels is not
de-tected, the theoretical spacing distribution becomes13
P~D, fm!⫽
(
k⫽0`
~1⫺ fm!kP~k, r0fm! . ~1!
Here, r⫽ D0Dobsand P~k, r! is the k-order spacing
dis-tribution mentioned in previous sections. For GOE, these distributions were calculated by Monte Carlo or approx-imated by a Gaussian function with a variance propor-tional to ln~2p@k⫹ 1#!. To fit such a distribution and determine fm, we used the maximum likelihood method,
which does not require a binning of the distribution. The most likely value of fm is obtained by maximizing the
likelihood function:
L~ fm!⫽
)
iP~Di, fm! , ~2!
where Di are the experimental values of spacings.
Ap-plying this estimator, the proportion of missing levels with Jp⫽ 102⫹is found to be ,3% below 5 keV.
To determine the value of average strength func-tion and level spacing, the distribufunc-tion of evaluated reduced neutron widths, for resonances below 2.5 keV, was fitted with the truncated generalized Porter-Thomas
Fig. 3. Analysis of238U s-wave resonance parameters with
the D3Dyson-Mehta test. X-axis values are the upper
bound-aries of the energy intervals considered. The straight line is the theoretical GOE prediction, and the dashed line represents the theoretical standard deviation.
Fig. 4. Analysis of238U s-wave resonance parameters with
the F-Dyson test. The straight line is the theoretical value of the F-Dyson function, and the dashed lines represent the theo-retical estimate of the standard deviation ~2s! of the F-Dyson function. Black dots are the experimental values of the F-Dyson function for the238U s-wave resonance data.
distribution P~G, OG, n, Gt!with n degrees of freedom ~small
widths below the threshold Gtare excluded!:
P~G, OG, n, Gt!d G⫽
冦
0 G⬍ Gt n02 OG G~n02, nGt02OG!冉
nG 2 OG冊
n02⫺1 ⫻ exp冉
⫺nG 2 OG冊
d G G⬎ Gt. ~3! Here, G is the reduced width and G~n02, nGt02 OG! is the upper incomplete gamma function defined as G~ x, y!⫽ *y`e⫺ttx⫺1dt. In this work, we assume n⫽1 for a single
neutron channel. The fitting procedure is again the max-imum likelihood method, which consists of determining OG by maximizing the likelihood function L ⫽
)
iP~G, OG,n⫽ 1, Gt!. Several threshold values in different energy
ranges have been tested to obtain simultaneously the value of OG and D. An example of a Porter-Thomas fit for s-wave is shown in Fig. 2. Uncertainty values are given by the maximum likelihood procedure and by the fluctuations of the results with the threshold.
For p-wave resonances, despite significant devia-tions of experimental statistics from GOE theory, strength functions and average spacings were also estimated. The final results are reported in Table II.
III. EXPERIMENTAL DATABASE
The238U cross sections above a few
kilo-electron-volts have been measured many times in the past. For most of the measurements, detailed information is miss-ing, and sometimes numerical values for experimental data could not be found. Table III presents the selection of measurements used to perform our evaluation.
Below 100 keV, the transmission data measured by Harvey et al.4 were carefully analyzed. Three samples
~thin, medium, and thick! were measured at ORELA using
the 200-m flight path. The original data were corrected for resonance shielding effect @i.e, attenuation of energy-averaged transmission in the sample# using a set of arti-ficial but realistic resonance parameters up to 100 keV as input to the SAMMY code.14 Data from the three
sam-ples, averaged over 500-eV bins, give consistent total section values. Above 50 keV, the total cross-section measurement of Poenitz15is also a reference
mea-surement and is included in the present analysis. In the common range between the Harvey and the Poenitz data ~from 50 to 100 keV!, the two experimental cross sec-tions differ by ;2%. Older measurements from Tsubone et al.,16 Byoun et al.,17 and Uttley et al.18 are also
in-cluded in the fit.
In the capture data measured at ORELA by de Saus-sure et al.19 with the ORELAST liquid scintillator tank,
the normalization procedure was based on the saturated-resonance technique, using only the first saturated-resonance at 6.67 eV. It was assumed that the resonance parameters of this resonance were well known and that the multiple scattering correction was sufficiently accurate.
However, it can be demonstrated that above 100 eV, the de Saussure data need a significant renormalization. As recommended by the recent ORNL analysis below 20 keV, a correction factor of ⫺10% and a background correction of about⫺50 mb were applied to the original
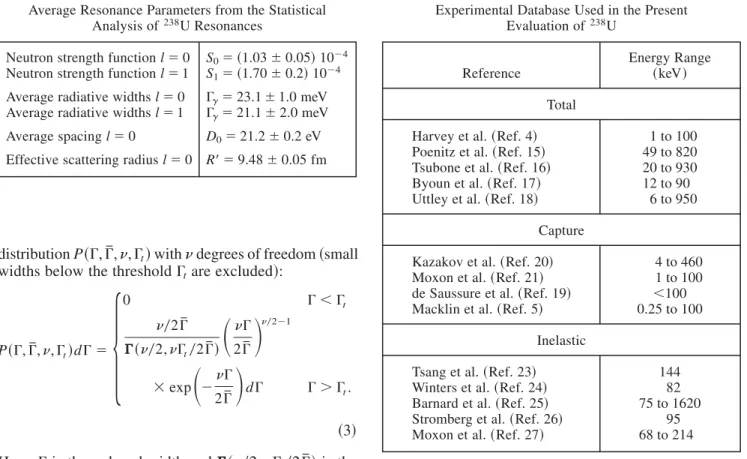
TABLE II
Average Resonance Parameters from the Statistical Analysis of238U Resonances
Neutron strength function l⫽ 0 S0⫽ ~1.03 6 0.05! 10⫺4
Neutron strength function l⫽ 1 S1⫽ ~1.70 6 0.2! 10⫺4
Average radiative widths l⫽ 0 Gg⫽ 23.1 6 1.0 meV
Average radiative widths l⫽ 1 Gg⫽ 21.1 6 2.0 meV
Average spacing l⫽ 0 D0⫽ 21.2 6 0.2 eV
Effective scattering radius l⫽ 0 R'⫽ 9.48 6 0.05 fm
TABLE III
Experimental Database Used in the Present Evaluation of238U
Reference
Energy Range ~keV! Total
Harvey et al. ~Ref. 4! 1 to 100 Poenitz et al. ~Ref. 15! 49 to 820 Tsubone et al. ~Ref. 16! 20 to 930 Byoun et al. ~Ref. 17! 12 to 90 Uttley et al. ~Ref. 18! 6 to 950
Capture
Kazakov et al. ~Ref. 20! 4 to 460 Moxon et al. ~Ref. 21! 1 to 100 de Saussure et al. ~Ref. 19! ,100 Macklin et al. ~Ref. 5! 0.25 to 100
Inelastic
Tsang et al. ~Ref. 23! 144 Winters et al. ~Ref. 24! 82 Barnard et al. ~Ref. 25! 75 to 1620 Stromberg et al. ~Ref. 26! 95 Moxon et al. ~Ref. 27! 68 to 214
data. This normalization procedure gives consistent val-ues with the data of Kazakov et al.,20as shown in Fig. 5.
The capture data of Moxon21 were also included in the
fit.
The Macklin capture data5 range from 0.25 to 100
keV. Two uranium samples were measured at ORELA with the ORELAST liquid scintillator tank using the 150-m flight path. The Macklin data were corrected for self-shielding and multiple scattering effects.
The normalization of the capture yields originally used the238U resonances with small G
n, which were
as-sumed to be known with a good accuracy from previous high-resolution transmission experiments by Olsen et al.22
Thus, the known areas of the resonances in the capture measurements GnGg0 Gt⬇ Gncould be used to normalize
the experimental capture yields. Nevertheless, a rather high uncertainty in the normalization factor is still ex-pected with this technique. The resonance analysis, be-low 20 keV, suggests a significant upward renormalization by⫹15 6 5% and a background correction of ⫺110 6 30 mb for the two samples. However, when these correc-tion factors are applied above 20 keV and after self-shielding and multiple scattering correction, the capture cross sections derived from the two samples are discrep-ant by more than 10%. For this reason, the Macklin data were not included in the fit. Note that in Ref. 2, the measurement of Macklin ~only thin sample data! was used to validate JEF2.2 capture cross section, but the data showed a reasonable agreement only at low energy, below 45 keV and disagreed at higher energy ~see Fig. 4 in Ref. 2!.
As in the Fröhner evaluation,1the evaluated capture
cross section in the present work relies mainly on the Kazakov et al. and Moxon et al. measurements whose normalizations are considered to be more accurate. For inelastic data, measurements taken from the EXFOR data-base are used.23–27
IV. FIT OF AVERAGE CROSS SECTIONS WITH THE STATISTICAL MODEL OF
NUCLEAR REACTION
The present SAMMY calculations are based on the statistical theory of nuclear reaction originally devel-oped by Lane and Thomas,28 Wolfenstein,29and Hauser
and Feschbach,30and extensively studied by Moldauer.31
We use the R-matrix form of the collision matrix. After averaging over a large number of resonances, the diagonal elements of the collision matrix ^Ucc& depend
on two important parameters: the distant level parameter
Rc`, which is the real part of the diagonal elements of the
average R matrix, and the pole strength sc, which is the
corresponding imaginary part ~related to the usual strength function Scby sc⫽ 10~2kac!
M
E01 eV Sc!,^Ucc&⫽ e⫺2ifc 1⫺ ~L*c⫺ B c!^Rc& 1⫺ ~Lc⫺ Bc!^Rc& ⫽ e⫺2ifc 1⫹ iPcRc `⫺ pP csc 1⫺ iPcRc `⫹ pP csc , ~4! where c⫽ neutron channel
Lc⫽ ZSc⫹ iPc⫽ vector whose real part is the
vec-tor of phase shift ZScand the imaginary part is
the vector of penetrabilities Pc
fc⫽ hard-sphere phase shift
^Rc&⫽ Rc
`⫹ ips
c⫽ diagonal part of the average R
matrix
Bc⫽ boundary conditions for the logarithmic
de-rivative of the wave function at the channel radius ac.
The total cross section is obtained directly from this form of collision matrix. The nonelastic partial cross sec-tion is calculated with the Hauser-Feschbach formula using the elastic enhancement and width fluctuation cor-rection factor ~WFCF!: scc'⫽ p| 2g c TcTc'
(
c Tc fWFCF . ~5!Fig. 5. Comparison between de Saussure capture data for
238U ~original data and renormalized data averaged over 1-keV
The transmission coefficients Tc are related to the
pole strength, the distant-level parameter, and the pene-trabilities. In SAMMY, instead of transmission coeffi-cient, the cross sections ~except fission! are expressed as a function of the neutron strength functions Sl and the
average radiative widths ^Gg&. These parameters can be
fitted provided that a careful choice of initial value and uncertainties is made. The version 1.0.6 of the SAMMY code ~September 2005! was used.
1. The Moldauer prescription32 was used to
com-pute the WFCF.
2. In the present methodology, the neutron strength functions Sland distant level parameters R`for the first
four partial waves are energy independent in the range 20 to 150 keV and are independent of the spin of the compound nucleus. As shown in Table IV, for l⫽ 0 and 1, the initial values of strength functions are taken from the statistical analysis of resonances described in Sec. III and a small uncertainty is given to constrain the fit. S2
and S3are also fitted using S0 and S1, respectively, as starting values before the fit.
3. The distant level parameters Rl
`
are also fitted, but for l⫽ 0, the starting value of ⫺0.1255 was adopted with a small uncertainty. This value was deduced from the determination of the effective scattering radius R0' ⫽
9.48 fm in the resonance analysis using the relationship
R0'⫽ a~1 ⫺ R0 `
!valid at low energy for l⫽ 0. For higher partial waves, Rl
`
are fitted using the a priori value of Fröhner1and the a priori uncertainty of 10%.
4. The value of average spacing D0⫽ 21.2 eV ~for
“zero” neutron energy! is used in the present work and is not fitted. This value renormalizes the level density model at low energy. Note that this value is signifi-cantly smaller than the Fröhner determination D0 ⫽
23.0 eV ~Ref. 1!. The energy dependence of the mean spacing for all values of l and allowed spin J are de-rived in SAMMY from the composite Gilbert-Cameron formula renormalized to D0.
5. It was necessary to give a very small uncertainty ~0.1 meV! to the average radiative widths Gg to keep
realistic adjusted values. A larger uncertainty in the fit leads to an unrealistic low value close to 20 meV. In SAMMY, the energy dependence of the radiative widths is based on the usual giant-dipole resonance model.
6. For inelastic scattering to the first 2⫹ level at 45 keV, the direct contribution was included using the optical model parameters and coupled channels calcula-tions of Lopez-Jimenez et al.33 As shown in Fig. 6, at
150 keV the contribution of the direct inelastic is ;5% of the total inelastic cross section.
The starting and fitted parameters are presented in Table IV. The experimental capture data of Kazakov and Moxon are well reproduced by the present evaluation ~see Fig. 7!. Quang et al.34 performed an absolute
mea-surement of the capture cross section at 23 keV. The present value sg⫽ 503 mb is in fairly good agreement
with the Quang et al. result sg⫽ 491 6 11 mb.
TABLE IV
Values of Initial Parameters and Associated Uncertainties for
238U in the Range 20 to 150 keV*
l Strength Function Sl104 Distant Level Parameter Rl` ^Gg&l ~meV! 0 1.030 6 0.005 ⫺0.1255 6 0.005 23.1 6 0.1 1.042 6 0.001 20.1172 6 0.002 22.65 6 0.1 1 1.700 6 0.01 ⫹0.20 6 0.03 21.1 6 0.2 1.893 6 0.002 10.1426 6 0.008 21.26 6 0.2 2 1.030 6 0.05 ⫺0.20 6 0.03 ⫽ Gg, l⫽0 1.187 6 0.004 20.2519 6 0.02 22.65 3 1.700 6 0.05 ⫹0.20 6 0.03 ⫽ Gg, l⫽1 1.490 6 0.008 10.1480 6 0.03 21.26
Average spacing ~low energy! D0⫽ 21.20 eV
*Before and after the fit ~normal and bold, respectively!. Final uncertainties of fitted parameters do not include system-atic uncertainties of experimental data and are strongly under-estimated.
Fig. 6. Comparison of various238U inelastic
experimen-tal data ~see the list in Table III! and the present calculation. The dotted line is the contribution of the direct inelastic process.
As previously noted, a discrepancy of ;2% is ob-served between the total cross-section values derived from the Harvey and the Poenitz data. The Harvey measure-ments, displayed in Fig. 8, are considered to be more accurate, and the Poenitz transmission data were
conse-quently renormalized downward by ;2%. We note that above 50 keV, the Poenitz data after renormalization agrees with the Tsubone data16 ~see Fig. 9!.
With the present fitted parameters, the experimental total inelastic cross section is fairly well reproduced up to 150 keV, as displayed in Fig. 6. However, at higher energy, experimental data are significantly underesti-mated. Note that subthreshold fission is not studied in this work.
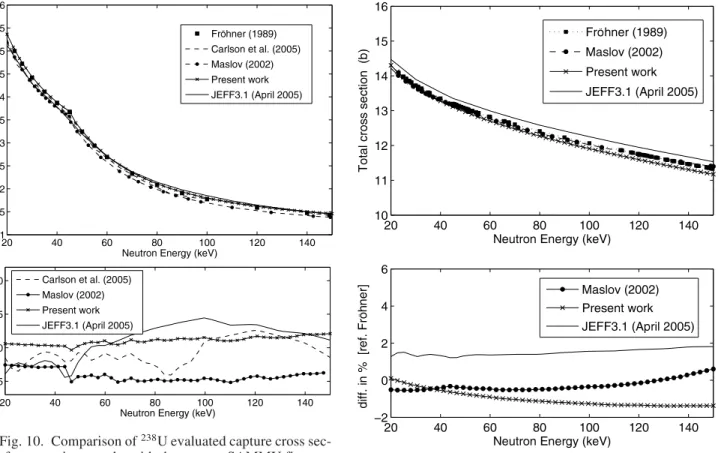
Figure 10 shows the comparison of the present cap-ture cross section with previous evaluations: Fröhner,1
Maslov et al.,35 Carlson,36 and Lopez-Jimenez et al.33
adopted in JEFF3.1. The present capture values are very close to the evaluation of Fröhner. Figure 11 presents the comparison of various total cross-section evaluations. As previously explained, above 50 keV, the present total cross-section values are slightly lower than Fröhner and previous works because of the inclusion of Harvey et al. data in the experimental database.
In order to check the present average resonance pa-rameters, total and capture cross sections, averaged over 2-keV energy bins, were computed between 10 and 20 keV using on the one hand, the Reich-Moore formalism as-sociated with resolved resonance parameters from Ref. 3 and on the other hand, the Hauser-Feschbach formalism and the present average resonance parameters. As shown in Table V, a reasonable agreement is obtained for total cross section. The difference is mainly due to the fluctu-ations of Gndistributions in the 2-keV energy bins ~each
bin contains about 100 resonances!. Capture cross sec-tion values calculated with resolved resonances are
Fig. 7. Comparison of selected 238U capture data with
the present evaluation.
Fig. 8. Comparison of238U total cross-section
experimen-tal data ~three samples! from Harvey et al. with the present SAMMY fit.
Fig. 9. Comparison of238U total cross-section
significantly lower from 5% between 10 and 12 keV, up to 9% in the 19 to 20 keV region. This underestimation might be explained by a significant proportion of miss-ing resonances as well as multiplets in the set of resolved resonance as pointed out in Sec. II.
Given the present experimental database, we esti-mate the average capture cross section to be known within a 4% accuracy at 20 keV and 10% at 150 keV. The total cross-section uncertainties are estimated to be 3% at 20 keV and 5% at 150 keV. Inelastic data are not known with better than 15% uncertainty. Because this evalua-tion relies heavily on the Hauser-Feschbach parameter-ization, a high correlation between average cross-section values at two different energies is expected. Further work is needed to assess rigorously the uncertainties and co-variance matrices.
V. ENDF FORMATTING STRATEGY AND REMAINING ISSUES
In the unresolved resonance range, nuclear data users require not only the average cross-section values ~tabu-lated in File 3 of ENDF! but also the information on average resonance parameters to compute some impor-tant functionals of the cross section such as transmission
^T &E, shielding factor ^SF&E, or self-indication ratios ^SI &E
that are experimentally measured: ^T &⫽ ^e⫺nst& E , ^SF &E⫽ ^sf&E ^s&E^f&E , ^SI &E⫽ ^e⫺nsts g&E ^sg&E . ~6!
The bracket ^ &Edenotes the average over the large
num-ber of resonances around the energy E and depends on the temperature and the level of self-shielding, and f is the neutron flux that follows the Boltzmann equation. To calculate these quantities, the ENDF recommends the tabulation of the average resonance parameters versus energy in File 2 as well as the degree of freedom of the corresponding distributions ~assuming standard x-square distributions!.
The ENDF-recommended formalism to get the cross section from average resonance parameter is the single-level Breit-Wigner formula averaged over a large num-ber of resonances. This approach is slightly different from the formalism explained in Sec. IV. Only neu-tron, gamma, and fission channels are allowed. Inelastic
Fig. 10. Comparison of238U evaluated capture cross
sec-tions from previous works with the present SAMMY fit.
Fig. 11. Comparison of 238U evaluated total cross
and other channels are lumped into a so-called compet-itive width, which is used only to calculate total widths and should not be used to compute the corresponding resonant cross section. It is not straightforward to con-vert the values of average parameters Sl, ^Gg&, Rl
`
, and
D~l, J ! used by SAMMY into average resonance
param-eters because of some differences between SAMMY and ENDF formalisms:
1. The same scattering radius for all partial waves must be used in ENDF instead of an l-dependent distant-level parameter Rl`
permitted in SAMMY. Note also that the partial waves l ⬎ 2 are not allowed by the current ENDF format.
2. The ENDF committee recommends also that the WFCF is calculated with standard averages over the x-square distribution. This formulation, used in current processing codes such as NJOY ~Ref. 37!, makes the treatment of temperature and self-shielding effect more convenient with the formalism developed by Hwang.38
In SAMMY and the modern nuclear model codes, the WFCF can be calculated more accurately using either the Moldauer prescription39or an improved formula such
as the three-fold integral proposed by Verbaarschot et al.40
In the present work, the discrepancies between point-wise cross sections generated by SAMMY and cross sec-tions calculated by NJOY, using only average resonance parameters, are small for the total cross section, ,1%. For capture, the discrepancies are small below the first inelastic threshold ~,0.7%! but increases at higher en-ergies to reach '4% at 140 keV. The traditional way to circumvent these inconsistencies is to use the option LSSF⫽ 1 allowed by the ENDF format that permits the tabulation of the average resonance parameters in File 2 and the average cross-section values in File 3. The File 2 parameters are used only to calculate the shielded cross
sections that are normalized with the infinite-dilution values in File 3.
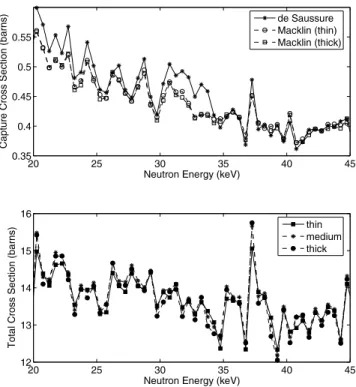
VI. CROSS-SECTION FLUCTUATIONS
One can notice that in the unresolved range, total and capture experimental cross sections, averaged over energy bins ,1 keV, exhibit significant fluctuations be-low 100 keV, which cannot be described by the statistical model. For instance, the two capture measurements of Macklin and de Saussure ~after renormalization! show the same structure pattern, and the peaks observed in the total cross section measured by Harvey are clearly cor-related with those observed in capture ~see Fig. 12!.
These fluctuations are explained by the fluctuations of average partial-widths and level-spacing distribution when the number of resonances in the averaging widths is small ~this is sometimes called Porter-Thomas fluctu-ations!. Theoretical estimates of the compound cross-section formation variance have been studied.41– 43Note
that an intermediate structure ~a nonstatistical effect caused by the presence of special nuclear states like door-way or halldoor-way state! was suspected by Perez et al.44
One way to describe fluctuations in evaluated files is to adjust locally the average neutron and gamma widths to reproduce the main structures of the cross section. However, current processing codes for the unresolved resonance range would not be able to cope with this description. Indeed, the analytic approach of Hwang or the usual probability-tables method assumes that the dis-tribution of reduced neutron widths follows a Porter-Thomas distribution. Such a procedure, applied to cross sections with explicit kilo-electron-volt structures, would double-count the fluctuations. For these reasons, Porter-Thomas fluctuations are not described in our evaluation. To our knowledge, the influence of these structures on
TABLE V
Average Values of Capture and Total Cross Section Computed with the Resolved Resonance Parameters and the Present Average Resonance Parameters*
Total Capture
Energy Range ~keV!
Average Cross Section from Resolved Resonance Parameters
Average Cross Section from Average Resonance Parameters
Average Cross Section from Resolved Resonance Parameters
Average Cross Section from Average Resonance Parameters 10 to 12 14.905 15.402 0.6659 0.6989 12 to 14 15.581 15.066 0.6536 0.6504 14 to 16 15.079 14.799 0.5793 0.6111 16 to 18 15.479 14.579 0.5603 0.5781 18 to 20 14.166 14.393 0.5022 0.5498
self-shielding factors and keff of fast reactors is still
unknown.
VII. CONCLUSION
A new evaluation of the 238U cross sections in the
unresolved resonance range, from 20 to 150 keV, is proposed. This evaluation is based on fits of carefully selected measurements, with the statistical model of nu-clear reactions of the SAMMY code. Compared to pre-vious works, the present evaluation benefits from the accurate transmission measurements of Harvey et al. up to 100 keV and from a recent evaluation of resolved resonance parameters. The resulting cross sections are not significantly different from Fröhner’s evaluation; the main difference is a slightly lower total cross sec-tion by 1 to 2% above 50 keV and a different choice of nuclear parameters. This new evaluation has been for-matted into an ENDF file ~Files 2 and 3! and is avail-able for integral testing. Some aspects of this work merit further investigation:
1. The present ENDF format for average resonance parameters is not fully consistent with modern nuclear statistical models and needs to be revised.
2. A more rigorous approach to get reliable covari-ance and uncertainty information is needed.
3. Experimental data analyzed in the present work give a good description of the Porter-Thomas fluctua-tions of the average cross secfluctua-tions in the unresolved res-onance range. These structures are not represented in the present work.
4. Experimental validation using thick transmission or self-indication ratio and thermal and fast-reactors benchmarking is also needed.
ACKNOWLEDGMENTS
This work was partly sponsored by CEA and the U.S. Department of Energy Nuclear Criticality Safety Program, un-der contract DE-AC05-00OR22725 with UT-Battelle, LLC.
REFERENCES
1. F. H. FRÖHNER, “Evaluation of the Unresolved Reso-nance Range of238U,” Nucl. Sci. Eng., 103, 119 ~1989!.
2. F. H. FRÖHNER, “Evaluation of the Unresolved Reso-nance Range of 238U⫹ n, Part II: Differential Data Tests,” Nucl. Sci. Eng., 111, 404 ~1992!.
3. H. DERRIEN, A. COURCELLE, L. LEAL, N. LARSON, and A. SANTAMARINA, Proc. Int. Conf. Nuclear Data for
Science and Technology, Santa Fe, New Mexico, September
26–October 4, 2004, American Institute of Physics ~2004!. 4. J. A. HARVEY et al., Proc. Int. Conf. Nuclear Data for
Science and Technology, Mito, Japan, May 30–June 3, 1998,
Saikon Publishing Co., Tokyo ~1988!.
5. R. L. MACKLIN et al., Proc. Int. Conf. Nuclear Data for
Science and Technology, Mito, Japan, May 30–June 3, 1988,
Saikon Publishing Co., Tokyo ~1988!.
6. N. M. LARSON, Updated Users’Guide for SAMMY:
Multi-level R-Matrix Fits to Neutron Data Using Bayes’ Equations,
ORNL0TM-91790R6 and ENDF-364, Oak Ridge National Lab-oratory ~2003!.
7. L. M. BOLLINGER and G. E. THOMAS, Phys. Rev., 171, 6 ~1968!.
8. F. CORVI, G. ROHR, and H. WEIGMANN, Proc. Int.
Conf. Nuclear Data for Science and Technology, Mito, Japan,
May 30–June 3, 1988, Saikon Publishing Co., Tokyo ~1988!. 9. C. E. PORTER, Statistical Theories of Spectra:
Fluctua-tions, Academic Press, New York ~1965!.
10. T. A. BRODY et al., Rev. Mod. Rev., 53, 385 ~1981!. Fig. 12. Average238U total cross-section data from
Har-vey et al. ~lower figure! and comparison of de Saussure cap-ture data ~renormalized data as explained in the text! with the Macklin data for238U, which are arbitrarily renormalized
11. A. COURCELLE, Workshop on Perspectives for Nuclear
Data for the Next Decade, Bruyeres-Le-Chatel, France,
Sep-tember 26–28, 2005, Nuclear Energy Agency ~2005!. 12. H. I. LIOU, H. S. CAMARDA, and F. RAHN, Phys. Rev.
C, 5, 3 ~1972!.
13. O. BOHIGAS and M. P. PATO, Phys. Lett. B, 595, 171 ~2004!.
14. H. DERRIEN et al., ORNL0TM-20030291, Oak Ridge National Laboratory ~May 2004!.
15. W. P. POENITZ, J. F. WHALEN, and A. B. SMITH, “ To-tal Neutron Cross Sections of Heavy Nuclei,” Nucl. Sci. Eng.,
78, 333 ~1981!.
16. I. TSUBONE et al., “Neutron Total Cross Sections of181Ta
and 238U from 24.3 keV to 1 MeV and Average Resonance
Parameters,” Nucl. Sci. Eng., 88, 579 ~1984!.
17. T. Y. BYOUN, R. C. BLOCK, and T. SEMLER, Proc.
Natl. Topl. Mtg. New Developments in Reactor Physics Shield-ing, Lake Kiamesha, New York, September 12–15, 1972, U.S.
Army Environmental Command ~1972!.
18. C. A. UTTLEY et al., “Neutron Strength Function Mea-surements in the Medium and Heavy Nuclei,” Proc. Int. Conf.
Nuclear Data for Reactors, Paris, France, October 17–21, 1966,
Vol. 1, p. 165, International Atomic Energy Agency ~1966!. 19. G. DE SAUSSURE and R. B. PEREZ, “Multilevel Effects in the Unresolved Resonances Region of the Cross Sections of Fissile Nuclides,” Nucl. Sci. Eng., 52, 382 ~1973!.
20. R. L. E. KAZAKOV et al., Yad. Konstant., 3, 37 ~1986! ~in Russian!.
21. M. C. MOXON, Harwell Report, AERE-R-6074, United Kingdom Atomic Energy Authority ~1969!.
22. D. K. OLSEN et al., “Measurement and Resonance Analy-sis of Neutron Transmission Through Uranium-238,” Nucl. Sci.
Eng., 69, 202 ~1979!.
23. F. Y. TSANG and R. M. BRUGGER, “The Differential Neutron Scattering Cross Sections of Uranium-238 at 144 keV,”
Nucl. Sci. Eng., 65, 70 ~1978!.
24. R. R. WINTERS et al., “Uranium-238 Inelastic Neutron Scattering at 82 keV,” Nucl. Sci. Eng., 78, 147 ~1981!. 25. E. BARNARD et al., Nucl. Phys., 80, 46 ~1966!.
26. L. G. STROMBERG and S. SCHWARZ, Nucl. Phys., 71, 511 ~1965!.
27. M. C. MOXON et al., Int. Conf. Nuclear Data for Science
and Technology, Gatlinburg, Tennessee, May 9–13, 1994,
Amer-ican Nuclear Society ~1994!.
28. A. M. LANE and R. G. THOMAS, Rev. Mod. Phys., 30, 257 ~1958!.
29. L. WOLFENSTEIN, Phys. Rev., 82, 690 ~1951!.
30. W. HAUSER and H. FESCHBACH, Phys. Rev., 87, 366 ~1952!.
31. P. A. MOLDAUER, Phys. Rev. C, 11, 426 ~1975!. 32. P. A. MOLDAUER, Nucl. Phys., A344, 185 ~1980!. 33. M. J. LOPEZ-JIMENEZ et al., Proc. Int. Conf. Nuclear
Data for Science and Technology, Santa Fe, New Mexico,
Sep-tember 26–October 4, 2004, American Institute of Physics ~2004!.
34. E. QUANG and G. KNOLL, “Absolute Measurements of the Fast Neutron Capture Cross Section of238U,” Nucl. Sci. Eng., 110, 282 ~1992!.
35. MASLOV et al., Ann. Nucl. Energy, 29, 1707 ~2002!. 36. A. D. CARLSON, Personal Communication, National In-stitute of Standards and Technology ~2006!.
37. R. E. MacFARLANE and D. W. MUIR, LA-12740-M, Los Alamos National Laboratory ~Oct. 1974!.
38. R. N. HWANG, “Efficient Methods for the Treatment of Resonance Cross Sections,” Nuc. Sci. Eng., 52, 157 ~1973!. 39. P. A. MOLDAUER, Phys. Rev. C, 14, 764 ~1976!. 40. J. J. M. VERBAARSCHOT, H. A. WEIDENMULLER, and M. R. ZIRNBAUER, Phys. Rep., 129, 367 ~1985!. 41. A. D. CARLSON and H. H. BARSHALL, Phys. Rev.,
158, 4 ~1967!.
42. F. FRÖHNER, Report NEA0WPEC-15; available at http:00 www.nea.fr, Nuclear Energy Agency ~1994!.
43. P. A. EGELSTAFF, Proc. R. Soc. (London), 71, 910 ~1958!. 44. R. B. PEREZ, G. DE SAUSSURE, R. L. MACKLIN, and J. HALPERIN, Phys. Rev. C, 20, 528 ~1979!.