HAL Id: hal-00609271
https://hal.archives-ouvertes.fr/hal-00609271
Submitted on 8 Jun 2021
HAL is a multi-disciplinary open access
archive for the deposit and dissemination of
sci-entific research documents, whether they are
pub-lished or not. The documents may come from
teaching and research institutions in France or
abroad, or from public or private research centers.
L’archive ouverte pluridisciplinaire HAL, est
destinée au dépôt et à la diffusion de documents
scientifiques de niveau recherche, publiés ou non,
émanant des établissements d’enseignement et de
recherche français ou étrangers, des laboratoires
publics ou privés.
medical coding support for chronic diseases
Laurent Lecornu, Clara Le Guillou, Frédéric Le Saux, Matthieu Hubert, John
Puentes, Jean Michel Cauvin
To cite this version:
Laurent Lecornu, Clara Le Guillou, Frédéric Le Saux, Matthieu Hubert, John Puentes, et al..
AN-TEROCOD: Actuarial survival curves applied to medical coding support for chronic diseases. EMBC
2010 : Annual International Conference of the IEEE Engineering in Medicine and Biology Society,
Aug 2010, Buenos Aires, Argentine. pp.1158-1161, �10.1109/IEMBS.2010.5627163�. �hal-00609271�
Abstract— For the practitioner, choosing diagnosis codes is a
non-intuitive operation. Mistakes are frequent, causing severe consequences on healthcare performance evaluation and funding. French physicians have to assign a code to all their activities and are frequently prone to these errors. Given that most of the time and particularly for chronic diseases indexed information is already available, we propose a tool named AnterOcod, in order to support the medical coding task. It suggests the list of most relevant plausible codes, predicted from the patient’s earlier hospital stays, according to a set of previously utilized diagnosis codes. Our method applies the estimation of code reappearance rates, based on an equivalent approach to actuarial survival curves. Around 33% of the expected correct diagnosis codes were retrieved in this manner, after evaluating 998 discharge abstracts, significantly improving the coding task.
I.
I
NTRODUCTIONIn the French medical information system, each procedure and diagnosis of the discharge abstract must be coded. Since 2004, hospital funding has been directly calculated relying on this information. However, coding is complicated and considered by physicians as a boring task. Because coding mistakes are common, each hospital may suffer the consequences of these errors, leading eventually to wrong statistics and therefore insufficient funding.
Conventionally, each patient admission is considered as an independent event, on which a health problem is diagnosed and treated. This view is nevertheless incompatible with the natural history of the disease, its predisposing factors and concomitant conditions treatments, as well as recovery, complications or relapses. Consequently, most of the time and especially for chronic diseases, indexed information is already available, although scattered without explicit links between relevant items.
AnterOcod (coding according to anterior information) addresses this particular issue. The tool calculates the list of most plausible codes and suggests it to the physician, depending on the relevance of the code recurrence and their utilization during previous patient hospital stays.
This work was supported by a TECSAN/ANR project under the name Med1dex, associating Brest CHU, Telecom Bretagne, Inserm U650 LaTIM, and Prismedica.
L. Lecornu, F. Le Saux and J. Puentes are with Institut Telecom; Telecom Bretagne, UEB; Dpt Image et Traitement de l’Information, Brest, France (email Laurent.Lecornu@telecom-bretagne.eu).
C. Le Guillou, M. Hubert, H. Jantzem, and J. M. Cauvin are with CHU Brest, Medical Information Departement, Brest, France.
L. Lecornu, C. Le Guillou, J. M. Cauvin, and J. Puentes are with Inserm U650 LaTIM, IFR 148 ScInBioS, Brest, France.
The proposed method directly determines the set of relevant recurrent diagnosis codes, as a function of the time interval that has passed since their last occurrence. Accordingly, it enables to indentify for any given patient, the most pertinent previously utilized codes, potentially applicable to the current stay.
After presenting the study context and the state of art (section II), the developed method (section III) that permits to predict diagnosis codes, is described. Some results are presented and discussed (section IV), before underlining the main findings (section V).
II.
C
ONTEXTBrief descriptions of the French healthcare information system coding practices and the related coding of hospital stays are proposed here, along with a definition of chronic diseases and their consequences in terms of coding. This context presentation precedes the state of the art description.
A.
Healthcare information system
As for many western countries, the French healthcare information system evaluates and funds hospitals on the basis of standardized information [1]. This information that is collected in the discharge abstract, only concerns hospitalizations, and is transmitted after anonymization to governmental health services, to be periodically analyzed. The hospital discharge abstract is formed by elementary discharge abstracts, which assemble information from all medical units that provided healthcare during the patient stay. Each abstract contains patient demographics, a main diagnosis related to healthcare resources consumption, associated diagnoses corresponding to secondary diseases and adverse events, complemented by annex diagnosis and/or therapeutic procedures. Diseases are coded according to the International Classification of Diseases – 10th revision (ICD-10), published and maintained by the World Health Organization [2]. Procedures are coded according to the Common Classification of Medical Acts (CCAM in French) [3], built and periodically revised by French medical experts. ICD-10 is mainly used in many countries for registering morbidity and mortality causes, and also with the goal of facilitating the organization of healthcare services. The ICD-10 contains nearly 17.000 entries corresponding to diseases, traumatisms, symptoms, and other reasons for using health services, classified in 22 chapters. Each diagnosis code is composed of a letter, followed by 2 to 4 digits.
ANTEROCOD: Actuarial survival curves applied to medical coding
support for chronic diseases
B.
Chronic diseases
Long-term or recurrent diseases are considered as chronic diseases, referring specifically to persistent and lasting medical conditions. The chronicity qualification is usually applied to a disease that lasts more than three months. In that case, any patient with a chronic disease usually needs several hospital stays, making possible that some diagnoses codes reappear during each stay. Such consideration is likely to enable coding support based on a code recurrence model, instead of selecting codes from long unstructured lists.
The validity of this hypothesis was initially verified on a sample of 998 patients with several hospital stays, of more than 48 hours, on a two years period. For each patient we simply compared the diagnosis codes of the last stay, with the codes found in the previous stays (Table I).
TABLE I:
RECURRENT CODES PRELIMINARY EVALUATION
QUANTITY VALUE
Number of patients 998 Number of codes in the last stay (1) 5.779 Number of codes in the previous stays (2) 8.211 Number of codes present in (1) and (2) 1.883
We can observe that more than 30% of the last stay diagnoses can also be present in previous stays. Nevertheless, if all previous diagnosis codes were proposed to code a stay, 70% of them would be useless to support the physician coding task. As a consequence, it is necessary to define a method to evaluate the relevance degree of each preceding available diagnosis code, in order to propose only appropriate potentially recurrent codes.
C.
State of the art
In this context, we are confronted to the problem of analyzing the reappearance of a possibly relevant event, within a group of less relevant events, having irregular apparition dates. Survival analysis copes particularly well with this kind of problem. Multiple applications of it have been developed to study various phenomena [4-7]. It deals with the notion of characterizing an event validity termination, modeling how events duration relate. In our case, we consider the presence of a diagnosis code at a time
ti, along with the relation to its previous appearances. Survival function
The survival function S, is defined as:
S t
( )
= Pr T > t(
)
(1) where t denotes time, T is a random variable signifying the time of an event end, and Pr stands for probability. Accordingly, the survival function is the probability that the time of an event end occurs later than a specified time, and is applied to model the event recurrence. In our case, the relevant code event recurrence.Lifetime distribution function
The lifetime distribution function, usually denoted F, is defined as the complement of the survival function:
F t
( )
= 1 − S t( )
(2)and the derivative of F (i.e., the density function of the lifetime distribution) is normally represented by f:
f t
( )
= ddtF t
( )
(3)Sometimes f is called the event density: rate of events finalization per time unit. Then, the survival event density function can also be expressed as:
s t
( )
= − f t( )
(4)Censoring
Censoring is common in survival analysis. Ideally, both begin and end dates of studied events are known. However, only the beginning and end dates of the study, not the events’ dates, are really known. For that reason two kinds of censoring are defined: right and left. Right censoring is activated on events whose begin date is known, and are still valid when they are lost to follow-up or when the study ends. Otherwise, if an event's span is less than the duration of the study, the span is said to be left-censored. Sometimes, events with a span less than some threshold may not be observed at all. This situation is known as truncation.
At a practical level non-parametric methods are preferred to simple functions to model survival curves. The main known non-parametric methods are the Kaplan-Meier estimate of the survival function and the actuarial life table.
Kaplan-Meier estimator
Let S(t) be the probability that an event from a given set will have a span exceeding t. For a given sample of size N from this set, let the observed times until the event end be:
t
1≤
t
i≤
t
n (5)When examining the observations, to each ti corresponds:
- ni: the number of events that are still being observed
just prior to time ti. With no censoring, ni is the
number of remaining events prior to time ti. With
censoring, ni is the number of remaining items
minus the number of censored cases. - di: the number of events not valid at time ti.
The Kaplan–Meier estimator is defined as the nonparametric maximum likelihood estimate of S(t), with:
ˆS t
( )
= ni− di ni ti<t∏
(6)Actuarial span table
In the actuarial version of survival curves, span tables are defined as follows:
px= 1 − qx (7)
qx: probability that an event which has lasted exactly x
time, will end before reaching time (x+1).
px: probability that an event which has lasted exactly x
time, will survive to a duration of (x+1).
While the studied set is referenced by its occurrence:
lx+1= lx⋅ 1 − q
(
x)
= lx⋅ px (8)lx+1
lx = px (9) lx: number of subjects who survive to a (x+1) duration.
l0: number of subjects at the starting point.
Also dx= lx− lx+1= lx⋅ 1 − p
(
x)
= lx⋅ qx (10)dx : number of events still valid at x, which end at (x+1).
And as extension:
tpx =lx+t
lx (11) tpx: probability that an event which has lasted exactly x,
will survive for t more time units.
t kqx=tpx⋅kqx+t=
lx+t− lx+t+ k
lx (12) t kqx: probability that an event still valid at time x, will
survive up to t, then end within the following k period. These two non-parametric methods were selected after unsuccessfully trying to model an estimated survival curve of 5 known recurrent diagnoses (atrial fibrillation and flutter (I48), asthma (J45), alcoholic liver disease (K70), chronic renal failure (N18), and transplanted organ and tissue status (Z94)), with parametric laws (exponential, Weibull, log-normal, log-logistic, and Gaussian).
III.
A
NTERO
COD CODING SUPPORT METHODA.
Principles
Our work intends to define when a diagnosis code could be pertinently recurrent. Considering a patient having previously stayed at the hospital because of a chronic disease, what are the previous relevant codes that should be proposed to the practitioner, in order to facilitate the current stay coding (Fig. 1)?
Fig. 1. Manual discharge abstract coding (dashed lines on top) vs. coding support based on actuarial survival curves (continuous lines). To answer this question, the time between the beginning of the current stay and the end of the previous stay containing the considered code, is compared to an arbitrarily defined time interval of the survival curves for that code. Figure 2 gives an example of actuarial span table estimator obtained for the I48, J45, K70, N18 and Z94, CIM-10 code families. This example clearly shows that the number of codes that reappear recurrently diminishes through time, confirming the suitability of applying an actuarial survival curve approach. Equivalent results were observed for other known recurrent diagnoses, and thus are expected to be found on large clinical databases, on which the number of
subjects with regard to a code, varies from several thousands to none.
A rough approximation of five time intervals (in months) was thus defined, with increasing delays that fit our application: [0, 1], (1, 3], (3, 6], (6, 12] and (12, 24]. Moreover, given the characteristics of the analyzed database, the number of subjects at the starting point for a given code can be rather low, making unnecessary to increase the amount of intervals.
Fig. 2. Actuarial span table corresponding to 30 days periods, of codes I48, J45, K70, N28 and Z94.
The estimator of survival rate and the code reappearance rate, from which an estimation of span distribution is deduced, are calculated for a database of previous patients discharge abstracts coded without coding support.
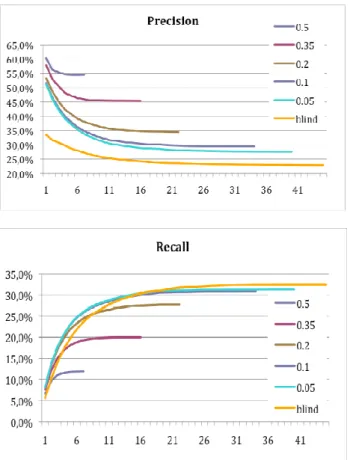
In order to study the resulting propositions quality, the precision and recall rates are computed on a test set of discharge abstracts. For our purpose, precision can be seen as a measure of exactness or fidelity, whereas recall is a measure of completeness.
B.
Coding method
Coding of a new stay relies on diagnoses of all previous stays during two years, associated with the minimal delay between the end date of the previous stay on which the code appeared and the start point of the stay being diagnosed. Afterwards, the minimal diagnoses delay is replaced by either the code reappearance rate or the failing proportion. Even though results obtained by ranking the diagnostic codes and event estimated duration distribution are identical, code ranking is faster.
Algorithm
- Select all previous codes and associated delays (time between the end of the last stay when the code appeared and the beginning of the current stay). - Select only the codes having a minimal delay. - Associate to each code a reappearance rate as a
function of the respective delay.
- When the reappearance rate is higher than a specified threshold, propose to the physician a ranked list of diagnosis codes, ordered by reappearance rates.
IV.
R
ESULTS-
D
ISCUSSIONApplying the previously described method, reappearance rates and survival curves were estimated for all diagnoses of the examined hospital database. Patients having a first stay between 1/1/2006 and 31/12/2007 were analyzed, being 31/12/2008 the end of our three years study. Considering diagnosis with more than 10 patients at t0 as potential
candidates, 216 recurrent codes were identified. Although this amount may seem negligible compared to the number of diagnosis codes (>17.000) in the data base, it is highly significant because those few recurrent codes are often present, as showed in Table II.
TABLE II:
DIAGNOSIS CODE REAPPEARANCE RATES
Diagnoses Patient samples
Reappearance rates
Code Label Patients Code
A09 Diarrhea and gastroenteritis of presumed infectious origin
706 347 40 C25.0 Head of pancreas: malignant neoplasm 56 55 28 G35 Multiple sclerosis 149 64 59 S82.6 Fracture of lateral malleolus 142 35 2
To fully validate our approach, a test sample of 998 patients having their last stay between 1/1/2009 and 31/06/2009, with previous stays in the 24 preceding months was tested. For each last stay, our algorithm is applied to select and order the diagnosis from all previous one. An experienced physician had to study one by one the proposed codes, which vary from 0 to 41 (in our test base), deciding to retain a code or not, before validating the pertinence of the next one. Precision (total number of chosen codes between the 1st and ith position divided by the total number proposed codes) and recall curves (total number of chosen codes between the 1st and ith stay, divided by the total number of codes indicated by the coder in the last stay) were defined as a function of the propositions amount, between the 1st and the ith rank, and compared to blind retrieval, on which all available codes without ranking are proposed (Fig. 3). Five code reappearance rate thresholds were defined: 0.05, 0.1, 0.2, 0.35, and 0.5 in order to study the precision and the recall as a function of thresholds.
Obtained results show that when the precision rate increases the recall rate decreases, with the worst precision and best recall rates for the blind retrieval. Given that the prior estimation of reappearance rates and survival curves is based on abstract discharges of one university Hospital Center, containing sometimes omissions and/or errors, a compromise should be found depending on the physician tolerance to wrong information. Such tolerance can be adjusted converting the recall to a precision rate.
V.
C
ONCLUSIONOur study suggests that the AnterOcod coding-aid method, based on ranked reappearance rates and survival curves of previously coded diagnoses, gives the practitioner better precision with an acceptable loss, to improve subsequent hospital stays coding, of chronic disease patients.
A study on a larger database should augment the knowledge quality of each diagnosis code evolution, compared to the current somewhat constrained database.
Perspective developments of the proposed work are to pursue its validation under clinical conditions and to fuse the results with those previously obtained with another diagnosis coding support method [8], which focuses on statistical analysis of patient demographic information to provide complementary relevant codes.
Fig 3. Precision and recall curves for 5 thresholds and blind retrieval.
R
EFERENCES[1] Noury JF. La gestion médicalisée des établissements de santé, Le PMSI et l’information médicale. CNRS Editions, 2000.
[2] International Statistical Classification of Diseases and Health Related
Problems ICD-10 Second Edition Tenth Revision. Volume 1,2,and3,
World Health Organization (ed), 2004.
[3] Maravic M, Le Bihan C and Landais P. La classification commune des actes médicaux (CCAM) : de la description à la tarification, Revue
du Rhumatisme 2003, 70 (9), pp. 785-789.
[4] Matthews, D.E., Farewell, V.T., Using and Understanding Medical
Statistics, 4th, completely revised and enlarged, KARGER (ed), 2007
[5] Collet D. Modelling survival data in medical research. London: Chapman & Hall, 1994.
[6] Hill C, Com-Nougué C, Kramar A, Moreau T, O'Quigley J, Senoussi R, et al. Analyse statistique des données de survie. Paris: Flammarion; 1990.
[7] Ford I, Norrie J, Ahmadi S. Model inconsistency, illustrated by the cox proportional hazards model. Stat Med 1995;14:735-746. [8] Lecornu, L. Thillay, G. Le Guillou, C. Garreau, P.J. Saliou, P.
Jantzem, H. Puentes, J. Cauvin, J.M. REFEROCOD: A probabilistic method to medical coding support, 31st International Conference IEEE