HAL Id: hal-02263097
https://hal.archives-ouvertes.fr/hal-02263097
Preprint submitted on 2 Aug 2019HAL is a multi-disciplinary open access archive for the deposit and dissemination of sci-entific research documents, whether they are pub-lished or not. The documents may come from teaching and research institutions in France or abroad, or from public or private research centers.
L’archive ouverte pluridisciplinaire HAL, est destinée au dépôt et à la diffusion de documents scientifiques de niveau recherche, publiés ou non, émanant des établissements d’enseignement et de recherche français ou étrangers, des laboratoires publics ou privés.
SENSAAS (SENsitive Surface As A Shape): utilizing
open-source algorithms for 3D point cloud alignment of
molecules
Dominique Douguet, Frédéric Payan
To cite this version:
Dominique Douguet, Frédéric Payan. SENSAAS (SENsitive Surface As A Shape): utilizing open-source algorithms for 3D point cloud alignment of molecules. 2019. �hal-02263097�
SENSAAS
(
SEN
sitive
S
urface
A
s
A
S
hape): utilizing
open-source algorithms for 3D point cloud
alignment of molecules
Dominique Douguet§* and Frédéric Payan±*
§
Université Côte d’Azur, Inserm, CNRS, IPMC, 660 route des lucioles 06560 Valbonne, France
±
Université Côte d’Azur, CNRS, I3S, Les Algorithmes - Euclide B, 2000 route des lucioles 06900 Sophia Antipolis, France
KEYWORDS: Molecular similarity, shape, surfaces, point clouds, Open3D library, alignment, substructure, bioisosteres, 3D pharmacophore.
ABSTRACT Open-source 3D data processing libraries originally developed for computer vision and pattern recognition are used to align and compare molecular shapes and sub-shapes. Here, a shape is represented by a set of points distributed on the van der Waals surface of molecules. Each point is colored by its closest atom, which itself belongs to a user defined class. The strength of this representation is that it allows for comparisons of point clouds of different kind
protein surface). The SENSAAS (SENsitive Surface As A Shape) workflow we developed for
aligning two molecules follows three major steps. First, it begins by generating surfaces and derived colored point clouds. Secondly, a Global registration method is executed to generate initial superimpositions. For two given point clouds, it consists in i) down-sampling them, ii) computing a local descriptor named FPFH for each remaining point to get a comprehensive description of local shape geometry, iii) finding the best matching between the features of each point cloud by using a RANSAC-based method. Thirdly, these initial superimpositions are refined by using the Colored point cloud registration method on the same down-sampled, but colored, point clouds, in order to take into account for the physico-chemical properties when optimizing the superimpositions. In this study, parameters were optimized to calibrate Open3D registration methods to molecular shapes. SENSAAS provides a score and a pairwise alignment. It
evaluates the molecular similarity by using three Tversky coefficients (ranging from 0 to 1). To show its utility, we investigated the alignment of several test cases ranging from similar to dissimilar molecules, conformers, bioisosteric chemical groups, substructures and fragments.
INTRODUCTION
Representing a molecule by using a 3D point cloud is not a new concept (1-5). A point cloud has this advantage of being an intuitive description suited to the visualization and to build a mental model. This representation also allows coloring points to highlight local shape properties and distributions, like a 3D pharmacophore that would also consider the three-dimensional form. Although they are simple to generate, point clouds may be difficult to align. Point set alignment, also known as registration or matching is a fundamental problem in many domains such as
robotics, pattern recognition, computer vision or data reconstruction (6). Alignment is often considered as a hard optimization problem because perfect point-to-point correspondences rarely exist: the point clouds might partially overlap only, or the underlying objects may have particular local geometrical features. A large number of solutions have been proposed for matching point clouds since decades (7,8). In our study, we investigated if newly registration methods may contribute to evaluate the molecular similarity of molecules when they are represented by colored point-based surfaces. Point-based surface methods are a particular class of shape similarity methods that are still in infancy (3,4).
METHODS
We mainly investigated registration methods developed in the Open3D library (9), freely available at the web site www.open3d.org. Based on these methods, we developed SENSAAS.
Considering two molecules, our alignment method follows four main steps described hereafter: i) generating point clouds describing the molecular surface; ii) assigning a color to each point according to several user-defined classes; iii) applying a geometry-aware registration for aligning the two point clouds globally; iv) applying color and geometry-aware local registration for refining the result of the first step.
SENSAAS is a rigid-body superimposition method whose results depend on the 3D conformation
of the molecules. SDF or PDB format files are accepted as inputs in our method. For small molecules or peptides, we highly recommend generating an ensemble of conformers in order to retrieve different shapes and 3D point clouds. Indeed, the more flexible the molecules are, the
draw and build ensemble of conformers by using the RDKit Open-Source Cheminformatics Software (http://rdkit.org).
I - Creation of 3D point clouds
1) Generating Molecular Surfaces
The nsc program developed by F. Eisenhaber et al. is used to calculate the van der Waals (vdW) surface of an input molecule (11), by using van der Waals radii taken from A. Bondi (12). It results into a cloud of points described by their 3D coordinates, and uniformly distributed on the underlying vdW surface. Each point is then labeled with the element name of its closest atom and saved in a PDB format file.
2) Hydrogen atoms and the molecular shape
We highly recommend to protonate input molecules. Hydrogen atoms are numerous in chemical entities. They significantly affect the geometry of the molecular shape and also contribute to the labeling of points distributed on the vdW surface. Also, hydrogen atoms often hide skeleton atoms like carbons. For example, in Figure 1, we show the 3D graph structure and the corresponding point cloud of the compound indoxam with (Fig. 1 a, b, c, d and e) and without (Fig. 1 f and g) hydrogens (hydrogen atoms are colored with white sticks and points). We can observe that the shape of the molecule differs significantly between the two states as well as the distribution of colors on the surface (Fig. 1 b and g). In the case of the protonated indoxam, aromatic carbons contribute to the surface with a typical pattern formed by two parallel green patches (Fig. 1 b). Such features are easily identified by the matching algorithm.
Of note, as hydrogens linked to nitrogens and oxygens are usually polar atoms, we categorize them into the same polar group of atoms (see I-3). It means that such hydrogen atoms will possess the same color as the attached nitrogen or oxygen atom (Fig. 1 c compared to b).
Tautomers are distinguished by the migration of a hydrogen atom on the structure and ionized molecules usually differ by the addition or removal of one hydrogen atom (for example, carboxylic acid / carboxylate forms of a molecule). Such changes have limited effects on the alignment results with our method because the difference in the number of colored points is small (Fig. 1 c and e). However, these different molecular states may lead to different conformers and, thus, may lead to different colored point clouds.
3) Color assignment of points in the cloud
In this study, we categorize chemical elements into four color classes, according to their physico-chemical properties. These color classes will help to refine the alignment of the input molecules during the second registration step and, also, to set several scores:
- class 1 [H, Cl, Br and I]. This first class includes non polar hydrogens and halogens, excepting fluorine. Hydrogens and halogens are molecule endings: these elements significantly contribute to the surface geometry and coloration. This class is usually the most populated. It outlines the global geometry and shows the distribution of apolar surface areas. This class is colored in white in our study.
- class 2 [N, O, S, H(NH/OH), F]. This second class includes polar atoms able to be involved in hydrogen bonds. Class 2 colored patches display polar surface areas on the molecular
surface. We also categorize polar hydrogens and fluorine elements in this class (13). This class is colored in red in our study.
- class 3 [C, P, B]. This third class includes skeleton elements. Sometimes they contribute to the surface. For example, a sp3 carbon does not contribute much to the surface because linked hydrogen atoms masked it. On the contrary, aromatic carbons may contribute to the surface as shown in Figure 1 (Fig. 1 b). As this class is colored in green in our study, such aromatics display a typical pattern formed by two parallel green patches.
- class 4 [other atoms]. This fourth class includes all other elements not listed in the other classes. This class is empty for most small organic molecules in medicinal chemistry. This class is colored in blue in our study.
These four classes recapitulate the major physico-chemical features that usually describe a pharmacophore (defined as the common features of known bioactive compounds): aromatic center, lipophilic center, hydrogen-bond donors and hydrogen-bond acceptors. In our study, these pharmacophoric features are distributed on the vdW surface instead of using the 3D graph coordinates. For example, such classification allows our method to display biosisosterism between a tetrazole and a carboxylate function (see RESULTS).
Of note, defining too many classes, for example by choosing one color per atom, may reduce the efficiency of the Colored point cloud registration method (step 4), because that will generate many small patches all over the surface.
Open3D is an open-source library that supports the development of software dealing with 3D data (9) (https://arxiv.org/abs/1801.09847). We use successively two complementary registration methods available in the library: a Global geometry-aware registration method (named GLOBAL,
from now on) that produces an initial alignment, and the Colored point cloud registration method (named COLOR, from now on) that further refines the superimposition. 3D registration
methods are calculated using PCD (Point Cloud Data) format files as inputs. We use BioPandas python library to read PDB input point clouds and then convert them into PCD format files (http://pointclouds.org/documentation/tutorials/pcd_file_format.php). A PCD aggregates 3D coordinates of points and an associated color (RGB), depending on the class of the point (color of the closest atom class). During the superimposition of two point clouds, we set the first input molecule as Target and the second input molecule as Source. The Source point cloud is rotated and translated to optimally match the Target point cloud.
a) GLOBAL
GLOBAL is feature-based registration. The base concept is to compute a multi-dimensional
descriptor for each point of the clouds, to describe the local geometry of the inherent surfaces. The registration thus consists in finding the best matching between the descriptors of each point cloud. This matching provides a matrix transformation that describes the rotation and the translation that must be applied on the Source to be aligned on the Target.
In this method, the descriptors are based on histograms, the Fast Point Features Histograms, aka FPFH (14). These histograms provide pose invariant local properties of the inherent surface geometry. In a nutshell, according the shape of its histogram, we can know if the surface around a point looks like a sphere, an angle, a plane…
Once Source and Target point clouds described separately by two sets of FPFH, RANSAC is applied (15). RANSAC has been developed during the eighties to estimate parameters of a mathematical model from a set of observed data iteratively. In our context, RANSAC is used to compute the elements of the matrix transformation that permits to “go from the source to the target” with only a translation and a rotation. Once this matrix applied, the two point clouds are registred, and finally we have the “best” alignment for the associated molecules. For more details, we suggest the readers to study the work of Choi et al. (16).
b) COLOR
COLOR is a local registration method that considers geometry but also color of the point clouds.
This method is particularly relevant for matching points sets acquired with RGB-D sensors for instance. Such sensors are used to capture real life scenes: they are able to provide not only a 3D point cloud that describes the surface geometry, but also to capture the color to each point. Given two colored point sets, the COLOR method finally tries to find the matrix transformation that
minimizes iteratively and jointly a functional combining the 3D coordinates and the RGB information of each point.
As explained before, for aligning molecular surfaces, we consider the influence of the atoms on the surfaces by considering user-defined classes. Each class being defined by a color associated to each point, we can benefit from the COLOR approach to improve the initial alignment obtained
with the GLOBAL approach. For more details, we suggest the readers to study the work of Park et
al. (17).
After performing the alignment of the Source and the Target as explained previously, SENSAAS
evaluates its efficiency with fitness scores. The Open3D library includes a function called
evaluate registration that calculates the amount of matching points between Source and Target.
As it evaluates a geometric fitness only, we called it gfit. A Source point matches a Target point if their distance is less than a defined threshold. The value gfit is the number of matching points in the Source cloud divided by its total number of points.
𝑔𝑓𝑖𝑡 =𝑛𝑢𝑚𝑏𝑒𝑟−𝑜𝑓−𝑚𝑎𝑡𝑐ℎ𝑖𝑛𝑔−𝑝𝑜𝑖𝑛𝑡𝑠−𝑖𝑛−𝑆𝑜𝑢𝑟𝑐𝑒 𝑇𝑜𝑡𝑎𝑙−𝑛𝑢𝑚𝑏𝑒𝑟−𝑜𝑓−𝑝𝑜𝑖𝑛𝑡𝑠−𝑖𝑛−𝑆𝑜𝑢𝑟𝑐𝑒 (8)
The RMSE of all matching points is also retrieved as well as the transformation matrix from the
evaluate registration function. Then, the transformation matrix is applied to point cloud and
coordinates of the Source molecule to visualize the superimposition of the point cloud and 3D graph, respectively. In this study, PyMOL version 1.3 was used to visualize alignments and generate pictures.
In this study, two other scores are calculated, cfit and hfit. cfit measures the matching of points in each class, whereas hfit calculates the same score but without class 1. hfit intends to specifically evaluate the matching of polar and aromatic points (class 2, 3 and 4).
𝑐𝑓𝑖𝑡 = ∑𝑘𝑖=1𝑛𝑏−𝑚𝑎𝑡𝑐ℎ𝑖𝑛𝑔−𝑝𝑜𝑖𝑛𝑡𝑠−𝑖𝑛−𝑆𝑜𝑢𝑟𝑐𝑒−𝑓𝑜𝑟 𝑐𝑙𝑎𝑠𝑠−𝑖
∑𝑘𝑖=1𝑛𝑢𝑚𝑏𝑒𝑟−𝑜𝑓−𝑝𝑜𝑖𝑛𝑡𝑠−𝑖𝑛−𝑐𝑙𝑎𝑠𝑠−𝑖 (9)
with k the total number of classes (in our study, k = 4; class 1 [H, Cl, Br, I], class 2 [N, O, S, H(NH/OH), F], class 3 [C, P,B] and class 4 [other atoms]).
ℎ𝑓𝑖𝑡 = ∑𝑘𝑖=2𝑛𝑏−𝑚𝑎𝑡𝑐ℎ𝑖𝑛𝑔−𝑝𝑜𝑖𝑛𝑡𝑠−𝑖𝑛−𝑆𝑜𝑢𝑟𝑐𝑒−𝑓𝑜𝑟 𝑐𝑙𝑎𝑠𝑠−𝑖
Those scores are similar to a Tversky coefficient (18) tuned to evaluate the embedding of one object (here the Source molecule) into another one (here the Target molecule).
In the following study, the term COLOR gfit, cfit or hfit means that GLOBAL + COLOR methods are
applied successively before calculating fitness scores.
IV - Test cases
Figure 2 displays the structures of molecular pairs used to set up and evaluate SENSAAS. Among
trivial test cases (Fig. 2 a), Sorbate(moved) and Imatinib(moved) are 3D structures simply rotated and translated away from the original pose. In such test cases, and if SENSAAS succeeds,
the resulting superimposition must be perfectly achieved and the score must equals 1. Substructures pairs like Sorbate/SorbateC, Imatinib/Imatinib-part1, -part2 and –part3 are test cases whose resulting alignment are also easy to validate (Fig. 2 b). Then, we wanted to align some molecules containing the bioisosteric tetrazole/carboxylate functions (19,20) (Fig. 2 c). Indeed, we aim at developing a method that performs well in scaffold hopping (i.e. replacing one chemical group by another one with a different chemotype) (21). This implies that SENSAAS must
not only successfully align molecules of the same size but also must correctly align substructures or bioisosteric fragments, even if they are small. We selected three molecules: Adapalene, which contains a carboxylic acid function, and Irbesartan and Valsartan, which contain a tetrazole ring. Adapalene is more dissimilar to Irbesartan and Valsartan than Irbesartan is to Valsartan. Irbesartan and Valsartan belong to the same therapeutic class of angiotensin II receptor
antagonists. The e-Drug3D website
http://chemoinfo.ipmc.cnrs.fr/MOLDB/browse.php?query=_718_796_776 (see the Similarities tab) displays alignments and similarity scores calculated by using the program ROCS (22-24).
Resulting scores indicate a ROCS ComboScore of 0.499 and 0.377 between Adapalene and Irbesartan and Valsartan, respectively (scores ranges between 0 and 1). Irbesartan and Valsartan are effectively more similar with a score of 0.701. By aligning these molecules, we aim at evaluating the balance between the global geometry matching and the colored patch matching. Finally, we aligned Tranylcypromine and Milnacipran which are neither therapeutically nor structurally similar but which share a common lipophilic/aromatic substructure (http://chemoinfo.ipmc.cnrs.fr/MOLDB/browse.php?query=_541_288) (Fig.2 d). Finally, we aligned four structural conformers of the molecule Bictegravir that were generated by using Corina (25) and Omega (OpenEye Software (24,26)) tools for enumerating ring conformers and acyclic rotamers, respectively.
RESULTS
Open3D registration methods are generalist for 3D data processing. Thus, registration methods may work with a 3D model of a building or a molecule, regardless of the scale of the object. Therefore, we investigated editable parameters in GLOBAL and COLOR methods and assessed their
effects on molecular shape alignment results. Table 1 displays the list of parameters that can be modified and optimized.
Optimization of the voxel size
In our study, points are uniformly distributed on the vdW surface when using the program nsc (11). The distance between two points in the cloud is ~ 0.3. Before performing registration, point clouds are commonly down-sampled to reduce the number of points in the point cloud, and thus,
the computation times. The down-sampling is done according to a regular voxel grid and operates in two steps:
- Points are bucketed into voxels;
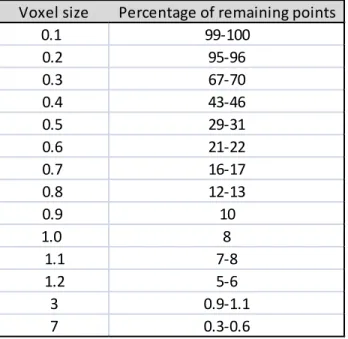
- Each occupied voxel generates one point by averaging all points inside (i.e., centroid). As the voxel size is unitless, it appears crucial to set values appropriate for our 3D molecular shapes. Figure 3 displays the results of the down-sampling on the molecule indoxam when using a voxel size of 0.5, 1.0 or 2.0. Table 2 shows the average percentage of remaining points for various voxel sizes. As expected, a voxel size ≤ 0.3 has a limited effect on decreasing the initial number of points since more than 70% of points are kept. On the contrary, a voxel size ≥ 1 results in pruning more than 90% of initial points. However, if too many points are removed, too much information about geometry and color distribution (color patches) are lost. Thus, we analyzed pairwise alignments for voxel size values ranging from 0.2 to 1.2 with an increment of 0.1. Of note, the same voxel size is applied to both Target and Source and to both GLOBAL and
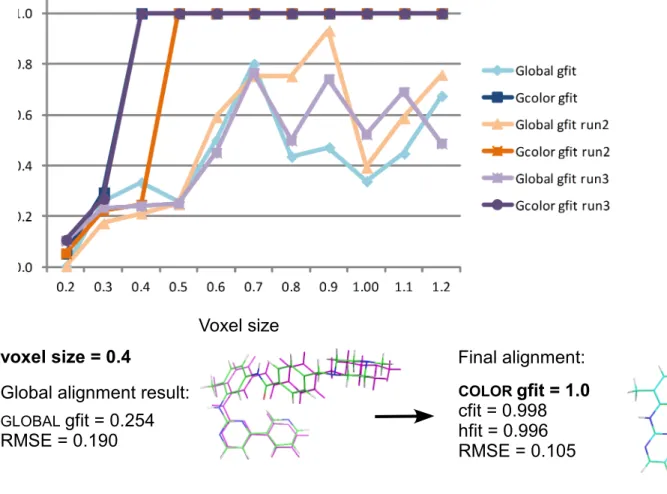
COLOR methods. In Figure 4, three pairs of molecules sorbate/sorbate(moved),
Imatinib/Imatinib(moved), Imatinib/Imatinib-part2 are aligned and gfit scores are plotted in function of the voxel size. Of note, Sorbate(moved) and Imatinib(moved) structures are the same as Sorbate and Imatinib structures (same conformer), respectively, except that they were rotated and translated away from the original pose. In such test cases, the resulting superimposition must be perfectly achieved by the alignment tool and the score must equals 1. Imatinib-part2 is a substructure of Imatinib (Fig. 2). Three runs were carried out. In all runs and whatever the voxel size, the GLOBAL gfit score is lower than the COLOR gfit score as well as the RMSE (Fig. 4 a, b
and c). This result confirms that the GLOBAL alignment is refined by the COLOR method. Results
for all cases. For example, perfect superimposition can be observed for the sorbate case but not for imatinib when voxel size equals 0.2 and 0.3. The down-sampling when the voxel size equals 0.2 is quite limited (95-96% remaining points) and it seems that a large number of points affect the GLOBAL method result. Indeed, the imatinib point cloud contains ~7800 points whereas the
sorbate point cloud contains ~2500 points. In the substructure alignment case (Fig. 4 c), GLOBAL
and COLOR gfit scores vary from one test to another but good and similar alignments and scores
are obtained for voxel sizes of 0.4, 0.6, 0.7 and 0.8. In this test case, voxel size larger than 0.8 lead to more erratic results. In conclusion, best values of voxel size likely depend on the size, geometry and color distribution as well as differences between the two point clouds. Since we do not know this information in advance and given that the down-sampling is reproducible for a given point cloud and for a given voxel size, we choose to execute the GLOBAL and COLOR
methods with each voxel size ranging from 0.2 to 1.2 with an increment of 0.1. This allows initiating the alignment procedure with eleven down-sampled point clouds that retain sufficient information on geometry and color distribution. The best COLOR gfit score is selected as the best
alignment for the two point clouds.
Optimization of parameters in GLOBAL
The ransac_based_on_feature_matching function was modified to tune the
RANSACConvergenceCriteria parameters, max_iteration and max_validation, which set the
maximum iteration before algorithm stops, and maximum times the validation has been run. In RANSAC, most of iterations do not successfully pass the validation step, the most computational step. Compared to the Open3D example, we increased max_validation to 1000 but decreased
Optimization of parameters in COLOR
The colored_icp registration method was modified to set the ICPConvergenceCriteria parameter
max_iteration to 100 to better optimize the refinement. Values larger than 100 did not improved
results in our test cases. A SENSAAS alignment only takes seconds but the current computational
cost is still expensive if one wants to perform millions of pairwise alignments.
Optimization of parameters for evaluation
The evaluation is performed on the entire dataset of points. The parameter threshold is the maximum correspondence points-pair distance to consider a pairing during evaluation. This parameter is not taken into account in GLOBAL or COLOR. Since the distance between two points
in our point clouds is 0.3, we set a threshold value to 0.3. Increasing this threshold would automatically and artificially increase gfit scores by pairing more distant points.
Pairwise alignments
Molecular pairs from Figure 2 were aligned by using SENSAAS. Molecular set a) was used to set
parameters and successful superimpositions were obtained (Fig. 4 a and b). Molecular set b) was used to investigate substructure matchings. Three imatinib substructures (only one conformer) were aligned on the target Imatinib. Of note, the pyridine ring in Imatinib-part2 shows a 180° rotation compared to the Imatinib’s pyridine conformer. Figure 5 displays the three superimpositions along with the COLOR gfit score. Substructure matching succeeds since each
part aligns with its counterpart in Imatinib structure. A small shift is observed for the Imatinib-part1 alignment because of the pyridine conformer difference. Imatinib-part2 is perfectly
aligned. Imatinib-part3 superimposition displays a shift in the pairing of the piperazine rings. This is also due to a different conformer of the piperazine ring. Sorbate/SorbaceC is also a trivial test case that SENSAAS successfully aligns.
In this study, we were particularly interested in the bioisosterism between the tetrazole and carboxylate function (molecular set c) in Figure 2). Indeed, although these two functional groups appear to be structurally quite different, several studies have demonstrated that they may be interchangeable in a bioactive molecule (19,20). Figure 6 a) displays the superimposition of these two chemical groups. Aligned point clouds in b) are colored by the standard color element of their closest atoms (nitrogens in blue, oxygens in red, carbons in green and hydrogens in white). In SENSAAS, blue and red points are merged into the same class number 2 since N, H in
N-H, O and H in O-H are considered as polar points. Thus, with this coloration, point clouds of these two fragments look alike and SENSAAS properly aligns the three color patches (class 1 in
white, class 2 in red, class 3 in green; Fig. 6 c). Then, we checked that SENSAAS succeeds to align
the tetrazole chemical group on the two drugs Irbesartan and Valsartan which contain such a substructure (Fig. 6 d and e). As well, the pairwise alignment between a carboxylic acid group and the structure of Adapalene leads to the expected superimposition (the same result is obtained when using the carboxylic acid form) (Fig. 6 f). Then, we investigated whether a tetrazole group can align on the carboxylic acid function of Adapalene or on the carboxylate of Adapalene in its ionized form. Figure 6 g) and h) display pairwise alignments in which the tetrazole effectively superimposes well with the carboxylate or carboxylic function. An alternate superimposition is sometimes observed in which the methyl group of the tetrazole is aligned on the methoxy group of Adapalene (Fig. 6 i)). This alignment is scored with as slightly better value of COLOR gfit,
0.612 instead of 0.603, but the value of the COLOR hfit score, 0.041 instead of 0.584, clearly
indicates a mismatch of colored points in this alternate solution.
To complete this study, we carried out pairwise superimpositions between the three drugs to investigate whether bioisosteric groups affect the geometrical alignment. In SENSAAS, the color
information is used in a second step to refine the initial alignment from the Global registration method. Results show that biososteric groups do not superimpose in any of the two cases (Fig. 7 a and b) but that the overall geometrical alignment is achieved. COLOR gfit values are low but
they are consistent with low ROCS ComboScore values displayed in the e-Drug3D database (http://chemoinfo.ipmc.cnrs.fr/MOLDB/browse.php?query=_718_796_776; see Similarities tab). Such values highlight the structural and geometrical dissimilarities of Adapalene with Irbesartan and Valsartan. Moreover, these drugs do not bind the same protein and binding pocket, retinoic acid and angiotensin II receptors, respectively. On the other hand, the pairwise alignment of Valsartan and Irbesartan shows the expected superimposition of the similar phenyl-phenyl-tetrazole substructure (Fig. 7 c).
An additional pairwise alignment was performed on two drugs, Tranylcypromine and Milnacipran, which do not bind the same protein target but display a common substructure (Fig. 7 d). Here again, SENSAAS is able to identify and align similar sub-shapes that leads to a good
superimposition of the sub-structures of the 3D graph of the molecules even if initial point clouds are significantly different (Fig. 7 d). Since SENSAAS gfit scores are only calculated with
the number of pairing points in Source, a different gfit score is obtained when the opposite calculation is carried out with the Target becoming the Source. Of note, the opposite calculation leads to the same structural alignment except in cases where several solutions (several local alignments) exist (usually, in such cases, gfit scores are low). The smallest molecule of the two
will always obtain the highest gfit score since, proportionally, more points are paired. We have, on purpose, developed an evaluation mode version of SENSAAS to evaluate the symmetric value.
In the following example, we used SENSAAS to align four conformers of the drug Bictegravir
(Fig. 2 e). Conformers are characterized by structural changes in the oxazepine ring and in two rotamers of the amide linker. Four pairwise alignments with the first conformer as the Target is displayed in Figure 8. Alignments show a superimposition of conserved substructures, confirming the efficiency of SENSAAS in identifying common sub-shapes in point clouds.
Finally, a preliminary analysis of the distribution of COLOR gfit scores was carried out by plotting
the values of 500 000 different pairwise alignments between drugs extracted from the e-Drug3D dataset (one conformer; (27))(Fig. 9). Drug structures in that dataset are structurally various ranging from small compounds like Histamine to high molecular weight peptides like Triptorelin. Score values range from 0 to 1. Approximately 63% of gfit values are in the range ]0.2 – 0.4] and 22% possess a value larger than 0.4, 7% a value larger than 0.5 and only 2% a value larger than 0.6. COLOR gfit scores of 1 are obtained for pairwise alignment of structures on
themselves. The distribution stringently distinguishes similar from dissimilar molecules. For now, a gfit score larger than 0.5 seems to translate into a clear similarity with reproducible results. On the contrary, a gfit score lower than 0.5 means a weak molecular similarity and, often, also leads to several (local) solutions when the calculation is repeated. These discriminating scores can be an advantage when one wants to screen millions of structures to select only few similar molecules to the query. A more detailed analysis of gfit, cfit and hfit scores will be performed in the future.
In conclusion, we show that SENSAAS performs well in aligning globally drug-sized molecules as
DISCUSSION
In the present study, we establish that functions Global registration and Colored point cloud
registration from the open-source Open3D librairies can be combined and configured to create
an efficient tool for aligning colored point-based surfaces of molecules. In this area of research, Baum et al. showed the most accomplished work so far (5,28,29). In their studies, hydrogen atoms are omitted and the solvent excluded surface is partitioned into equally weighted patches represented by a centered point. A point positioning optimization then leads to a point cloud of few hundred points with a neighbored point distance of 2.0 Å (5). Another main difference with our algorithm is that they create distinct point clouds for molecular shape and for each physico-chemical property. In our study, the average neighbored point distance is 0.3 on the vdW surface. This results into a finer resolution of the shape but also into many more points in the cloud. However, nowadays, 3D data processing libraries such as Open3D uses to handle much larger point clouds (representing buildings for example) than point clouds representing the surface of a molecule. In our approach, we also choose to color points in a basic and intuitive way with only four colors representing the physico-chemical property of their closest atoms: polar, apolar, aromatic and other. Such features are often used in 3D pharmacophore designing (30). This way of coloring can easily evolve towards more complexity (more classes, computed physico-chemical properties such as the partial charge…). However, we anticipate that increasing the number of colors will lead to point clouds with many small patches and this will probably make the alignment more difficult to optimize. Further studies are needed to determine these limitations. Our current setting is also insensitive to tautomeric and ionization forms of the molecule as long as few hydrogen atoms are involved. We showed that such changes do not
significantly modify the point cloud. This can be another advantage of SENSAAS since 1) such
information on molecules is not always known and not easily calculated and, 2) enumerating tautomers considerably increases the size of collections. Then, regarding the molecular similarity score, it would be interesting to combine the three gfit, cfit and hfit scores to discriminate alternate alignments when they exist. For example, we showed that the hfit score in the pairwise alignment of Adapalene/Tetrazole helps in selecting the best superimposition (i.e. bioisosteric groups alignment) and distinguishing the alternate, geometrical, superimposition.
In conclusion, SENSAAS is able to identify and align similar shapes and sub-shapes that lead to a
good superimposition of the structures and sub-structures of the corresponding 3D graphs even in cases where initial point clouds are significantly different. Still, a broader study would be important to assess performance when compared to other tools, especially other 3D shape-based approaches (31,32). Finally, the program, although fast, would also require an optimization of the computational cost for its use in virtual screenings of millions of molecules.
CONCLUSIONS
Molecular similarity is a central concept in drug discovery. A wide range of methods have been developed to describe molecules and assess similarity by using representations such as the molecular formula, the chemical graph in 2D or 3D or the molecular shape. In this study, we investigated the use of newly available open-source libraries in 3D data processing to assess point-based surface similarities of molecules. SENSAAS remains close to the concept of the 3D
pharmacophore but differs by also taking into account for the geometry of the shape. The method was evaluated and validated against several test cases ranging from pairwise alignments to substructure matching of fragments. It shows potential for molecular similarity evaluation and
scaffold hopping. In particular, as it uses open-source libraries and programs, it can be easily retrieved and deployed for other pairwise comparison of shapes such as peptides or proteins.
FIGURE LEGEND
Figure 1 The molecule indoxam with or without hydrogens. Hydrogens are colored in white, carbons in green, nitrogen in blue and oxygens in red. Dotted boxes highlight differences between point clouds. a) 3D graph structure of indoxam with hydrogens. b) point cloud generated by using a). c) point cloud generated by using a) in which polar hydrogens are colored with the color of the linked atom. d) 3D graph structure of the ionized indoxam with hydrogens. The carboxylic acid is transformed into a carboxylate function. e) point cloud generated by using d). f) 3D graph structure of indoxam without hydrogens. g) point cloud generated by using f).
Figure 2 Structures of molecules used as test cases. a) molecular dataset to set parameters. Sorbate(moved) and Imatinib(moved) are 3D structures simply rotated and translated away from the original pose. b) molecular dataset to validate the method on sub-structure test cases. Part1, 2 and 3 are sub-structures of the Imatinib structure. SorbateC structure possesses an additional carbon compared to Sorbate. c) As we are interested in bioisosterism and scaffold hopping, we selected some examples in which the tetrazole/carboxylate bioisosterism can be challenged. Adapalene, Irbesartan, and Valsartan possess either of the chemical functions. d) Tranylcypromine and Milnacipran also share a common substructure although they do not possess similar bioactivities. e) The drug Bictegravir is used as a test case to align its conformers.
Figure 3 Effect of the voxel size on the number of points in the down-sampled point cloud. The original point cloud was calculated using the molecule indoxam.
Figure 4 GLOBAL and COLOR gfit scores in function of voxel sizes ranging from 0.2 to 1.2. Three
runs are plotted (blue, orange and mauve lines). The GLOBAL initial alignment and the best final
alignment are displayed along with their COLOR gfit, cfit, hfit scores and RMSE value. Target and
Source 3D structures are colored in green and cyan, respectively and the Source structure after
GLOBAL is colored in magenta. a) Imatinib/Imatinib(moved) pair. b) Sorbate/Sorbate(moved)
pair. c) Imatinib/Imatinib-part2 pair.
Figure 5 Pairwise alignments of the four test cases used to validate substructure matchings. a) Imatinib/Imatinib-part1. b) Imatinib/Imatinib-part2. c) Imatinib/Imatinib-part3. d) Sorbate/SorbateC. Target and Source 3D structures are colored in green and cyan, respectively.
Figure 6 Pairwise alignments to evaluate the bioisosterim of tetrazole/carboxylate chemical groups. Target and Source 3D structures are colored in green and cyan, respectively. a) pairwise alignment of the tetrazole function with a carboxylate function. b) Aligned point clouds are colored by the standard color element of their closest atoms (nitrogens in blue, oxygens in red, carbons in green and hydrogens in white). c) Aligned point clouds are colored by classes in
SENSAAS (class 1 in white, class 2 in red and class 3 in green). d) pairwise alignment of
f) pairwise alignment of Adapalene with a carboxylic acid group. g) pairwise alignment of Adapalene in a carboxylate form with the tetrazole group. h) pairwise alignment of Adapalene in a carboxylic form with the tetrazole group. i) Alternate pairwise alignment of Adapalene with the tetrazole group.
Figure 7 Pairwise alignments of structurally dissimilar molecules. Target and Source 3D structures are colored in green and cyan, respectively. a) Adapalene/Irbesartan. b) Adapalen/Valsartan. c) Valsartan/Irbesartan. d) Tranylcypromine/Milnacipran. Point clouds of Tranylcypromine and Milnacipran are displayed. Point clouds are colored by the standard color element of their closest atoms (nitrogens in blue, oxygens in red, carbons in green and hydrogens in white).
Figure 8 Pairwise alignments of four conformers of the molecule Bictegravir. Target and Source 3D structures are colored in green and cyan, respectively.
Figure 9 Distribution of the COLOR gfit scores for 500000 different pairwise alignments of drugs
TABLES
Table 1. GLOBAL, COLOR and evaluation registration parameters. Highlighted cells indicate
which parameters were modified in our study when compared to values in Open3D examples.
Table 2. Percentage of remaining points after down-sampling the molecular shapes.
Method Parameter name Current value(s) Open3D example (default value)
vdW surface calculated by using nsc the Redwood dataset [Choi2015]
GLOBAL (generates a rough alignment as initialization)
voxel_down_sample() voxel size (vs) [0.1, 0.2, 0.3, 0.4, 0.5, 0.6, 0.7, 0.8, 0.9, 1.0, 1.1, 1.2] 0.05
estimate_normals() radius_normal vs * 2 vs * 2
estimate_normals() max_nn 30 30
compute_fpfh_feature() radius_feature vs * 5 vs * 5
compute_fpfh_feature() max_nn 100 100
registration_ransac_based_on_feature_matching() distance_threshold vs * 1.5 vs * 1.5
registration_ransac_based_on_feature_matching() TransformationEstimationPointToPoint() False False
registration_ransac_based_on_feature_matching() ransac_n 4 4
registration_ransac_based_on_feature_matching() checkers : CorrespondenceCheckerBasedOnEdgeLength 0.9 0.9
registration_ransac_based_on_feature_matching() checkers : CorrespondenceCheckerBasedOnDistance distance_threshold distance_threshold
registration_ransac_based_on_feature_matching() RANSACConvergenceCriteria(max_iteration, max_validation) 400000, 1000 4000000, 500
COLOR (refine initial alignment by using color)
estimate_normals() vs the value used in Global [ 0.04, 0.02, 0.01 ]
estimate_normals() radius size vs * 2 vs * 2
estimate_normals() max nn 30 30
registration_colored_icp() relative fitness 1.00E-06 1.00E-06
registration_colored_icp() relative rmse 1.00E-06 1.00E-06
registration_colored_icp() max iter 100 [ 50, 30, 14 ]
Evaluation
threshold 0.3
Voxel size Percentage of remaining points
0.1 99-100 0.2 95-96 0.3 67-70 0.4 43-46 0.5 29-31 0.6 21-22 0.7 16-17 0.8 12-13 0.9 10 1.0 8 1.1 7-8 1.2 5-6 3 0.9-1.1 7 0.3-0.6
AUTHOR INFORMATION Corresponding Author
* To whom correspondence should be addressed, E-mail: [email protected] and [email protected].
Author Contributions
The manuscript was written through contributions of all authors. All authors have given approval to the final version of the manuscript.
Funding Sources
This work was supported by the Centre National de la Recherche Scientifique (CNRS) and the Institut National de la Santé et de la Recherche Médicale (Inserm). This work was also supported by the French government through the French National Research Agency (ANR) under the project ‘Investissements d’Avenir’ UCAJEDI with the reference number ANR-15-IDEX-01. ACKNOWLEDGMENT
The authors would like to thank Dr. Antonini, M. (Université Côte d’Azur, CNRS, I3S) for fruitful discussions on the project.
ABBREVIATIONS
SENSAAS, SENsitive Surface As A Shape; GLOBAL, Global registration; COLOR, Colored point
REFERENCES
1. Kortagere, S., Krasowski, M.D. and Ekins, S. (2009) The importance of discerning shape in molecular pharmacology. Trends in pharmacological sciences, 30, 138-147.
2. Nicholls, A., McGaughey, G.B., Sheridan, R.P., Good, A.C., Warren, G., Mathieu, M., Muchmore, S.W., Brown, S.P., Grant, J.A., Haigh, J.A. et al. (2010) Molecular shape and medicinal chemistry: a perspective. Journal of medicinal chemistry, 53, 3862-3886. 3. Maggiora, G., Vogt, M., Stumpfe, D. and Bajorath, J. (2014) Molecular similarity in
medicinal chemistry. Journal of medicinal chemistry, 57, 3186-3204.
4. Kumar, A. and Zhang, K.Y.J. (2018) Advances in the Development of Shape Similarity Methods and Their Application in Drug Discovery. Frontiers in chemistry, 6, 315.
5. Baum, D. and Hege, H.C. (2006), Computational Life Sciences: Second International
Symposium, CompLife 2006, Vol. 4216, pp. 183-193.
6. Campbell, R. and Flynn, P. (2001) A Survey Of Free-Form Object Representation and Recognition Techniques. Computer Vision and Image Understanding, 81, 166-210.
7. Rusinkiewicz, S. and Levoy, M. (2001) Efficient variants of the ICP algorithm.
Proceedings Third International Conference on 3-D Digital Imaging and Modeling,
145-152.
8. Bellekens, B., Spruyt, V., Berkvens, R. and Weyn, M. (2014) A survey of rigid 3D pointcloud registration algorithms. Fourth International Conference on Ambient
Computing, Applications, Services and Technologies, Proceedings, 8-13.
9. Zhou, Q.-Y., Park, J. and Koltun, V. (2018) Open3D: A Modern Library for 3D Data Processing.
10. Douguet, D. (2010) e-LEA3D: a computational-aided drug design web server. Nucleic
acids research, 38, W615-621.
11. Eisenhaber, F., Lijnzaad, P., Argos, P., Sander, C. and Scharf, M. (1995) The Double Cubic Lattice Method: Efficient Approaches to Numerical Integration of Surface Area and Volume and to Dot Surface Contouring of Molecular Assemblies. J. Computat.
Chem., 16, 273-284.
12. Bondi, A. (1964) van der Waals Volumes and Radii. J. Phys. Chem., 68, 441-451.
13. Shinada, N.K., de Brevern, A.G. and Schmidtke, P. (2019) Halogens in Protein-Ligand Binding Mechanism: A Structural Perspective. Journal of medicinal chemistry.
14. Rusu, R.B., Blodow, N. and Beetz, M. (2009) Fast Point Feature Histograms (FPFH) for 3D Registration. International Conference on Robotics and Automation (ICRA).
15. Fischler, M.A. and Bolles, R.C. (1981) Random Sample Consensus: A Paradigm for Model Fitting with Applications to Image Analysis and Automated Cartography. Comm.
Of the ACM, 24, 381-395.
16. Choi, S., Zhou, Q.-Y. and Koltun, V. (2015) Robust Reconstruction of Indoor Scenes.
IEEE Conference on Computer Vision and Pattern Recognition (CVPR).
17. Park, J., Zhou, Q.-Y. and Koltun, V. (2017) Colored Point Cloud Registration Revisited.
IEEE International Conference on Computer Vision (ICCV), 143-152.
18. Stumpfe, D. and Bajorath, J. (2011) Similarity searching. WIREs Comput Mol Sci, 1, 260-282.
19. Falck, J.R., Koduru, S.R., Mohapatra, S., Manne, R., Atcha, K.R., Atcha, R., Manthati, V.L., Capdevila, J.H., Christian, S., Imig, J.D. et al. (2014) 14,15-Epoxyeicosa-5,8,11-trienoic Acid (14,15-EET) surrogates: carboxylate modifications. Journal of medicinal
chemistry, 57, 6965-6972.
20. Matta, C.F., Arabi, A.A. and Weaver, D.F. (2010) The bioisosteric similarity of the tetrazole and carboxylate anions: clues from the topologies of the electrostatic potential and of the electron density. European journal of medicinal chemistry, 45, 1868-1872. 21. Brown, N. (2014) Bioisosteres and Scaffold Hopping in Medicinal Chemistry. Molecular
informatics, 33, 458-462.
22. Grant, J.A., Gallardo, M.A. and Pickup, B.T. (1996) A fast method of molecular shape comparison: A simple application of a Gaussian description of molecular shape. Journal
of Computational Chemistry, 17, 1653-1666.
23. Hawkins, P.C., Skillman, A.G. and Nicholls, A. (2007) Comparison of shape-matching and docking as virtual screening tools. Journal of medicinal chemistry, 50, 74-82.
24. OpeneEyeScientificSoftware. ROCS 3.1.0 ; OMEGA 2.4.3.
25. Gasteiger, J., Rudolph, C. and Sadowski, J. (1990) Automatic Generation of 3D-Atomic Coordinates for Organic Molecules. Tetrahedron Comp. Method, 3, 537-547.
26. Hawkins, P.C., Skillman, A.G., Warren, G.L., Ellingson, B.A. and Stahl, M.T. (2010) Conformer generation with OMEGA: algorithm and validation using high quality structures from the Protein Databank and Cambridge Structural Database. Journal of
chemical information and modeling, 50, 572-584.
27. Douguet, D. (2018) Data Sets Representative of the Structures and Experimental Properties of FDA-Approved Drugs. ACS medicinal chemistry letters, 9, 204-209.
28. Baum, D. (2005), Computational Life Sciences: First International Symposium,
CompLife 2005, pp. 198-207.
29. Baum, D. (2007) A Point-Based Algorithm for Multiple 3D Surface Alignment of Drug-Sized Molecules.
30. Sanders, M.P., Barbosa, A.J., Zarzycka, B., Nicolaes, G.A., Klomp, J.P., de Vlieg, J. and Del Rio, A. (2012) Comparative analysis of pharmacophore screening tools. Journal of
chemical information and modeling, 52, 1607-1620.
31. Venkatraman, V., Perez-Nueno, V.I., Mavridis, L. and Ritchie, D.W. (2010) Comprehensive comparison of ligand-based virtual screening tools against the DUD data set reveals limitations of current 3D methods. Journal of chemical information and
modeling, 50, 2079-2093.
32. Vainio, M.J., Puranen, J.S. and Johnson, M.S. (2009) ShaEP: molecular overlay based on shape and electrostatic potential. Journal of chemical information and modeling, 49, 492-502.
Figure 1 a) f) 4412 points 6382 points d) 6490 points b) c) e) g) 6490 points
Figure 2 Target Source 3 substructures: Imatinib Tranylcypromine Milnacipran Valsartan Irbesartan Adapalene Adapalene Valsartan Irbesartan Target Source
Imatinib Imatinib (moved)
Sorbate Sorbate (moved)
SorbateC
Tetrazole Carboxylic acid
part1 part3 a) b) c) e) d) Bictegravir part2 Sorbate
Figure 3
Original point cloud
6382 points Down-sampled point cloudvoxel size = 0.5 2143 points
Down-sampled point cloud voxel size = 1.0
583 points
Down-sampled point cloud voxel size = 2.0
Figure 4 Final alignment: COLORgfit = 1.0 cfit = 0.998 hfit = 0.996 RMSE = 0.105 Global alignment result:
GLOBALgfit = 0.254
RMSE = 0.190 voxel size = 0.4
b) Alignment of Sorbate(moved) on Sorbate
Final alignment: Voxel size Voxel size sc o re sc o re
Figure 4
c) Alignment of Imatinib-part2 on Imatinib
Final alignment:
COLORgfit = 0.726
cfit = 0.665 hfit = 0.638 RMSE = 0.184 Global alignment result:
GLOBALgfit = 0.625 RMSE = 0.190 voxel size = 0.8 Voxel size sc o re
Figure 5
a) Imatinib (Target) / Imatinib-part1 (Source) b) Imatinib (Target) / Imatinib-part2 (Source)
c) Imatinib (Target) / Imatinib-part3 (Source)
d) Sorbate (Target) / Sorbate-C (Source)
COLORgfit = 0.831
COLOR gfit = 0.534 COLOR gfit = 0.726
COLORgfit = 0.836
a) c)
Tetrazole (Target) / Carboxylic acid (Source) b)
Figure 6
h) Adapalene (Target) / Tetrazole (Source)
e) Valsartan (Target) / Tetrazole (Source) d) Irbesartan (Target) / Tetrazole (Source)
COLORgfit = 0.672
f) Adapalene (Target) / Carboxylic acid (Source)
COLORgfit = 0.686
COLORgfit = 0.690
g) Adapalene - carboxylate form (Target) / Tetrazole (Source)
COLORgfit = 0.606
i) Adapalene (Target) / Tetrazole (Source) Alternate pose
COLOR gfit = 0.612
COLORgfit = 0.603
Figure 7
b) Adapalene (Target) / Valsartan (Source) a) Adapalene (Target) / Irbesartan (Source)
d) Tranylcypromine (Target) / Milnacipran (Source) -COLOR gfit = 0.384
Milnacipran (Target) / Tranylcypromine (Source) -COLORgfit = 0.685
c) Valsartan (Target) / Irbesartan (Source)
COLORgfit = 0.269 Milnacipran point cloud Tranylcypromine point cloud COLORgfit = 0.325 COLORgfit = 0.443
Figure 8 Conformer 3 COLORgfit = 0.763 Conformer 4 COLOR gfit = 0.472
Bictegravir (4 conformers)
Conformer 1 / Conformer 1 COLORgfit = 1 Conformer 1 / Conformer 2 COLOR gfit = 0.660Figure 9
COLORgfit value range
P e rc e n ta ge


![LES " SIX " FRANCE [the "six" France]](data:image/gif;base64,R0lGODlhAQABAIAAAP///wAAACH5BAEAAAAALAAAAAABAAEAAAICRAEAOw==)